Abstract
Chronic pulmonary infection with Pseudomonas aeruginosa is common in cystic fibrosis (CF) patients. P. aeruginosa lipopolysaccharide (LPS), phosholipase C (PLC), and exotoxin A (ETA) were evaluated for their ability to induce pulmonary inflammation in mice following intranasal inoculation. Both LPS and PLC induced high levels of tumor necrosis factor alpha (TNF-α), interleukin 1β (IL-1β), IL-6, gamma interferon (IFN-γ), MIP-1α and MIP-2 in the lungs but did not affect IL-18 levels. ETA did not induce TNF-α and was a weak inducer of IL-1β, IL-6, macrophage inflammatory protein 1α (MIP-1α), and MIP-2. Remarkably, ETA reduced constitutive lung IL-18 levels. LPS was the only factor inducing IFN-γ. LPS, PLC, and ETA all induced cell infiltration in the lungs. The role of interferon regulatory factor-1 (IRF-1) in pulmonary inflammation induced by LPS, PLC, and ETA was evaluated. When inoculated with LPS, IRF-1 gene knockout (IRF-1 KO) mice produced lower levels of TNF-α, IL-1β, and IFN-γ than did wild-type (WT) mice. Similarly, a milder effect of ETA on IL-1β and IL-18 was observed for IRF-1 KO than for WT mice. In contrast, the cytokine response to PLC did not differ between WT and IRF-1 KO mice. Accordingly, LPS and ETA, but not PLC, induced expression of IRF-1 mRNA. IRF-1 deficiency had no effect on MIP-1α and MIP-2 levels and on cell infiltration induced by LPS, PLC, or ETA. Flow cytometric evaluation of lung mononuclear cells revealed strongly reduced percentages of CD8+ and NK cells in IRF-1 KO mice compared to percentages observed for WT mice. These data indicate that different virulence factors from P. aeruginosa induce pulmonary inflammation in vivo and that IRF-1 is involved in some of the cytokine responses to LPS and ETA.
Chronic Pseudomonas aeruginosa infection accounts for most of the morbidity and mortality in cystic fibrosis (CF) patients. P. aeruginosa infection in the lungs of CF patients is associated with a pronounced antibody response against several bacterial antigens and by a massive neutrophilic infiltrate, which eventually leads to tissue damage. P. aeruginosa, a gram-negative bacterium, produces several extracellular factors which participate in the pathogenesis of infections caused by this organism (22). Although endotoxin (lipopolysaccharide [LPS]) from P. aeruginosa is not as toxic as that from enterobacteria (22), it is nonetheless able to induce a pronounced inflammatory response (13, 14). P. aeruginosa produces two known phospholipases C (PLC), one hemolytic and one nonhemolytic (33). Whereas the nonhemolytic PLC has no demonstrated pathogenic activities, the hemolytic form causes increased vascular permeability, end organ damage, and death when injected into mice (2, 27). Therefore, it is likely that hemolytic PLC acts as an important virulent factor during P. aeruginosa infection. A third virulence factor produced by P. aeruginosa is exotoxin A (ETA), a protein toxin that inhibits polypeptide synthesis through ADP ribosylation of elongation factor 2 (34). ETA is detectable in sputum samples of patients infected with P. aeruginosa (13, 15) and displays proinflammatory activities when administered intravenously at high doses (5). Therefore, ETA could also contribute to modulate the host response to P. aeruginosa infection.
Primary alterations in the inflammatory response have been implicated as possible factors involved in the increased susceptibility of CF patients to pulmonary infection (1). Recently, Kelley and Elmer reported a reduced expression of interferon regulatory factor 1 (IRF-1) in the nasal and intestinal epithelia of mice with CF, suggesting that a dysregulation of this transcription factor may influence the development of the inflammatory and antibacterial response in patients with CF (18). IRF-1 regulates the expression of several genes involved in immunity and inflammation. Genes regulated by IRF-1 include, among others, the cytokines alpha/beta interferon (IFN-α/β), IFN-γ, interleukin 12 (IL-12), and IL-15, as well as the intracellular cysteine protease caspase 1, inducible nitric oxide synthase, major histocompatibility complex class I molecules, and β2-microglobulin (8, 10, 17, 21, 23, 24, 31, 37, 38). On the other hand, IRF-1 is induced by IFN-α/β, IFN-γ, and IL-12, therefore generating a positive loop that amplifies IFN effects (11, 12, 28). IRF-1 seems to be positioned at the intersection of different pathways leading to a Th1 response and to host defense against microorganisms.
In the present report, using a model of intranasal inoculation, the proinflammatory activities of P. aeruginosa LPS, PLC, and ETA were compared. Production of cytokines and chemokines and cellular infiltration in the lungs were evaluated. Because low levels of IRF-1 are possibly involved in the altered inflammatory response typical of CF (18), IRF-1-deficient (IRF-1 gene knockout [IRF-1 KO]) mice were used to investigate a possible role for this transcription factor in pulmonary inflammation induced by P. aeruginosa LPS, PLC, and ETA.
MATERIALS AND METHODS
Materials.
P. aeruginosa LPS (serotype 10) was from Sigma (St. Louis, Mo.), ETA was from List Biological Laboratories (Campbell, Calif.), and PLC was purified from P. aeruginosa PAO1 overexpressing the plcHR operon as previously described (39).
Animals and treatments.
Animal protocols were approved by the Animal Studies Committee of the University of Colorado Health Sciences Center. Mice homozygous for the IRF-1 gene were previously described (24). Male and female wild-type (WT) and IRF-1 KO mice between 8 and 10 weeks of age and of C57BL/6 background were used. Mice were lightly anesthetized with isoflurane (Abbott, North Chicago, Ill.) and 50 μl of the experimental agent was administered intranasally. Control mice were inoculated with 50 μl of pyrogen-free phosphate-buffered saline (PBS). After 2, 6, 12, 24 or 48 h, mice were anesthetized with isoflurane and bled from the retro-orbital plexus. The whole lungs were excised, weighed, and homogenized in sterile PBS containing 0.01% Tween 20 (1:4, wt/vol). Samples were centrifuged at 3,000 × g for 10 min at 4°C, and the supernatant was collected and stored at −70°C until cytokine measurement.
BAL.
To evaluate cellular content in the bronchoalveolar lavage (BAL) specimen, the trachea was exposed through a midline incision and cannulated with a sterile, 23-gauge needle. The lavage was performed by instilling 1 ml of ice-cold sterile saline and collecting the fluid by aspiration. BAL fluid was centrifuged (3,000 × g, 10 min), and cell counts were performed with a hemocytometer.
RNase protection assay.
Mice were sacrificed 1 h after intranasal inoculation of either LPS, PLC, or ETA. The lungs were removed, and total RNA was extracted after homogenization with the RNA Stat-60 solution (Tel-Test, Friendswood, Tex.) according to the manufacturer's instructions. Extracted RNA was quantitated by spectrophotometry. For RNase protection assay, antisense riboprobes were prepared by transcription of cloned DNA templates with the T3 RNA polymerase (Ambion, Austin, Tex.), labeled with [α-32P]UTP, and purified by polyacrylamide gel electrophoresis and elution in ammonium acetate buffer containing EDTA and sodium dodecyl sulfate. Five micrograms of RNA was hybridized overnight at 55°C with approximately 105 cpm of each labeled riboprobe. Unhybridized RNA was digested with RNases A and T1 (Ambion) for 1.5 h at 37°C. Hybridized and RNase-protected RNA was precipitated, washed, and electrophoresed on polyacrylamide gels. Hybrids containing the mRNA of interest were electrophoresed with hybrids containing the housekeeping gene RNA cyclophilin. The radioactivity of the riboprobes in the hybrids was quantitated by a PhosphorImager (Molecular Dynamics, Sunnyvale, Calif.).
Cytokine measurement.
Tumor necrosis factor alpha (TNF-α), IL-1β, macrophage inflammatory protein 1α (MIP-1α), MIP-2, and IL-18 were measured by electrochemiluminescence assays. The TNF-α, MIP-1α, and IL-18 assays have been previously described (6, 7, 9). For measurement of IL-1β and MIP-2 a similar procedure was employed, using antibodies and recombinant proteins obtained from Pierce Endogen (Rockford, Ill.) for IL-1β and from R&D Systems (Minneapolis, Minn.) for MIP-2. IFN-γ and IL-6 were measured with enzyme-linked immunosorbent assay kits from BD PharMingen (San Diego, Calif.). The IL-18 assay detects both precursor and mature IL-18, whereas the IL-1β assay is specific for mature IL-1β.
MPO assay.
Myeloperoxidase (MPO) activity was measured in lung homogenates by the kinetic assay as previously described (25).
LMC isolation.
For lung mononuclear cell (LMC) isolation, lungs were excised and minced into small pieces. The tissue was incubated in digestion buffer consisting of 20 ml of Hanks' balanced salt solution (Invitrogen Inc., Carlsbad, Calif.) supplemented with 1% streptomycin and penicillin, 20% fetal calf serum (Invitrogen), dispase II (2.4 U/ml), collagenase II (14.3 U/ml), and collagenase IV (25.5 U/ml; all from Sigma) for 60 min while shaking at 37°C. After two washing steps with Hanks' balanced salt solution, cells were separated from tissue debris by filtration through a 100-μm-pore-size cell strainer followed by purification through a discontinuous 40 to 80% Percoll gradient (Sigma) for 20 min at 600 × g. Cells were used for flow cytometry as indicated below.
Flow cytometry.
The isolated LMC were washed twice in staining buffer consisting of PBS supplemented with 1% fetal calf serum and 0.1% azide. Flow cytometry followed routine procedures using 105 LMC per sample. To measure the expression of CD3ɛ (clone 145-2C11), CD4 (clone L3T4), CD8α (clone 53-6.7), F4/80 (clone MCA497F), and NK1.1 (clone PK136), cells were labeled with either a fluorescein isothiocyanate- or phycoerythrin-labeled antibody (BD PharMingen; Serotec for F4/80). Flow cytometric analysis was conducted on a FACSCalibur (BD PharMingen) and analyzed by using the CELLQUEST analysis program (BD PharMingen).
Statistical analysis.
Data are expressed as means ± standard errors of the means (SEM). The statistical significance of differences between treatment and control groups was determined by factorial analysis of variance (ANOVA) and a Bonferroni-Dunn procedure as post-hoc test. Differences were considered statistically significant for P values of <0.05. Statistical analyses were performed using Stat-View 4.51 software (Abacus Concepts, Calabasas, Calif.).
RESULTS
Pattern of cytokine production following intranasal inoculation of P. aeruginosa LPS, PLC, or ETA.
To characterize the in vivo proinflammatory activity of P. aeruginosa LPS, PLC, and ETA, we evaluated the kinetics of cytokine production in the lungs of WT mice inoculated with these virulence factors. Preliminary dose-response experiments were performed to identify the optimal doses of LPS, PLC, and ETA (not shown). For each virulence factor, a dose that induced lung cytokine production without resulting in lethality during the first 48 h following inoculation was selected. The selected doses were 10 μg/mouse for LPS, 0.5 μg/mouse for PLC, and 2 μg/mouse for ETA. These doses were used throughout the course of the subsequent studies.
As expected, high cytokine levels were observed in the lung homogenate of mice inoculated with LPS (Table 1). The kinetics of cytokine production indicates early (2 to 6 h) increases in the levels of the proinflammatory cytokines TNF-α, IL-1β, IL-6 and the chemokines MIP-1α and MIP-2. On the other hand, IFN-γ levels were significantly increased only 24 to 48 h following inoculation of LPS. No major changes in lung-associated IL-18 levels were observed after administration of LPS. Inoculation of PLC induced a pattern of cytokine production similar to the one observed with LPS, although TNF-α levels were lower in PLC-inoculated mice than in mice exposed to LPS (Table 1). PLC did not result in significant alterations in lung IL-18 or IFN-γ levels at any of the time points evaluated. Administration of ETA did not induce TNF-α or IFN-γ (Table 1). However, levels of IL-1β, IL-6, MIP-1α, and MIP-2 were all significantly elevated in the lungs of ETA-inoculated mice. The kinetics of cytokine production was delayed, and the maximal levels were lower in mice receiving ETA than in groups inoculated with LPS or PLC. Of interest, expression of IL-18 was significantly reduced in the lungs of mice receiving ETA; this effect was already evident 2 h following inoculation and continued until 48 h. Doses of ETA as low as 20 ng/mouse were effective in significantly reducing lung IL-18 levels (Table 2). No alterations in serum or liver-associated IL-18 levels were observed following intranasal inoculation of ETA, indicating a local effect in the lung (Table 2). Similarly, intranasal inoculation of either LPS, PLC, or ETA did not alter serum or liver-associated levels of any of the cytokines measured (data not shown).
TABLE 1.
Cytokine levels in lung homogenates of mice inoculated with LPS, PLC, or ETAa
| Cytokine | Inoculum | Mean ± SEM of cytokine level (pg/ml) at
|
|||||
|---|---|---|---|---|---|---|---|
| Control | 2 | 6 | 12 | 24 | 48 | ||
| TNF-α | LPS | <15 | 517.7 ± 94.7*** | 171.7 ± 12.3* | 146.1 ± 23.6* | 32.2 ± 17.1 | <15 |
| PLC | <15 | 93.7 ± 4.6*** | 41.5 ± 20.8** | <15 | <15 | <15 | |
| ETA | <15 | <15 | <15 | <15 | <15 | <15 | |
| IL-1β | LPS | <10 | 670.7 ± 70.9*** | 678.9 ± 173.5*** | 710.0 ± 133.0*** | 631.0 ± 125.2** | 240.0 ± 53.5 |
| PLC | <10 | 458.8 ± 27.8*** | 744.5 ± 55.5*** | 237.0 ± 2.9* | 90.3 ± 3.3 | <10 | |
| ETA | <10 | <10 | <10 | 18.6 ± 6.7* | 17.5 ± 1.9* | 11.3 ± 1.4 | |
| IL-6 | LPS | <20 | 4,408 ± 1899* | 6,234 ± 1187** | 4,702 ± 1087* | 768 ± 294.4* | 5,367 ± 976.0* |
| PLC | <20 | 7,588 ± 1826* | 6,265 ± 1346** | 1,015 ± 658.2* | 2,413 ± 1317* | <20 | |
| ETA | <20 | <20 | 83.3 ± 68.0 | 503.5 ± 396.3* | <20 | <20 | |
| IL-18 | LPS | 741 ± 271 | 714 ± 276 | 797 ± 185 | 775 ± 86.8 | 937 ± 67 | 618 ± 51.9 |
| PLC | 700 ± 54.2 | 494 ± 51.6 | 509 ± 26.0 | 564 ± 59.2 | 510 ± 52.8 | 594 ± 113.9 | |
| ETA | 825 ± 80.1 | 660 ± 50.3* | 355 ± 60.7*** | 335 ± 22.3*** | 210 ± 12.6*** | 125 ± 5.9*** | |
| IFN-γ | LPS | 55.9 ± 2.1 | 35.3 ± 2.9 | 51.5 ± 4.6 | 63.0 ± 4.8 | 266.1 ± 72.9** | 244.9 ± 11.1** |
| PLC | 44.4 ± 7.4 | 42.8 ± 3.5 | 53.7 ± 7.2 | 68.2 ± 4.7 | 56.4 ± 6.3 | 81.6 ± 9.3 | |
| ETA | 74.4 ± 13.3 | 58.6 ± 18.8 | 76.4 ± 16.2 | 63.6 ± 4.6 | 90.9 ± 36.2 | 75.2 ± 8.3 | |
| MIP-1α | LPS | <15 | 349.0 ± 67.7*** | 400.3 ± 56.4*** | 284.1 ± 23.0*** | 235.8 ± 27.0*** | 189.6 ± 19.5** |
| PLC | <15 | 275.1 ± 27.8*** | 259.1 ± 55.5*** | 30.0 ± 2.9 | 18.8 ± 3.3 | <15 | |
| ETA | <15 | <15 | <15 | 19.0 ± 6.7* | 16.8 ± 3.2* | <15 | |
| MIP-2 | LPS | <15 | 3,543 ± 1194*** | 1,657 ± 166* | 1,169 ± 89.8* | 870.5 ± 116.2* | 541.6 ± 20.9 |
| PLC | <15 | 1,875 ± 77.5*** | 1,014 ± 272.4*** | 400.5 ± 38.4 | 270.1 ± 57.2 | 215.0 ± 35.9 | |
| ETA | <15 | <15 | <15 | 163.3 ± 28.5* | 172.3 ± 11.1*** | 145.1 ± 11.6*** | |
Groups of three to five mice were inoculated with either LPS (10 μg/mouse), PLC (0.5 μg/mouse), or ETA (2μg/mouse). Control mice received vehicle. Lungs were removed at the indicated time points (in hours) and cytokine levels were measured in lung homogenates.
*, P < 0.05; **, P < 0.01; ***, P < 0.001 versus respective control by factorial ANOVA.
TABLE 2.
Inhibition of lung IL-18 levels by ETA
| Dose of ETA (ng/mouse)a | Mean ± SEM of IL-18 (pg/ml) in indicated tissueb
|
||
|---|---|---|---|
| Lungc | Liver | Serum | |
| 0 (control) | 838.5 ± 59.8 | 1,480 ± 140 | 55.3 ± 8.6 |
| 20 | 683.2 ± 40.1* | 1,540 ± 120 | 79.7 ± 7.3 |
| 200 | 449.7 ± 40.7*** | 1,780 ± 70 | 63.7 ± 23.4 |
| 2,000 | 286.1 ± 28.5*** | 1,580 ± 60 | 83.3 ± 18.2 |
Groups of three to five mice were inoculated with the indicated doses of ETA. Control mice received vehicle.
Lungs and liver were removed 24 h following inoculation, and IL-18 levels were measured in the homogenates. Blood was collected 24 h following inoculation, and serum was prepared.
*, P < 0.05; **, P < 0.001 versus respective control by factorial ANOVA.
Lung inflammation following administration of LPS, PLC, or ETA.
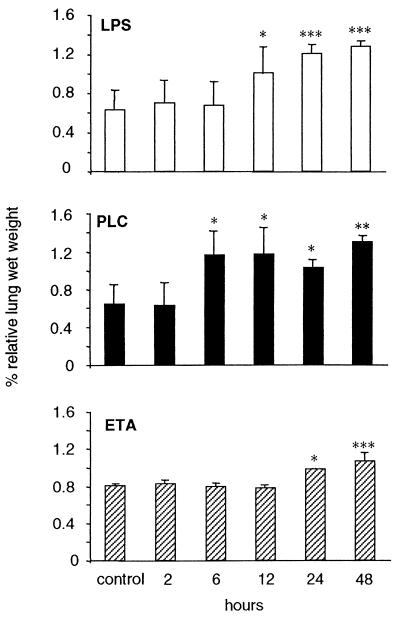
Figure 1 shows the time course of relative lung wet weight in WT mice receiving intranasal inoculation of either LPS, PLC, or ETA. As shown, each of the three virulence factors significantly increased lung wet weight. ETA had a delayed effect compared to LPS or PLC.
FIG. 1.
Increase in relative lung wet weight following administration of LPS, PLC, or ETA. Mice were inoculated with either LPS (10 μg/mouse), PLC (0.5 μg/mouse), or ETA (2 μg/mouse). Control mice received vehicle. At the indicated time points mice were bled and sacrificed, and body weight was recorded. Lungs were removed and weighed. Data are means ± SEM of five mice per group and are expressed as percentage of lung weight over body weight. ∗, P < 0.05; ∗∗∗, P < 0.001 versus respective control by factorial ANOVA.
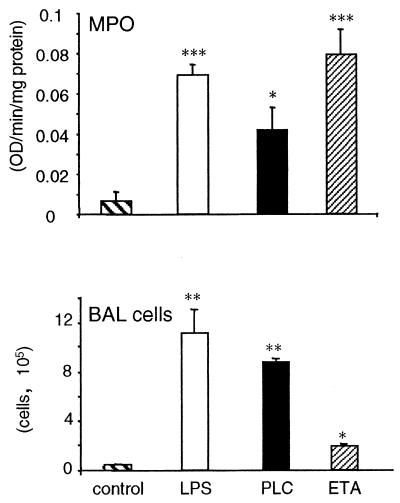
Pulmonary cellular infiltration in WT mice receiving LPS, PLC, or ETA was evaluated by measuring lung MPO activity and by counting the number of cells in the BAL fluid. As shown in Fig. 2, inoculation of each of the three virulence factors significantly increased lung MPO activity and BAL cellular content.
FIG. 2.
Cellular infiltrate in the lungs following inoculation of LPS, PLC, or ETA. Mice were inoculated with either LPS (10 μg/mouse), PLC (0.5 μg/mouse), or ETA (2 μg/mouse). Control mice received vehicle. (Top) Mice were sacrificed either 6 h (LPS and PLC) or 24 h (ETA) following inoculation. Lungs were removed, and MPO levels were evaluated as described in Materials and Methods. (Bottom) Mice were sacrificed 24 h following inoculation, and BAL was performed as described in Materials and Methods. Data are means ± SEM of five mice per group. ∗, P < 0.05; ∗∗, P < 0.01; ∗∗∗, P < 0.001 versus respective control by factorial ANOVA.
IRF-1 induction by LPS, PLC, or ETA.
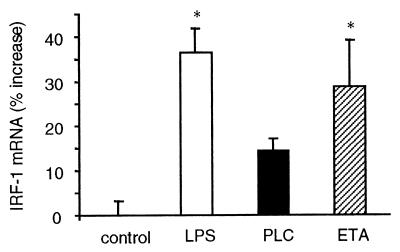
We next investigated whether intranasal inoculation of LPS, PLC, and ETA was able to induce expression of IRF-1 in the lungs of WT mice. Results shown in Fig. 3 indicate a significant increase in IRF-1 mRNA levels in the lungs of mice inoculated with LPS or ETA, whereas the increase observed in PLC-inoculated mice did not reach statistical significance. However, since we measured IRF-1 mRNA levels only 1 h following inoculation, the possibility remains that PLC might induce IRF-1 expression at a later or earlier time point.
FIG. 3.
Induction of IRF-1 mRNA following inoculation of LPS, PLC, or ETA. Mice were inoculated with either LPS (10 μg/mouse), PLC (0.5 μg/mouse), or ETA (2 μg/mouse). Control mice received vehicle. One hour after inoculation, lungs were removed, total RNA was extracted, and RNase protection assay for IRF-1 was performed as described in Materials and Methods. Data are means ± SEM of five mice per group and are expressed as the percent increase of IRF-1 mRNA compared to control mice. ∗, P < 0.05 versus control by factorial ANOVA.
Cytokine production in the lungs of IRF-1 KO mice.
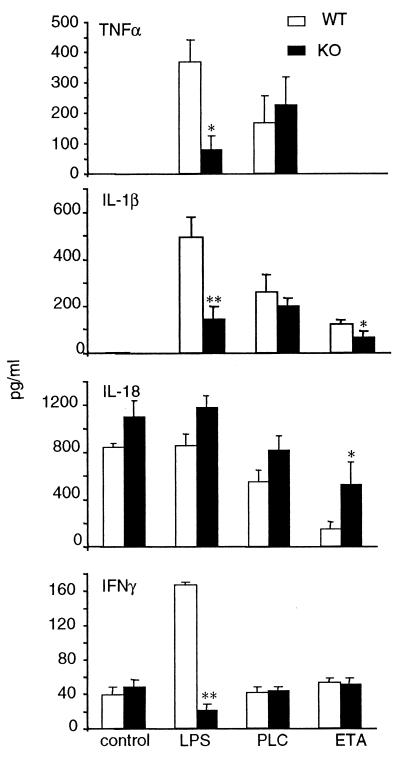
The role of IRF-1 in mediating cytokine production following administration of LPS, PLC, and ETA was evaluated by comparing the responses of WT and IRF-1 KO mice. The time points for measurement of TNF-α, IL-1β, IL-18, and IFN-γ were selected based on results of the time course experiments presented in Table 1. As shown in Fig. 4, markedly reduced levels of TNF-α, IL-1β, and IFN-γ were observed for IRF-1 KO compared to WT mice receiving LPS. In contrast to what was observed following administration of LPS, similar levels of TNF-α and IL-1β were induced in WT and IRF-1 KO mice by administration of PLC. On the other hand, significantly reduced levels of IL-1β were present in IRF-1 KO compared to WT mice inoculated with ETA. In addition, the inhibition of lung-associated IL-18 levels was less marked in IRF-1 KO than in WT mice. In fact, a 77% reduction in lung IL-18 levels was observed for WT mice, whereas the reduction was 54% for IRF-1 KO mice. These data indicate that modulation of cytokine production by LPS and ETA is partially IRF-1 dependent, whereas the effect of PLC is not.
FIG. 4.
Cytokine levels in WT and IRF-1 KO mice following inoculation of LPS, PLC, or ETA. WT (open bars) and IRF-1 KO (filled bars) mice were inoculated with either LPS (10 μg/mouse), PLC (0.5 μg/mouse), or ETA (2 μg/mouse). Control mice received vehicle. Mice were sacrificed either 2 h (for TNF-α), 6 h (for IL-1β and IL-18) or 24 h (for IFN-γ) after inoculation, and cytokine levels were measured in the lung homogenates. Data are means ± SEM of five mice per group. ∗, P < 0.05; ∗∗, P < 0.01 versus respective WT by unpaired Student's t test.
Chemokine levels and MPO activity in WT and IRF-1 KO mice.
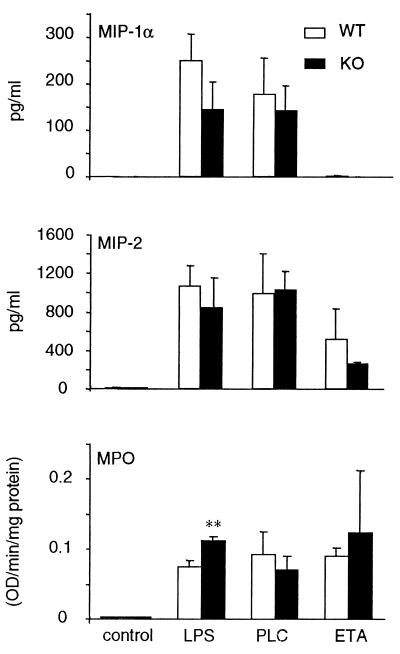
We next evaluated whether IRF-1 plays any role in the induction of the chemokines MIP-1α and MIP-2 and in the neutrophilic infiltration following administration of LPS, PLC, or ETA. As shown in Fig. 5, no significant differences were observed between WT and IRF-1 KO mice in terms of chemokine production. In addition, a small but significant increase in MPO activity was observed for IRF-1 KO compared to WT mice receiving LPS, whereas no differences were observed when PLC or ETA was administered.
FIG. 5.
Chemokine and MPO levels in WT and IRF-1 KO mice following inoculation of LPS, PLC, or ETA. WT (open bars) and IRF-1 KO (filled bars) mice were inoculated with either LPS (10 μg/mouse), PLC (0.5 μg/mouse), or ETA (2 μg/mouse). Control mice received vehicle. Mice were sacrificed 6 h after inoculation of LPS or PLC and 24 h after administration of ETA. Chemokine and MPO levels were measured in the lung homogenates. Data are means ± SEM of five mice per group. ∗∗, P < 0.01 versus respective WT by unpaired Student's t test.
LMC populations in WT and IRF-1 KO mice.
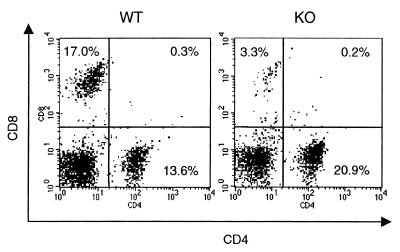
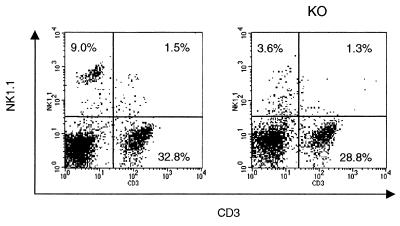
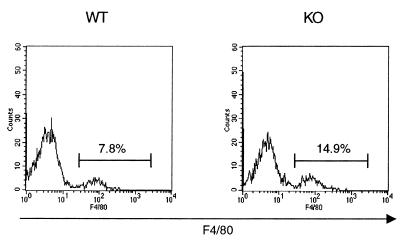
In order to investigate whether differences in LMC populations could account for the observed alterations in cytokine production between WT and IRF-1 KO mice, flow cytometric analysis was performed. As shown in Fig. 6, the percentage of CD8+ cells was strongly reduced in IRF-1 KO compared to WT mice (4.7% ± 0.8% versus 16.4% ± 1.4% CD8+ cells in IRF-1 KO versus WT mice, respectively; mean ± SEM, n = 6, P = 0.0001). In addition, as shown in Fig. 7, significantly fewer NK cells were present in the lungs of IRF-1 KO mice than in the lungs of WT mice (2.9% ± 1.2% versus 7.4% ± 0.1% NK1.1+ cells in IRF-1 KO versus WT mice, respectively; mean ± SEM, n = 6, P = 0.015). In contrast with the reduction in CD8+ and NK1.1+ cells, an increased percentage of macrophages (F4/80+ cells) was observed in the lungs of IRF-1 KO compared to WT mice (17.7% ± 0.8% versus 8.6% ± 0.7% F4/80+ cells in IRF-1 KO versus WT mice, respectively; mean ± SEM, n = 6, P = 0.0002) (Fig. 8). No significant differences between the lung B-cell populations (CD45R+/B220 cells) of WT and IRF-1 KO mice were observed (data not shown).
FIG. 6.
Reduced CD8+ cells in the lungs of IRF-1 KO mice. LMC were isolated from untreated WT and IRF-1 KO mice. Cells were evaluated by flow cytometry for expression of CD4 and CD8. Results from one representative mouse per genotype are shown and are representative of four independent analyses performed.
FIG. 7.
Reduced NK cells in the lungs of IRF-1 KO mice. LMC were isolated from untreated WT and IRF-1 KO mice. Cells were evaluated by flow cytometry for expression of CD3 and NK1.1. Results from one representative mouse per genotype are shown and are representative of four independent analyses performed.
FIG. 8.
Increased percentage of macrophages in the lungs of IRF-1 KO mice. LMC were isolated from untreated WT and IRF-1 KO mice. Cells were evaluated by flow cytometry for expression of F4/80. Results from one representative mouse per genotype are shown and are representative of four independent analyses performed.
DISCUSSION
In the present report we compared the pulmonary proinflammatory activities of three P. aeruginosa virulence factors and evaluated the role played by the transcription factor IRF-1 in modulating these responses.
Each of the factors examined—LPS, PLC, and ETA—induced a distinctive pattern of cytokine and chemokine production in the lungs. It is important to stress that the method used to administer the three virulence factors, i.e., intranasal inoculation, induced only a local inflammatory response in the lungs, with no apparent systemic effects. Therefore, compared to systemic administration of proinflammatory agents, the model used more closely reflects the pulmonary inflammation observed in CF patients, in which systemic involvement is usually not observed.
Although some in vivo and in vitro proinflammatory activities of PLC have been previously reported (2, 19, 26, 27), to our knowledge this is the first study analyzing a broad range of cytokines induced in vivo by PLC. Furthermore, systemic administration of PLC had previously been employed, whereas local pulmonary inflammation elicited by intranasal administration was used in the present studies. At the dose used, PLC was a strong inflammatory agent, with a potency and a kinetics of induction similar to those of LPS. A milder cytokine response was induced when ETA was inoculated. These data are in agreement with previous reports indicating that intratracheal administration of ETA does not induce TNF-α production and actually inhibits induction of TNF-α by LPS (14). However, several reports have pointed to a strong proinflammatory effect of ETA when administered intravenously, with induction of TNF-α and IL-18 and consequent liver failure (5, 35). These contrasting data seem to indicate a different target for ETA when local versus systemic administration is used.
One of the most interesting effects of ETA was the marked inhibition of lung IL-18 levels. Of all the cytokines analyzed, IL-18 is the only one to be constitutively produced (7), and the well-described role of ETA as an inhibitor of polypeptide synthesis (34) likely accounts for the observed effect. However, the implication of IL-18 inhibition by ETA for the response to P. aeruginosa infection could be important. In fact, IL-18 acts mainly as a potentiator of Th1 responses (4), whereas in CF patients the response to P. aeruginosa infection seems to be shifted towards a Th2 type (30). Inhibition of IL-18 production by ETA is a possible factor contributing to this shift.
Each of the three factors studied induced cellular infiltrate in the lungs, as evaluated by increased MPO activity in lung homogenates and by cell counts in the BAL fluid. Although the strong increase in chemokine production induced by LPS and PLC explains their ability to induce a pulmonary cell infiltrate, this is not the case for ETA. In fact, although very low levels of MIP-2 and MIP-1α were induced by ETA, the magnitude of MPO induction was not significantly different from the one induced by LPS or ETA. A possible explanation for this phenomenon is the induction of a different set of chemokines or other chemoattractants by ETA.
In agreement with previous data (36), we observed reduced levels of IFN-γ, TNF-α, and IL-1β in IRF-1 KO mice inoculated with LPS. IRF-1 deficiency was also associated with a reduced response to ETA, but not to PLC. These data were in agreement with the relative potency of the three factors in inducing expression of IRF-1 mRNA. Despite the observed alterations on production of proinflammatory cytokines in IRF-1 KO mice, IRF-1 deficiency did not alter induction of chemokines and MPO activity induced by either LPS, PLC, or ETA. A differential role for IRF-1 in chemokine production has been demonstrated. Thus, IRF-1 mediates induction of RANTES but not of IP-10 (3, 20). Our data indicate that IRF-1 is not required for induction of MIP-2 and MIP-1α in vivo and for neutrophilic infiltration in the lungs.
The lack of effect of IRF-1 deficiency on chemokine production occurred despite marked differences in mononuclear cell populations in the lungs of WT versus IRF-1 KO mice. Expanding previous observations by other investigators (24, 31, 32), we demonstrated reduced percentages of CD8+ lymphocytes and NK cells in the pulmonary compartment of IRF-1 KO mice. At the same time, the percentage of resident macrophages, as evaluated by F4/80+ staining, was increased in the lungs of IRF-1 KO compared to WT mice. Therefore, alterations in these immune cell populations are not sufficient to influence the chemokine production and neutrophilic infiltration in response to the three P. aeruginosa virulence factors that we studied.
The present report demonstrates that IRF-1 is involved in some inflammatory responses to the P. aeruginosa virulence factors LPS and ETA, but not PLC. Furthermore, the absence of IRF-1 did not influence chemokine production induced by any of the agents studied. It thus appears that the P. aeruginosa virulence factors studied are still able to induce inflammation even in the absence of IRF-1. IRF-1 is necessary for the generation of a Th1 response (23, 37). Therefore, in the absence of IRF-1, P. aeruginosa-induced inflammation develops in the context of reduced Th1 responses. Because Th1 cytokines seem to favor clearance of P. aeruginosa (16, 29), the low levels of IRF-1 present in CF patients' epithelia (18) might contribute to the persistence of P. aeruginosa infection and the chronic inflammation of the CF patient lung.
Acknowledgments
We thank Adriana Vasil for excellent technical support.
This work was supported by the Cystic Fibrosis Foundation (to G.F. and M.L.V.), by DFG Si 749/2-1 (to B.S.), by NIH AI-15614 (to C.A.D.), and by National Institute of Heart, Lung and Blood grant HL62608 (to M.L.V.).
REFERENCES
- 1.Balough, K., M. McCubbin, M. Weinberger, W. Smits, R. Ahrens, and R. Fick. 1995. The relationship between infection and inflammation in the early lung disease from cystic fibrosis. Ped. Pulmonol. 20:63-70. [DOI] [PubMed] [Google Scholar]
- 2.Berk, R. S., D. Brown, I. Coutinho, and D. Meyers. 1987. In vivo studies with two phospholipase C fractions from Pseudomonas aeruginosa. Infect Immun. 55:1728-1730. [DOI] [PMC free article] [PubMed] [Google Scholar]
- 3.Cheng, G., A. S. Nazar, H. S. Shin, P. Vanguri, and M. L. Shin. 1998. IP-10 gene transcription by virus in astrocytes requires cooperation of ISRE with adjacent kappaB site but not IRF-1 or viral transcription. J. Interferon Cytokine Res. 18:987-997. [DOI] [PubMed] [Google Scholar]
- 4.Dinarello, C. A. 1999. Interleukin-18. Methods 19:121-132. [DOI] [PubMed] [Google Scholar]
- 5.Faggioni, R., J. Jones-Carson, D. A. Reed, C. A. Dinarello, K. R. Feingold, C. Grunfeld, and G. Fantuzzi. 2000. Leptin-deficient (ob/ob) mice are protected from T cell-mediated hepatotoxicity: role of tumor necrosis factor-α and IL-18. Proc. Natl. Acad. Sci. USA 97:2367-2372. [DOI] [PMC free article] [PubMed] [Google Scholar]
- 6.Fantuzzi, G., and C. A. Dinarello. 1998. Stem cell factor-deficient mice have a dysregulation of cytokine production during local inflammation. Eur. Cytokine Netw. 9:85-92. [PubMed] [Google Scholar]
- 7.Fantuzzi, G., D. A. Reed, and C. A. Dinarello. 1999. Interleukin (IL)-12-induced interferon-gamma is dependent on caspase-1 processing of the IL-18 precursor. J. Clin. Investig. 104:761-767. [DOI] [PMC free article] [PubMed] [Google Scholar]
- 8.Fantuzzi, G., D. A. Reed, M. Qi, C. A. Dinarello, and G. Senaldi. 2001. Role of interferon regulatory factor-1 in the regulation of IL-18 production and activity. Eur. J. Immunol. 31:369-375. [DOI] [PubMed] [Google Scholar]
- 9.Fantuzzi, G., S. Sacco, P. Ghezzi, and C. A. Dinarello. 1997. Physiological and cytokine responses in interleukin-1β-deficient mice after zymosan-induced inflammation. Am. J. Physiol. 273:R400-R406. [DOI] [PubMed] [Google Scholar]
- 10.Fujita, T., Y. Kimura, M. Miyamoto, E. L. Barsoumian, and T. Taniguchi. 1989. Induction of endogenous IFN-α and IFN-β genes by a regulatory transcription factor, IRF-1. Nature 337:270.. [DOI] [PubMed] [Google Scholar]
- 11.Galon, J., C. Sudarshan, S. Ito, D. Finbloom, and J. J. O'Shea. 1999. IL-12 induces IFN regulating factor-1 (IRF-1) gene expression in human NK and T cells. J. Immunol. 162:7256.. [PubMed] [Google Scholar]
- 12.Harada, H., T. Fujita, M. Miyamoto, Y. Kimura, M. Maruyama, A. Furia, T. Miyata, and T. Taniguchi. 1989. Structurally similar but functionally distinct factors, IRF-1 and IRF-2, bind to the same regulatory elements of IFN and IFN-inducible genes. Cell 4:729.. [DOI] [PubMed] [Google Scholar]
- 13.Hirakata, H., N. Furuya, K. Tateda, M. Kaku, and K. Yamaguchi. 1993. In vivo production of exotoxin A and its role in endogenous Pseudomonas aeruginosa septicemia in mice. Infect. Immun. 61:2468-2473. [DOI] [PMC free article] [PubMed] [Google Scholar]
- 14.Hirakata, Y., T. Kirikae, F. Kirikae, T. Yamaguchi, K. Izumikawa, H. Takemura, S. Maesaki, K. Tomono, Y. Yamada, S. Kamihira, M. Nakano, S. Kitamura, and S. Kohno. 1999. Effect of Pseudomonas aeruginosa exotoxin A on endotoxin-induced tumour necrosis factor production in murine lung. J. Med. Microbiol. 48:471-477. [DOI] [PubMed] [Google Scholar]
- 15.Jaffar-Bandjee, M. C., A. Lazdunski, M. Bally, J. Carrere, J. P. Chazalette, and C. Galabert. 1995. Production of elastase, exotoxin A, and alkaline protease in sputa during pulmonary exacerbation of cystic fibrosis in patients chronically infected by Pseudomonas aeruginosa. J. Clin. Microbiol. 33:924-929. [DOI] [PMC free article] [PubMed] [Google Scholar]
- 16.Johansen, H. K., H. P. Hougen, J. Rygaard, and N. Hoiby. 1996. Interferon-gamma (IFN-γ) treatment decreases the inflammatory response in chronic Pseudomonas aeruginosa pneumonia in rats. Clin. Exp. Immunol. 103:212-218. [DOI] [PMC free article] [PubMed] [Google Scholar]
- 17.Kamijo, R., H. Harada, T. Matsuyama, M. Boslard, J. Gerecitano, D. Shapiro, J. Le, S. I. Koh, T. Kimura, S. J. Green, W. Mak, T. Taniguchi, and J. Vilcek. 1994. Requirement for transcription factor IRF-1 in NO synthase induction in macrophages. Science 263:1612.. [DOI] [PubMed] [Google Scholar]
- 18.Kelley, T. J., and H. L. Elmer. 2000. In vivo alterations of IFN regulatory factor-1 and PIAS1 protein levels in cystic fibrosis epithelium. J. Clin. Investig. 106:403-410. [DOI] [PMC free article] [PubMed] [Google Scholar]
- 19.Konig, B., M. L. Vasil, and W. Konig. 1997. Role of haemolytic and non-haemolytic phospholipase C from Pseudomonas aeruginosa in interleukin-8 release from human monocytes. J. Med. Microbiol. 46:471-478. [DOI] [PubMed] [Google Scholar]
- 20.Lee, A. H., J. H. Hong, and Y. S. Seo. 2000. Tumour necrosis factor-alpha and interferon-gamma synergistically activate the RANTES promoter through nuclear factor kappaB and interferon regulatory factor 1 (IRF-1) transcription factors. Biochem. J. 350:131-138. [PMC free article] [PubMed] [Google Scholar]
- 21.Limura, T., Y. Kadokawa, H. Harada, M. Matsumoto, M. Sato, Y. Kashiwazaki, M. Tarutani, R. S. Tan, T. Takasugi, T. Matsuyama, T. W. Mak, S. Noguchi, and T. Taniguchi. 1996. Essential and non-redundant roles of p48 (ISGF3 gamma) and IRF-1 in both type I and type II interferon responses, as revealed by gene targeting studies. Genes Cells 1:115.. [DOI] [PubMed] [Google Scholar]
- 22.Liu, P. V. 1974. Extracellular toxins of Pseudomonas aeruginosa. J. Infect. Dis. 130:S94-S99. [DOI] [PubMed] [Google Scholar]
- 23.Lohoff, M., D. Ferrick, H.-W. Mittrucker, G. S. Duncan, S. Bischof, M. Rollinghoff, and T. W. Mak 1997. Interferon regulator factor-1 is required for a T helper 1 immune response in vivo. Immunity 6:681.. [DOI] [PubMed] [Google Scholar]
- 24.Matsuyama, T., T. Kimura, M. Kitagawa, K. Pfeffer, T. Kawakami, N. Watanabe, T. M. Kundig, R. Amakawa, K. Kishihara, A. Wakeham, J. Potter, C. L. Furlonger, A. Naredran, H. Suzuki, P. S. Ohashi, C. L. Paige, T. Taniguchi, and T. W. Mak. 1993. Targeted disruption of IRF-1 and IRF-2 results in abnormal type I IFN gene induction and aberrant lymphocyte development. Cell 75:83.. [PubMed] [Google Scholar]
- 25.Melnikov, V. Y., T. Ecder, G. Fantuzzi, B. Siegmund, M. S. Lucia, C. A. Dinarello, R. W. Schrier, and C. L. Edelstein. 2001. Impaired IL-18 processing protects caspase-1-deficient mice from ischemic acute renal failure. J. Clin. Investig. 107:1145-1152. [DOI] [PMC free article] [PubMed]
- 26.Meyers, D. J., and R. S. Berk. 1990. Characterization of phospholipase C from Pseudomonas aeruginosa as a potent inflammatory agent. Infect. Immun. 58:659-666. [DOI] [PMC free article] [PubMed] [Google Scholar]
- 27.Meyers, D. J., K. C. Palmer, L. A. Bale, K. Kernacki, M. Preston, T. Brown, and R. S. Berk. 1992. In vivo and in vitro toxicity of phospholipase C from Pseudomonas aeruginosa. Toxicon 30:161-169. [DOI] [PubMed] [Google Scholar]
- 28.Miyamoto, M., T. Fujita, Y. Kimura, M. Maruyama, H. Harada, Y. Sudo, T. Miyata, and T. Taniguchi. 1988. Regulated expression of a gene encoding a nuclear factor, IRF-1, that specifically binds to IFN-β gene regulatory elements. Cell 54:903.. [DOI] [PubMed] [Google Scholar]
- 29.Moser, C., H. K. Johansen, Z. Song, H. P. Hougen, J. Rygaard, and N. Hoiby. 1997. Chronic Pseudomonas aeruginosa lung infection is more severe in Th2 responding BALB/c mice compared to Th1 responding C3H/NeN mice. APMIS 105:838-842. [PubMed] [Google Scholar]
- 30.Moser, C., S. Kjaergaard, T. Pressler, A. Kharazmi, C. Koch, and N. Hoiby. 2000. The immune response to chronic Pseudomonas aeruginosa lung infection in cystic fibrosis patients is predominantly of the Th2 type. APMIS 108:329-335. [DOI] [PubMed] [Google Scholar]
- 31.Ogasawara, K., S. Hida, N. Azimi, Y. Tagaya, T. Sato, T. Yokochi-Fukuda, T. A. Waldmann, T. Taniguchi, and S. Taki. 1998. Requirement for IRF-1 in the microenvironment supporting development of natural killer cells. Nature 391:700.. [DOI] [PubMed] [Google Scholar]
- 32.Ohteki, T., H. Yoshida, T. Matsuyama, G. S. Duncan, T. W. Mak, and P. S. Ohashi. 1998. The transcription factor interferon regulatory factor 1 (IRF-1) is important during the maturation of natural killer 1.1+ T cell receptor-alpha/beta+ (NK1+ T) cells, natural killer cells, and intestinal intraepithelial T cells. J. Exp. Med. 187:967-972. [DOI] [PMC free article] [PubMed] [Google Scholar]
- 33.Ostroff, R. M., A. I. Vasil, and M. L. Vasil. 1990. Molecular comparison of a nonhemolytic and a hemolytic phospholipase C from Pseudomonas aeruginosa, J. Bacteriol. 172:5915-5923. [DOI] [PMC free article] [PubMed] [Google Scholar]
- 34.Pavloskis, O. R., B. H. Iglewski, and M. Pollack. 1978. Mechanism of action of Pseudomonas aeruginosa exotoxin A in experimental mouse infections: adenosine diphosphate ribosylation of elongation factor 2. Infect. Immun. 19:29-33. [DOI] [PMC free article] [PubMed] [Google Scholar]
- 35.Schumann, J., S. Angermuller, R. Bang, M. Lohoff, and G. Tiegs. 1998. Acute hepatotoxicity of Pseudomonas aeruginosa Exotoxin A in mice depends on T cells and TNF. J. Immunol. 161:5745-5754. [PubMed] [Google Scholar]
- 36.Senaldi, G., C. L. Shaklee, J. Guo, L. Martin, T. Boone, T. W. Mak, and T. R. Ulich. 1999. Protection against the mortality associated with disease models mediated by TNF and IFN-gamma in mice lacking IFN regulatory factor-1. J Immunol. 163:6820-6826. [PubMed] [Google Scholar]
- 37.Taki, S., T. Sato, K. Ogasawara, T. Kukuda, M. Sato, S. Hida, G. Suzuki, M. Mitsuyama, E. H. Shin, S. Kojima, T. Taniguchi, and Y. Asano. 1997. Multistage regulation of Th1-type immune responses by the transcription factor IRF-1. Immunity 6:673.. [DOI] [PubMed] [Google Scholar]
- 38.Tamura, T., M. Ishihara, M. S. Lamphier, N. Tanaka, I. Oishi, S. Aizawa, T. Matsuyama, T. W. Mak, S. Taki, and T. Taniguchi. 1995. An IRF-1-dependent pathway of DNA damage-induced apoptosis in mitogen-activated T lymphocytes. Nature 376:596.. [DOI] [PubMed] [Google Scholar]
- 39.Terada, L. S., K. A. Johansen, S. Nowbar, A. I. Vasil, and M. L. Vasil. 1999. Pseudomonas aeruginosa hemolytic phospholipase C suppresses neutrophil respiratory burst activity. Infect. Immun. 67:2371-2376. [DOI] [PMC free article] [PubMed] [Google Scholar]


