

Abstract
We used chaos and complexity theory to analyse waiting-list data (1998-2001) pertaining to over 20 000 National Health Service (NHS) patients from general surgical, orthopaedic and neurosurgical units across England. Plots of frequency versus quarter-to-quarter change in waiting times revealed a power relation which seems independent of surgical specialty and hospital location. One interpretation of these findings is that, for the period in question, the NHS was a system at the edge of chaos. This hypothesis might explain why waiting times have resisted attempts at shortening.
INTRODUCTION
The British National Health Service (NHS) is a large and complex system with many interacting components—for example, patients, doctors and managers. The NHS provides efficient high-quality patient care despite the impression of chaos sometimes conveyed by long waiting lists, cancelled operations, staff shortages and the ever-increasing paper-work. An intriguing property of waiting lists is that they have resisted the changes introduced into the NHS over the past few years. The conventional explanation is that the changes are wrongly targeted or too small. In this paper we suggest a novel way of analysing the problem of long waiting lists, based on chaos and complexity theory. We chose to look at surgical waiting lists because waiting-time data are readily available from the Department of Health and because the length of surgical waiting lists is one of the most pressing issues for the NHS today.
First, we offer a brief account of chaos and complexity theory.
Chaos and complexity
For centuries, science has attempted to understand complex systems by formulating laws applicable to their component parts. This approach makes it difficult to explain how system properties emerge from component properties. For example, the laws of physics may perfectly predict how one gas particle interacts with another gas particle, but it is impossible to use these laws to forecast with perfect accuracy what the weather will be like tomorrow. Although the laws of interaction between all particles are known, the weather system is too complex because it has too many particles. Moreover, a small difference in initial variables leads to huge differences in outcomes. This is known as the butterfly effect, from the idea that a butterfly flapping its wings somewhere in America can influence the weather in the UK.
Chaos and complexity theory1 addresses complexity by looking for system properties applicable to all collections of parts, regardless of size or nature. This concept can be understood by considering the most extensively studied complex system, the ‘Game of Life’. This game is played on a computer by drawing a grid and colouring each pixel white (alive) or black (dead). The computer starts from an initial pattern of white and black pixels and moves from one step to the next according to the following simple rules: if a pixel has two or three live neighbouring pixels it goes on to the next stage as alive; if a pixel has fewer than two live neighbours it dies of loneliness; and if a pixel has more than three live neighbours it dies of overcrowding. After many steps, depending on the initial configuration of live and dead pixels, the ‘Game of Life’ has four possible outcomes—I, extinction (all pixels die); II, stability (a repetitive pattern of live and dead pixels is reached); III, chaos (the pattern of live and dead pixels changes continually); and IV, edge of chaos (order some of the time, chaos some of the time).
In contrast to Darwinian evolutionary theory, chaos and complexity theory suggests that class IV states are reached by self-organization, without external involvement and uninfluenced by the nature of the component parts1. A property that exhibits edge of chaos behaviour is therefore called an emergent property and edge of chaos is also known as self-organized criticality. All edge of chaos complex systems share the three properties—scale invariance (repeated patterns, or fractals, irrespective of scale); resistance to change (see Figure 1), and maximum efficiency (so that an increase of either order or chaos in the system will reduce the system's efficiency). Class IV complex systems can be identified because they obey power relations (a relation between two variables, x and y, such that y=xa). This means that a plot, on a log—log graph, of the magnitude of change in a system variable against how often the change occurs, gives a straight line. Mandelbrot used this to show that the month-to-month variations in the price of cotton wool obeyed a power relation. Other examples of class IV complex systems are earthquakes and traffic jams1.
Figure 1.

Resistance to change of a complex system at the edge of chaos demonstrated by a pile of sand. Adding more sand to the pile causes avalanches of different sizes, but the slope of the pile remains constant. Avalanche size obeys a power relation (Ref. 1)
MATERIALS AND METHODS
Outpatient waiting time is the interval between the date the general practitioner's referral letter was received by the hospital and the date the patient was first seen at the outpatient clinic. Inpatient waiting times begin from the date the clinician decided to admit the patient. They exclude emergencies, day cases and patients already in hospital.
Waiting times for 1998-2001, for over 10 000 outpatients and over 10 000 inpatients, were obtained from the Department of Health website [www.doh.gov.uk ]. The data correspond to five neurosurgical, five general surgical and five orthopaedic units (Hurstwood Park and Princess Royal Hospital in Mid-Sussex, Atkinson Morley's and St George's Hospitals in London, Addenbrooke's Hospital in Cambridge, Newcastle-upon-Tyne Hospitals, and University and Royal Orthopaedic Hospitals in Birmingham). For each hospital and specialty a table was constructed: columns (c) were waiting-time groups (<4, 4-13, 13-25 weeks for outpatients; <3, 3-5, 6-11 months for inpatients) and rows (r) were successive 3-month periods. Each entry nr'n represents the number of patients. For each table we calculated (r-1) c numbers n′ such that
 |
Log (frequency of occurrence) was then plotted against log (n′).
Linear regression analysis was performed and tightness of fit was expressed as the correlation coefficient (r) and Pearson's P value.
RESULTS
The logarithm of the frequency of variation of patient waiting times (y) is linearly related to the logarithm of the quarter-to-quarter per cent change in patient numbers (x) for all the surgical units studied. For outpatients the best-fit straight line is y=5.89-2.60x, n=34, r=-0.96, P < 10-17 (Figure 2a) and for inpatients y=5.28-2.44x, n=32, r=-0.95, P<10-16 (Figure 2b).
Figure 2.
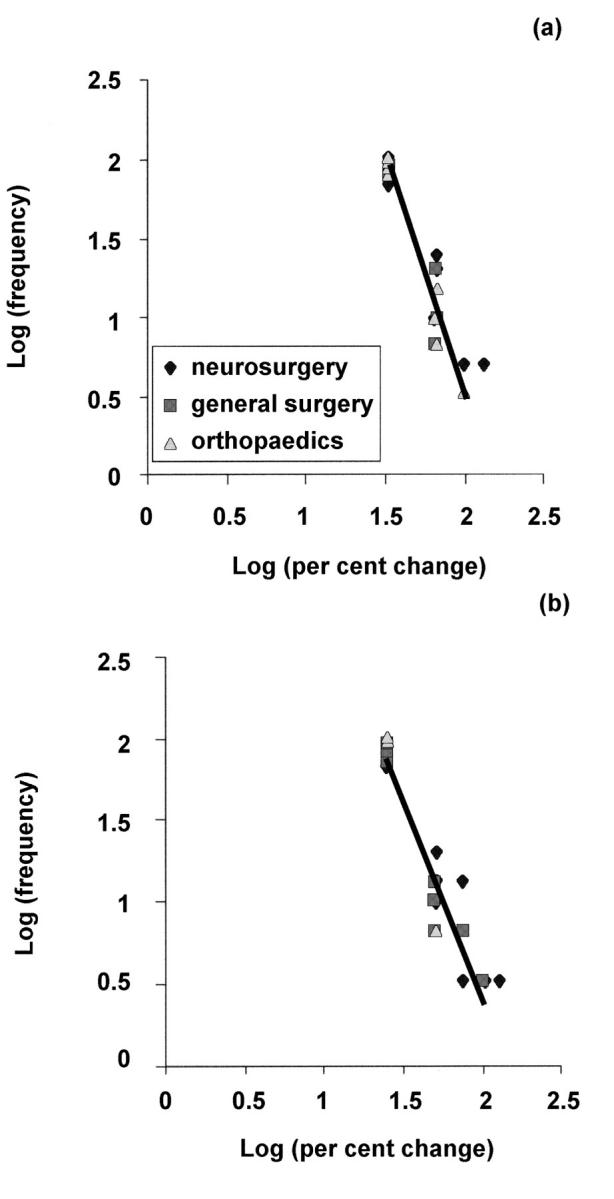
Plots of log (frequency) and log (per cent change) for (a) outpatient and (b) inpatient waiting lists. The best-fit straight line is also shown in each case. Note that many overlapping points appear as single points
DISCUSSION
Our analysis shows that variations in inpatient and outpatient surgical waiting times are not random but obey power relations independent of specialty and hospital location. Thus the lengths of waiting lists could be emergent (i.e. class IV) properties of the NHS independent of patients, doctors, nurses or managers. Surgical waiting lists may therefore obey the laws of the edge of chaos—i.e. scale invariance, resistance to change, and maximum efficiency.
Scale invariance means that the waiting lists of a surgical or medical unit that consists of many consultants obey the same power relation as the waiting lists of individual consultants. A recent paper2 supports this idea by showing that the waiting lists of individual dermatology consultants obey a power relation, similar to the one reported here.
Resistance to change can be illustrated as follows. Let us consider a surgical unit in which a certain number of consultants see a certain number of outpatients each week. If an extra consultant is added to the unit, to try to shorten the waiting lists, the general practitioners may lower their threshold for referring patients. The consultants may also respond by spending more time with each outpatient and seeing fewer patients in each outpatient clinic. As a result of these changes, the waiting lists will probably stay the same length.
The fact that waiting lists are at the edge of chaos may also explain the failure to shorten waiting lists despite the introduction of diverse government policies, such as internal market competition and more administrators. Measures proposed in The NHS Plan3—for example, banning new consultants from private practice for several years or reorganizing pay initiatives—are also unlikely to work. If these measures are introduced, the waiting lists will probably self-reorganize to remain the same length.
What of maximum efficiency? Self-organized criticality is a law of nature that enables complex systems to optimize their efficiency1, and our findings indicate that NHS surgical waiting lists are no exception. Chaos and complexity theory suggest that no matter how many managers are appointed they will be unable to enhance efficiency, and that increasing control and uniformity may shift the NHS from an efficient, self-organized critical system to a mediocre, highly ordered one.
To illustrate this point, consider a consultant surgeon who spends a certain number of hours a week reviewing patients and the rest attending meetings and doing paperwork. An increase in the number of hospital administrators will force the consultant to devote more time to meetings and paperwork. The surgeon will no doubt collect better morbidity and mortality data about his patients and perform more thorough audit. The extra time spent on administration will thus increase the order in the NHS, but efficiency (assessed as patient waiting times) will probably fall, because the consultant will have less time to spend with the patients.
What are the implications of these findings for the NHS? The idea that the service buffers intervention should be interpreted with caution for three reasons. First, our data are derived from the last 3 years only. Second, aspects of patient care other than waiting lists have not been considered. Third, the Scandinavian and French healthcare systems suggest that high-quality care with no waiting lists is achievable with their current level of health expenditure.
A recent newspaper article has argued that the limiting factor in the NHS is the shortage of staff, not the inadequate funding4. There are only 1.8 doctors per 1000 people in Britain, while the European average is 3.4. To tackle the shortage of doctors, the Government has planned a rise in the number of NHS consultants by 4% per year5. Traffic flows in motorways, a well-studied complex system at the edge of chaos1, may offer useful insight into the problem of staff shortages in the NHS. In the same way that lanes give cars access to the motorway, doctors provide patients access to NHS care. This analogy suggests that the planned rise in consultant numbers is too small and may even make the situation worse (Braess's paradox). Simply put, Braess's paradox suggests that increasing resources in one part of the system creates bottlenecks in other parts and thus reduces overall efficiency (see Figure 3). For example, if the number of NHS neurosurgeons suddenly doubles, more outpatients will be seen and more will be put on waiting lists for surgery. Without extra ward beds, operating theatres, imaging equipment, nurses, intensive care facilities, catering and so on the extra neurosurgeons will lengthen the inpatient waiting lists and jam the scanning services, probably making the waiting lists and scanning services less efficient. To avoid Braess's paradox, an increase across the whole spectrum of NHS resources, not just staff numbers, is therefore required. Because edge of chaos relies on logarithmic relations, we suggest that only a logarithmic increase (i.e. doubling, quadrupling, etc) in NHS resources stands a realistic chance of shortening the waiting lists.
Figure 3.

Analogy between the NHS and traffic jams. Cars travel from point A to point B via route F1 or F2. Bridges A and B are regions of congestion where the time taken to cross the bridge is directly proportional to the number of cars trying to cross the bridge. Opening an additional shorter route (F3) increases the average travel time from point A to point B (Braess's paradox), because the cars that choose route F3 contribute to congestion at both bridges A and B. The routes may be analogous to doctors, the cars to patients and the journey times to waiting times
References
- 1.Bak P. How Nature Works: The Science of Self-Organized Criticality. New York: Springer-Verlag, 1996
- 2.Smethurst DP, Williams HC. Are hospital waiting lists self-regulating? Nature 2001;410: 652-3 [DOI] [PubMed] [Google Scholar]
- 3.Department of Health. The NHS Plan: Proposal for a New Approach to the Consultant Contract. London: DoH, 2001
- 4.Kaletsky A, Marris R. Europe holds lessons for our schools and hospitals. Times, 22 May 2001, p. 20
- 5.Camm J. Consultant expansion to remain at just 4%. Hosp Doctor, 22 January 2001