

Abstract
We investigated the cellular mechanism underlying presynaptic regulation of olfactory receptor neuron (ORN) input to the mouse olfactory bulb using optical-imaging techniques that selectively report activity in the ORN pre-synaptic terminal. First, we loaded ORNs with calcium-sensitive dye and imaged stimulus-evoked calcium influx in a slice preparation. Single olfactory nerve shocks evoked rapid fluorescence increases that were largely blocked by the N-type calcium channel blocker ω-conotoxin GVIA. Paired shocks revealed a long-lasting suppression of calcium influx with ~40% suppression at 400-ms interstimulus intervals and a recovery time constant of ~450 ms. Blocking activation of postsynaptic olfactory bulb neurons with APV/CNQX reduced this suppression. The GABAB receptor agonist baclofen inhibited calcium influx, whereas GABAB antagonists reduced paired-pulse suppression without affecting the response to the conditioning pulse. We also imaged transmitter release directly using a mouse line that expresses synaptopHluorin selectively in ORNs. We found that the relationship between calcium influx and transmitter release was superlinear and that paired-pulse suppression of transmitter release was reduced, but not eliminated, by APV/CNQX and GABAB antagonists. These results demonstrate that primary olfactory input to the CNS can be presynaptically regulated by GABAergic interneurons and show that one major intracellular pathway for this regulation is via the suppression of calcium influx through N-type calcium channels in the pre-synaptic terminal. This mechanism is unique among primary sensory afferents.
INTRODUCTION
Olfactory receptor neurons (ORNs) transduce odorant-binding events into action potentials that are relayed to the brain. In rodents, several million ORNs project to the olfactory bulb where they terminate in discrete anatomical structures called glomeruli (Cajal 1911; Shepherd et al. 2004). All of the several thousand ORNs expressing the same odorant receptor converge onto the same few glomeruli in the bulb (Mombaerts et al. 1996; Ressler et al. 1994). Each ORN innervates a single glomerulus, making glutamatergic synapses onto the dendrites of mitral and tufted (M/T) cells, the principal output neurons of the bulb, and with juxtaglomerular interneurons, which are intrinsic to the glomerular layer and make synaptic connections both within and between glomeruli (Shepherd et al. 2004). Connections among ORNs, juxtaglomerular interneurons, and M/T cells mediate the first synaptic stage of olfactory processing. Understanding the synaptic organization of the olfactory glomerulus is thus important in understanding the initial stages of odor coding.
In addition to a complex network of postsynaptic connections, GABA- and dopaminergic juxtaglomerular interneurons can also presynaptically inhibit transmitter release from ORNs. In rodent olfactory bulb slices, a single olfactory nerve (ON) shock suppresses responses to subsequent ON shocks (Aroniadou-Anderjaska et al. 2000; Ennis et al. 2001; Murphy et al. 2004). This suppression is relieved by GABAB and D2 dopamine receptor blockade (Aroniadou-Anderjaska et al. 2000; Ennis et al. 2001), and GABAB and D2 receptors are expressed on ORN axon terminals (Bonino et al. 1999; Koster et al. 1999). In the turtle olfactory bulb, presynaptic GABAB and D2receptor activation suppresses calcium influx into ORN terminals (Wachowiak and Cohen 1999), suggesting that transmitters released by juxtaglomerular neurons activate presynaptic receptors that reduce calcium influx through voltage-sensitive calcium channels, leading to a reduction in transmitter release.
Here, we tested whether such a mechanism regulates primary olfactory input to the mammalian brain by imaging calcium influx into ORN presynaptic terminals in mouse olfactory bulb slice preparations. We focused on presynaptic inhibition mediated by GABAB receptors because of their extensive characterization as modulators in other brain regions (Chen and Regehr 2003; Dittman and Regehr 1997; Mitchell and Silver 2000; Pfrieger et al. 1994; Wu and Saggau 1995). We found that ON shock evoked GABAB receptor-mediated suppression of calcium influx into ORN presynaptic terminals by inhibiting N-type voltage-activated calcium channels. We also investigated the relationship between calcium influx and transmitter release by directly imaging release using synapto-pHluorin, an optical reporter of synaptic vesicle exocytosis (Bozza et al. 2004; Miesenbock et al. 1998). We found that the relationship between calcium influx and transmitter release is superlinear, such that a moderate change of presynaptic calcium influx strongly modulates the amount of neurotransmitter released from ORNs. This relationship was confirmed by recording monosynaptic ON-evoked EPSCs from external tufted cells. Thus primary sensory input to the mammalian olfactory system is regulated presynaptically by feedback inhibition, via a metabotropic receptor-mediated mechanism more common in higher levels of the CNS.
METHODS
Animals
Mice were used in all experiments. For Calcium Green-1 dextran and fluo-4 dextran imaging experiments, C57/Bl6 mice, 4 – 8 wk, were used. For synaptopHluorin (spH) and rhod dextran imaging, mice were 4 – 6 wk of age and were homozygous (n = 21) or heterozygous (n = 2) OMP-spH mice (Bozza et al. 2004). Heterozygous mice were F1 progeny of C57/Bl6 and OMP-spH strains. No obvious differences were apparent in ON-evoked spH signals from homozygous versus heterozygous mice, nor have differences in odorant-evoked spH signals been observed (Bozza et al. 2004). OMP-spH mice are of a mixed (129 × C57/Bl6) background and are available from The Jackson Laboratory (Bar Harbor, Maine), stock No. 4946. All procedures were approved by the University of Maryland and Boston University Animal Care Committees.
Dye loading
For the presynaptic calcium imaging experiments, ORNs were loaded in vivo by intranasal infusion of a 4% dye solution as described in detail elsewhere (Wachowiak and Cohen 2001, 2003). After the loading procedure, mice recovered from anesthesia and were held for 3– 8 days before preparation of slices for imaging. One of the following four dextran-conjugated calcium-sensitive dyes were used, all from Molecular Probes (Eugene, OR): Calcium Green-1 dextran (10 kDa, No. C3717), fluo-4 dextran (10 kDa, low-affinity version, No. F14240), “high-affinity” rhod dextran (10 kDa, No. R34676), or “low-affinity” rhod dextran (10 kDa, No. R34677).
Slice preparations
Experiments were performed in 350- to 400-μm thick horizontal or sagittal slices of the main olfactory bulb, prepared as described in Heyward et al. (2001). Slices were cut in ice-cold artificial cerebrospinal fluid (ACSF), then held at 35°C for 30 – 60 min before being maintained at 30°C. All recordings were performed at 30°C. Some experiments used “surface” slices from the dorsal or lateral surface of the bulb to maintain synaptic connections between and within all glomeruli (Aungst et al. 2003). We found that these surface slices were more resistant to rundown from photodynamic damage. ON shocks were delivered with a twisted stainless-steel bipolar electrode (70 μm diam), insulated except at the tips, or with a concentric bipolar electrode (~25 μm tip diam) from FHC (Bowdoinham, ME). Constant-current stimuli, 50 –500 μA, 0.1-ms duration, were generated using a stimulus isolator.
Optical and electrophysiological recordings
Optical signals were recorded using fluorescence epi-illumination on a standard upright, fixed-stage compound microscope (Olympus BX-51WI). The slice was illuminated using a 150-W Xenon arc lamp (Opti-Quip) and one of the following filter sets: Calcium Green-1 dextran and fluo-4 dextran, exciter: 500/25 nm, dichroic: 525LP, emitter: 530LP. For synaptopHluorin, exciter: 480/40 nm, dichroic: 505LP, emitter: 535/50 nm. For rhod dextran, exciter: 540/25 nm, dichroic: 555LP, emitter: 620/60 nm. Depending on the desired magnification, one of the following water-immersion objectives was used: ×40 (0.8 N.A.), ×20 (0.95 N.A), ×10 (0.3. N.A), all from Olympus. To minimize photobleaching, lamp output was attenuated using neutral density filters such that the photon flux reaching the CCD camera was ~50,000 photons/ms/pixel. Fluorescence changes were recorded using a cooled, back-illuminated CCD camera (NeuroCCD, RedShirtImaging, Fairfield, CT) at 80 × 80 pixel resolution. For some experiments, the camera was kindly provided by Dr. L. B. Cohen (Yale University). Optical signals were acquired at frame rates of 125–1,000 Hz, digitized at 14-bit resolution and saved directly to disk. Data acquisition, shutter control, and stimulus triggering were performed using Neuroplex software (RedShirtImaging, Fair-field, CT).
Whole cell voltage-clamp recordings from external tufted cells were performed in preparations separate from the optical recordings following protocols described previously (Hayar et al. 2004). Electrode tip diameter was 2–3 μm, and tip resistance was 5– 8 MΩ. Seal resistance was >1 GΩ. Data were recorded using a Multiclamp 700A patch-clamp amplifier (Axon Instruments, Foster City, CA) and digitized and stored on disk under the control of pClamp software (Axon Instruments). All recordings were made from a holding potential of −65 mV.
In experiments measuring the relationship between extracellular calcium concentration and transmitter release, the concentration of CaCl2 in the artificial cerebrospinal fluid (ACSF) was changed from its control value of 2.0 mM to 0.25, 0.5, 1.0, or 4.0 mM. At CaCl2 concentrations <2.0 mM, control CaCl2 was replaced by an equimolar concentration of MgCl2. All experiments were performed at 30°C and using a chamber perfusion flow rate of 2–3 ml/min. For experiments in which excitatory postsynaptic currents (EPSCs) were recorded, each experiment began with control ACSF (2 mM Ca2+); after establishing stable control responses, the slice was superfused with ACSF contained 0 mM Ca2+ until the ON-evoked response disappeared (~10 min). The perfusion was then switched to ACSF containing different external calcium concentrations [Ca2+]ext. After each change of [Ca2+]ext, the chamber was allowed to equilibrate for 7 min; then a series ON-evoked EPSC recordings were repeated at intervals of ~3 min to confirm that the responses were stable in the test solution. At least six trials were averaged at each [Ca2+]ext. For experiments in which spH signals were recorded, to minimize rundown due to bleaching and photodynamic damage, 0 mM Ca2+ was not introduced to minimize the number of trials taken and shorten the experimental protocol. Instead, different [Ca2+]ext were introduced immediately after recording responses in control (2 mM) Ca2+. ON-evoked spH signals were then recorded after 10 –15 min of perfusion time. Four to eight trials were taken at each concentration and checked for consistency across trials before averaging to obtain a response amplitude measurement. In most slices, several different concentrations were tested in series, and the order in which they were tested was varied across experiments.
Drugs and solutions
For Calcium Green-1 dextran imaging, the ACSF consisted of, in mM, 120 NaCl, 3 KCl, 1.3 CaCl2, 1.3 MgSO4, 10 glucose, 25 NaHCO3, and 5 BES (Heyward et al. 2001). For all other experiments (rhod dextran and spH imaging and EPSC recordings), the ACSF consisted of 124 NaCl, 3 KCl, 2CaCl2, 1.3 MgSO4, 10 glucose, 26 NaHCO3, and 1.25 NaH2PO4 (Chen and Shepherd 1997). Several Calcium Green-1 dextran experiments performed using the latter ACSF produced similar results as with the first but were not included in the summary statistics. Pipette solution used for the voltage-clamp recordings consisted of (in mM) 125 K gluconate, 2 MgCl2, 10 HEPES, 2 Mg2ATP, 0.2 Na3GTP, 1 NaCl, and 0.2 EGTA. All pharmacological probes were dissolved from stock solutions in ACSF and applied by perfusion through the recording chamber. In all experiments, drugs were perfused until a steady-state effect was reached (similar response amplitudes over 3 successive trials). For the conotoxin experiments, 10 –20 min of perfusion was required to reach steady state. CGP55845, CGP54626, 6-cyano-7-nitroquinoxaline (CNQX), 1,2,3,4-tetrahydro-6-nitro-2,3-dioxo-benzo[f]quinoxaline-7-sulfonamide disodium salt (NBQX), d,l-2-amino-5-phosophonopentanoic acid (APV), and (±) baclofen were from were from Sigma/RBI (St. Louis, MO) or from Tocris (Ellisville, MO). ω-conotoxin GVIA and MVIIA were from Alomone Labs (Jerusalem, Israel) or from Tocris.
Data analysis
To measure ON-evoked response amplitudes, optical signals were averaged from pixels overlying a responding glomerulus. In some cases, two to eight trials, delivered at an inter-trial interval of 30 – 60 s, were averaged to improve the signal-to-noise ratio. For the Calcium Green-1 dextran measurements, signals were digitally filtered from ~0.5–50 Hz using a low-pass Gaussian and high-pass RC filter (both filters have a low sharpness). Rhod dextran signals were filtered from ~0.5–25 Hz, and spH signals were only low-pass filtered at 15 Hz. In preparations showing significant photobleaching (including all spH recordings), photobleaching of the baseline fluorescence was corrected by subtracting low-pass filtered, no-stimulus trials or by scaling and subtracting signals from nonresponding glomeruli in the same slice. To measure test pulse responses in the paired-pulse experiments, ongoing decay of the signal evoked by the conditioning pulse was corrected in one of two ways. In calcium dye experiments with ISIs ≥200 ms, the high-pass filter was sufficient to produce a stable baseline before the test pulse was delivered. In experiments with shorter ISIs and in the spH experiments, trials consisting of only a conditioning pulse were subtracted. After averaging, bleach- and blank-subtraction and temporal filtering, response amplitudes were measured by subtracting the average fluorescence during a 10- to 40-ms time window just preceding stimulus onset from that of an equivalent time window beginning at the peak of the response. Fractional fluorescence changes were calculated by dividing response amplitude by the resting fluorescence averaged over five frames of the prestimulus period. Because intrinsic fluorescence from the preparation was negligible (typically <10% of fluorescence in labeled glomeruli), no attempt was made to correct for it. We sometimes observed rundown of response amplitudes during the course of an experiment (see results), but we did not attempt to correct for this rundown. Instead, a minority of experiments in which rundown exceeded 25% in the four to five trials preceding a drug application were discarded from the dataset. Glomeruli showing >10% variability in response amplitude over three repeated trials were also discarded.
Data from the Ca2+ concentration experiments (spH and EPSC measurements) were first normalized to the response to control (2 mM) Ca2+ and then averaged across preparations. The averaged response values were then fit to a Hill function of the form
where R is the normalized response amplitude, [Ca2+] is the Ca2+ concentration (in mM), k1/2 is the Ca2+ concentration corresponding to half-maximal R, n is the cooperativity coefficient, and Vmax is the maximal response amplitude. Vmax, n, and k1/2 were all free parameters in performing the fits. Fitting was performed using Origin (Microcal Software, Northhampton, MA).
Additional data analysis was performed using Neuroplex and custom software written in Matlab (Mathworks, Natick, MA) and Lab-View (National Instruments, Austin, TX).
RESULTS
Imaging presynaptic calcium signals in vitro
Loading mouse ORNs with Calcium Green-1 dextran (CGD) in vivo (Wachowiak and Cohen 2001) labeled many glomeruli in the olfactory bulb. In transverse olfactory bulb slices, individual glomeruli and a well-labeled olfactory nerve layer were easily resolved; no fluorescence was observed in infraglomerular layers (Fig. 1A, left). Discrete glomeruli, along with bundles of innervating axons, were also easily resolved in slices cut parallel to the dorsal or lateral surfaces (surface slices) of the olfactory bulb (Fig. 1A, right), which leaves the olfactory nerve layer and glomerular layer intact (Aungst et al. 2003).
FIG. 1.

Imaging presynaptic calcium influx in olfactory receptor neuron (ORN) axon terminals in vitro. A: confocal images showing labeling of olfactory bulb glomeruli after loading ORNs with dextran-conjugated dyes. Left: transverse olfactory bulb slice showing ORNs loaded with Calcium Green-1 dextran. ORN axons terminate in discrete glomeruli. Arrowheads mark incoming axon bundles. There is no fluorescence in infraglomerular layers. Right: surface slice showing ORNs loaded with AlexaFluor-488 dextran (10 kDa). Many axon bundles can be seen innervating discrete glomeruli. No fluorescence is apparent between glomeruli, indicating that no dye is present in periglomerular interneurons. B: trace showing time course of olfactory nerve (ON)-evoked change in Calcium Green-1 dextran (CGD) fluorescence measured from a single glomerulus in a transverse slice. Trace is a single trial with no temporal filtering. A no-stimulus trial was subtracted to remove drift due to photobleaching. C: effect of ω-conotoxin GVIA (500 nM) on ON-evoked calcium influx (different preparation than in B). Each trace is the average of 4 trials and is high-pass filtered at 0.35 Hz. Gray trace shows the response in ω-conotoxin scaled to the same amplitude as the control response. D: effect of increasing stimulus intensity on ON-evoked responses. Left: superimposed traces showing responses to ON shocks of intensities ranging from 300–800 μA (the maximal intensity used in all data analyses was 500 μA). Right: same data as at left, but with traces scaled to the same peak response amplitude (the response to 300 μA is omitted). The rise time and decay kinetics of the calcium signal are the same at all stimulus intensities. Traces are not temporally filtered. EPL, external plexiform layer; GL, glomerular layer.
Single shocks to the olfactory nerve (ON) layer, or to ORN axon bundles in surface slices, evoked CGD fluorescence signals in one to several glomeruli. Fluorescence increases in different glomeruli ranged in amplitude from 0.5 to 6% ΔF/F but were typically 1–2% ΔF/F. These amplitudes are similar to those evoked by odorant stimulation in vivo (Wachowiak and Cohen 2001). Their relatively small size presumably reflects the fact that not all ORN axons are activated by ON shock and the fact that calcium influx is restricted to only a small portion of axon within the glomerulus (Wachowiak et al. 2004). ON-evoked signals were localized to individual glomeruli, with small-amplitude signals (<30% of glomerular signal amplitude) sometimes seen in the olfactory nerve layer or in innervating axon bundles. In transverse slices, ON-evoked CGD signals were typically seen in one to four glomeruli near the stimulating electrode. In surface slices, ON shocks could evoke signals in glomeruli up to ~1 mm distant from the electrode; increasing stimulus intensities recruited activation of additional glomeruli. In most preparations, evoked responses were stable, showing rundown of <10% after 10 –20 trials delivered over a period of 10 –30 min. Some glomeruli showed a gradual rundown of 10 –20% over this many trials. This was likely due to photodynamic damage because rundown was not observed when the preparation was not illuminated for long (10 –20 min) intervals.
ON-evoked CGD signals were rapid in onset and decayed slowly (Fig. 1B). The time to peak of CGD signals evoked by a single 0.1-ms nerve shock was 7.1 ± 0.4 (SE) ms (n = 9 glomeruli sampled at 1-kHz frame rate). The decay of the signal during the first 500 ms of the response was well fit by a single exponential with time constant 241 ± 8 ms (n = 8 glomeruli sampled at 100 Hz). CGD signal amplitude was graded with stimulus intensity (Fig. 1D), with threshold intensities typically at 50 –100 μA. Neither the rise time nor the decay kinetics of the calcium signal changed significantly with stimulus intensity (Fig. 1D), consistent with the assumption that increasing stimulus intensity activates increasing numbers of ORN fibers.
ω-conotoxin GVIA (500 nM), a blocker of N-type voltage-activated calcium channels, reduced the amplitude of the ON-evoked CGD signal to 30 ± 1% of predrug values (n = 23 glomeruli in 9 slices; Fig. 1C). ω-conotoxin MVIIA (1–2 μM), another N-type calcium channel blocker, had a similar effect on CGD signals (mean response amplitude, 31.5% of predrug values, n = 2 glomeruli in 2 preparations). There was no difference in the decay time constants of the calcium signal remaining after ω-conotoxin GVIA treatment (P = 0.2, paired t-test, n = 13; Fig. 1C). These results indicate that the majority of the CGD signal reflects calcium influx through N-type, voltage-activated calcium channels. The residual CGD signal seen in the presence of ω-CTX may reflect calcium influx through other channel types or release of calcium from intracellular stores.
Paired-pulse suppression of presynaptic calcium influx
After a conditioning ON stimulus, CGD signals evoked by a subsequent (test) ON shock were depressed. Figure 2A shows CGD signals evoked by paired ON shocks delivered at a 400-ms interstimulus interval (ISI). In this example, the response evoked by the test stimulus is ~70% of that evoked by the first conditioning stimulus. Because some paired-pulse depression (PPD) of the CGD signal may be expected due to saturation of the high-affinity CGD molecule (kDa ~ 540 nM) (Kreitzer et al. 2000), we also measured ON-evoked signals after loading ORNs with lower-affinity calcium indicators. We tested three additional indicators: fluo-4 dextran (kDa ~ 3.1 μM) (Kreitzer et al. 2000), “high-affinity” rhod dextran (kDa ~ 1.4 μM) (Beierlien et al. 2004), and “low-affinity” rhod dextran (kDa ~ 3.9 μM) (Beierlien et al. 2004) and measured similar levels of PPD. At a 400-ms ISI, the paired-pulse ratio of test to conditioning response amplitude was 0.68 ± 0.02 (n = 37) for CGD, 0.64 ± 0.03 (n = 3) for fluo-4 dextran, 0.57 ± 0.02 (n = 26) for high-affinity rhod dextran, and 0.65 ± 0.02 (n = 6) for low-affinity rhod dextran. Thus the observed PPD was not primarily due to the affinity of the dye but rather to synaptic mechanisms.
FIG. 2.

Delayed and long-lasting paired-pulse suppression of presynaptic calcium influx. A: Calcium Green-1 dextran signal evoked by twin ON shocks delivered at a 500-ms interstimulus interval (ISI). The response to the 2nd (test) pulse is depressed relative to the 1st (conditioning) pulse. Trace is low-pass filtered at 50 Hz with no high-pass filter. B: superimposed responses to paired ON shocks delivered at ISIs ranging from 200 to 1,200 ms. Traces are low-pass filtered at 15 Hz and high-pass filtered at 1 Hz to facilitate comparison of test responses. Undershoot of the traces after the conditioning pulse is due to the high-pass filter. C: plot of paired-pulse ratio (test : conditioning response) as a function of ISI. Longer ISIs (solid circles) were imaged using CGD. Shorter ISIs (open circles) were imaged using low-affinity rhod dextran. Error bars indicate SE. Gray curve shows an exponential decay fit to the data at ISIs of ≥200 ms. The time constant of recovery from depression is 487 ± 80 ms. Numbers of glomeruli for each interval are indicated near the bottom of the graph. Data from shorter intervals are shown expanded in Fig. 3C. D: relationship among stimulus intensity, paired-pulse ratio (left axis, solid squares), and conditioning response amplitude (right axis, open circles) measured with CGD from 1 glomerulus. Increasing stimulus intensity causes an increase in conditioning response amplitude and a smaller decrease in paired-pulse ratio, reflecting increased depression. E: plot of paired-pulse ratio vs. conditioning response amplitude (28 measurements from 7 glomeruli). For each glomerulus, paired-pulse ratio and response amplitude were normalized to their values at the highest stimulus intensity tested (which evoked the largest conditioning response). The line shows a linear fit to these data, with slope −0.44 (R = −0.78; P < 0.001).
We investigated the time course of paired-pulse suppression using ISIs ranging from 10 to 2,200 ms and stimulus intensities of 200 – 400 μA. CGD was used to measure presynaptic calcium influx at longer ISIs (200 –2,200 ms; Fig. 2B), whereas low-affinity rhod dextran (in separate experiments) was used for shorter ISIs (10 – 400 ms; Fig. 2C). The decay time constant of the low-affinity rhod dextran signal was 78 ± 5 ms (n = 10 glomeruli from 5 slices). With both dyes, we ensured that responses were not saturated by delivering a train of three to five pulses at 20 –50 Hz and confirming that the train evoked a calcium signal ≥50% higher than that evoked by a single conditioning pulse (not shown). For the short ISI rhod dextran recordings, pairs of pulses delivered at 100 Hz evoked responses that were 85–90% higher than that of the conditioning pulse response. We also confirmed that higher stimulus intensities evoked larger-amplitude conditioning responses. The paired-pulse experiments revealed that PPD of ORNs has a slow onset and a long duration. Depression decreased at ISIs <100 ms, reached a maximum between 100 and 200 ms (paired-pulse ratio of ~0.6), and then slowly decayed (Fig. 2D). The time constant of recovery of the paired-pulse ratio at ISIs of ≥200 ms was 461 ± 108 ms with full recovery taking between 1 and 1.5 s (Fig. 2D). These findings indicate that a single stimulus to ORN axons elicits a long-lasting reduction of the presynaptic calcium influx evoked by subsequent activity in those axons. The slow onset of this depression is consistent with the idea that the depression is mediated by second-messenger pathways in the ORN presynaptic terminal.
Increasing ON input to a glomerulus by increasing stimulus intensity caused an increase in PPD (Fig. 2D). We quantified the relationship between magnitude of ON input and PPD by correlating conditioning response amplitude with paired-pulse ratio, using data in which three or more stimulus intensities were tested at ISIs of 400 –500 ms (n = 7 glomeruli, 6 slices; Fig. 2E). For each intensity series, conditioning response amplitudes (measured with CGD) were normalized to their maximum (the amplitude at maximal stimulus intensity), and paired-pulse ratio was normalized to that measured at maximal intensity. The paired-pulse ratio showed a highly significant inverse correlation with conditioning response amplitude (R = −0.78, P < 0.0001, n = 28), indicating that increasing the magnitude of ON input (presumably by activating more ON axons) caused a greater depression of presynaptic calcium influx. Submaximal stimulus intensities (determined in each glomerulus) were used in the remainder of the experiments described in this study.
It has been hypothesized that glutamate released by ON stimulation evokes release of GABA and dopamine from periglomerular interneurons, which feed back via GABAB and D2 receptors on ORN terminals to cause PPD (Aroniadou-Anderjaska et al. 2000; Ennis et al. 2001; Hsia et al. 1999). To test this hypothesis, we blocked ionotropic glutamate receptors with APV (100 μM) and CNQX (20 μM) to prevent activation of postsynaptic neurons. As predicted, APV/CNQX reduced PPD (Fig. 3A), causing an increase in the paired-pulse ratio at 400-ms ISI (measured with CGD) from 0.62 ± 0.04 to 0.76 ± 0.03 (paired t-test, P < 0.001; n = 13 glomeruli, 7 preparations). This effect reversed quickly on washout of APV/CNQX (paired-pulse ratio = 0.63 ± 0.06; n = 7 glomeruli, 4 preparations). The increased paired-pulse ratio was due entirely to an increase in test response amplitude (Fig. 3, A and B); the slight decrease in conditioning response amplitude (7 ± 4%; n = 13) was not statistically significant (P = 0.06, 1-group, 2-tailed t-test) and is likely due to slight rundown of the evoked optical signal, which we did not attempt to correct for in our data analyses (see methods). We also tested the effects of APV/CNQX at ISIs ranging from 10 to 400 ms using low-affinity rhod dextran (Fig. 3C). The paired-pulse ratio was similar (~0.8) in the presence of APV/CNQX at all ISIs. These results suggest that the interval-dependent component of PPD of presynaptic calcium influx for intervals ≥100 ms can be attributed primarily, if not entirely, to feedback inhibition from postsynaptic olfactory bulb neurons. The remaining suppression observed in the presence of APV/CNQX may reflect a component of calcium channel suppression mediated by pathways intrinsic to the presynaptic terminal, such as calcium channel inactivation. Slight dye saturation is an unlikely explanation for the residual suppression given that it was constant at ISIs ≤400 ms (Fig. 3C).
FIG. 3.
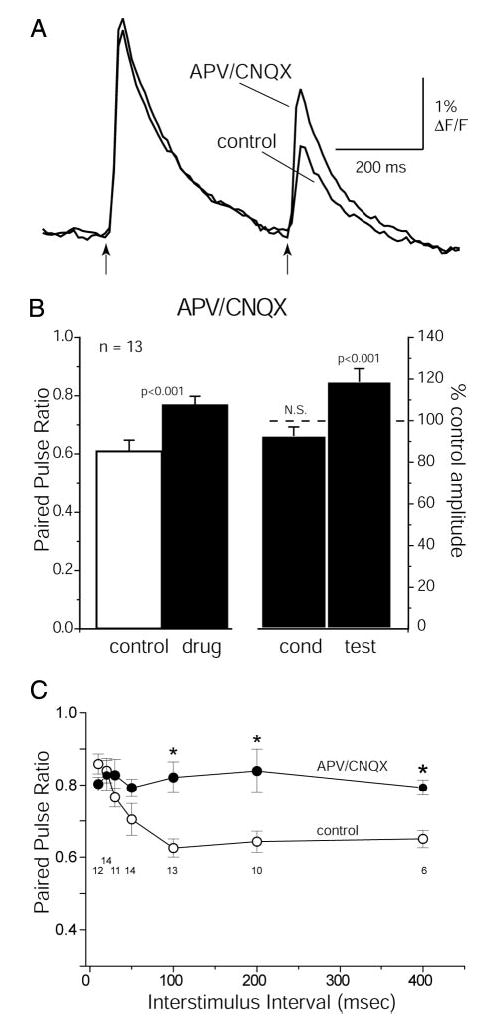
Blocking postsynaptic activity with APV/CNQX reduces paired-pulse depression. A: CGD signals evoked by paired ON shocks (400-ms ISI) before and during application of APV/CNQX (100 μM/20 μM). Traces are filtered from 0.8 to 25 Hz. APV/CNQX strongly reduces paired-pulse depression. B: summary data showing effect of APV/CNQX on paired-pulse ratio (PPR) of the CGD signal and on conditioning and test response amplitudes. Left bars show PPR measured before and during drug application. Right bars show conditioning and test responses relative to their amplitudes before drug application (- - -). Paired pulses were delivered at 400- to 500-ms ISIs. There was a significant increase in the PPR and test response, with no change in the conditioning response. C: effect of APV/CNQX is independent of ISI. ○, PPR as a function of ISI at short intervals measured with low-affinity rhod dextran (same data as in Fig. 2C); •, PPR in the presence of APV/CNQX. *, significant differences between drug and control recordings (P < 0.05; 2-tailed, unpaired t-test). Numbers indicate number of glomeruli tested in control conditions for each interval.
GABAB inhibition of presynaptic calcium influx
GABAB receptors may regulate ORN input to olfactory bulb glomeruli (Aroniadou-Anderjaska et al. 2000; Wachowiak and Cohen 1999). Thus we next tested whether GABAB receptors mediate the suppression of calcium influx into mouse ORN presynaptic terminals. Similar effects were observed using either Calcium Green-1 or rhod dextrans; summary data are presented using only one or the other dye. The GABAB receptor agonist, baclofen, strongly suppressed the ON-evoked calcium signal (Fig. 4A). Baclofen (2 μM) reduced the presynaptic calcium signal evoked by a single ON shock to 54 ± 4% of predrug values (P < 0.001; 1-group, 2-tailed t-test; n = 11 glomeruli, 4 slices; high-affinity rhod dextran). With paired-pulse stimulation, baclofen reduced the conditioning response (as expected from the preceding experiment) but had a smaller effect on the test response such that PPD was reduced (paired-pulse ratio = 0.84 ± 0.02; n = 11; P < 0.001, paired t-test; Fig. 4B). Thus GABAB receptor activation by an agonist decreased PPD through a decrease in the conditioning response.
FIG. 4.
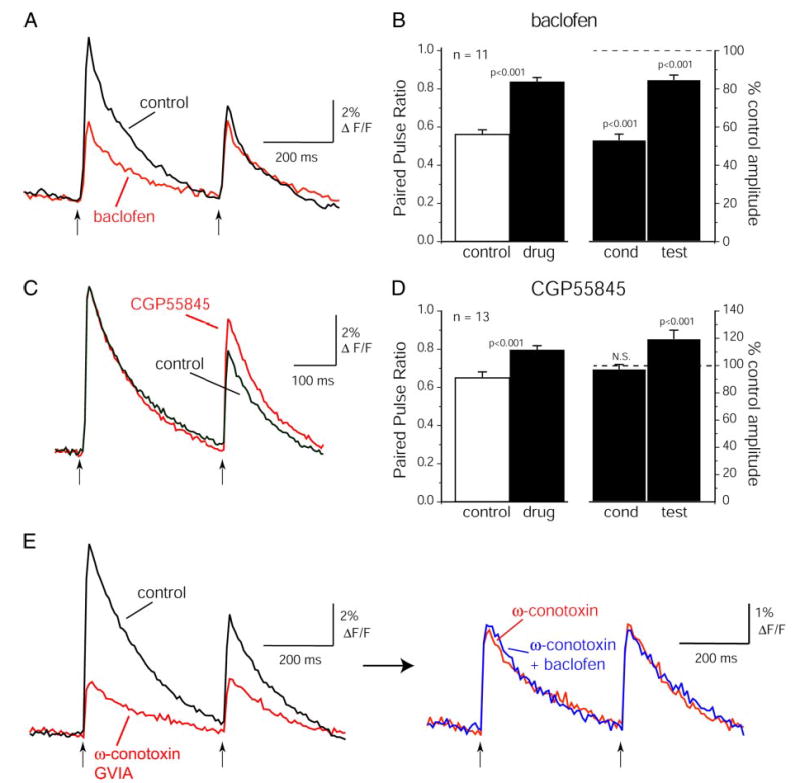
GABAB receptors mediate paired-pulse depression of presynaptic calcium influx. A: suppression of the presynaptic rhod dextran (high-affinity) signal after application of the GABAB agonist baclofen (2 μM). Baclofen suppresses the response to both conditioning and test shocks. Traces are filtered from 0.4 to 25 Hz. B: summary data showing effect of baclofen (2 μM) on PPR of the calcium signal and on conditioning and test responses, as in Fig. 3B. Baclofen more strongly suppresses the conditioning response (right bars), causing a significant increase in the PPR (left bars). C: CGD signals evoked by paired nerve shocks (400-ms ISI) before and during application of the GABAB antagonist CGP55845 (100 μM). Traces are high-pass filtered at 0.7 Hz with no low-pass filtering. D: summary data showing effect of CGP55845 (50–100 μM) on PPR and response amplitudes as in B. Data include ISIs from 200 to 500 ms. CGP55845 reduces paired-pulse depression by causing an increase in the test response. The conditioning response is unaffected. E: lack of effect of baclofen after blockade of N-type calcium channels with ω-conotoxin GVIA. Left: traces showing CGD signal before and after application of 500 nM ω-conotoxin GVIA. ω-conotoxin reduces the CGD signal and eliminates paired-pulse depression. Right: after ω-conotoxin application, 50 μM baclofen was applied with no additional effect. ω-conotoxin trace on left and right is the same data with different vertical scaling. Control and ω-conotoxin traces are the same trials as in Fig. 1C.
GABAB receptor antagonists reduced PPD through an increase in the test response (Fig. 4C). In the presence of the GABAB antagonist CGP55845 (50 –100 μM—no difference was observed between these 2 concentrations), the paired-pulse ratio increased from 0.65 ± 0.03 to 0.79 ± 0.02 (P < 0.001; paired t-test; n = 13 glomeruli, 7 slices; CGD; ISIs ranging from 200 to 500 ms) with no change (−3 ± 2.4%; n = 13; P = 0.3; 1-group, 2-tailed t-test) in the conditioning response (Fig. 4D). This effect is nearly identical in magnitude to the effect of APV/CNQX application. As with the APV/CNQX experiments, the residual PPD remaining after CGP55845 application was similar at the different ISIs tested [PPD = 0.79 ± 0.01 (n = 4); 0.81 ± 0.04 (n = 5); 0.74 ± 0.05 (n = 3) for 200, 400, and 500 ms ISIs, respectively]. A different GABAB receptor antagonist, CGP54626 (50 μM) had a similar effect (paired-pulse ratio = 0.77 ± 0.04; n = 4; CGD). Together, these results indicate that the paired-pulse suppression seen in control conditions is mediated, at least in part, by activation of GABAB receptors on the ORN presynaptic terminal.
We next tested whether GABAB receptors act on non-N-type voltage-sensitive calcium channels by first blocking N-type channels with 500 nM ω-CTX GVIA and then applying 50 μm baclofen (Fig. 4E). Baclofen had no effect on the CGD signal remaining after ω-CTX GVIA application (conditioning response in baclofen, 102 ± 2% of that in ω-CTX GVIA, n = 17 glomeruli, 5 slices; CGD). ω-CTX GVIA also eliminated PPD (paired-pulse ratio = 0.96 ± 0.02, n = 23 glomeruli in 9 slices; Fig. 4E). This result indicates that the effect of baclofen on presynaptic calcium influx is specific to N-type voltage-activated calcium channels.
Presynaptic calcium influx and transmitter release from ORNs
To further explore the extent to which suppression of pre-synaptic calcium influx modulates input from ORNs to second-order neurons, we monitored transmitter release from ORNs using synaptopttluorin (spH), a genetically encoded optical reporter of presynaptic vesicle fusion (Miesenbock et al. 1998). We recorded optical signals from olfactory bulb slices of mice expressing spH selectively in all olfactory marker protein-positive ORNs (OMP-spH mice) (Bozza et al. 2004). In a recent study, we have demonstrated the utility of these mice for reporting odorant-evoked ORN input to glomeruli in vivo (Bozza et al. 2004). Olfactory bulb slices showed significant resting fluorescence in glomeruli from ORN axon terminals (Fig. 5A). This resting fluorescence presumably reflects spH protein in the plasma membrane, as spH localized to the synaptic vesicle is essentially nonfluorescent (Sankaranarayanan et al. 2000). In some preparations, we loaded ORNs in OMP-spH mice with rhod dextran (high-affinity) to allow simultaneous measurements of drug effects on presynaptic calcium influx and transmitter release in the same glomerulus.
FIG. 5.

Imaging transmitter release from ORNs in vitro using synaptopHluorin. A: confocal image of the olfactory bulb surface of a OMP-synaptopHluorin (spH) mouse, showing spH expressed in the presynaptic terminals of ORN axons. Little or no fluorescence is apparent in incoming axon bundles (contrast with Fig. 1A). B: traces showing high-affinity rhod dextran signals reflecting presynaptic calcium influx (rhod) and spH signals reflecting transmitter release (spH) acquired in alternate trials from the same glomerulus. Both traces are single trials. The spH signal is low-pass filtered at 15 Hz, and the rhod signal is low-pass filtered at 50 Hz. The rise time of the rhod signal is faster than that of spH but the onset times are similar. C: superimposed traces showing spH signals evoked by increasing ON stimulus intensities. SpH signal amplitude is graded with stimulus intensity, with little change in rise time. Traces are low-pass filtered at 15 Hz.
Figure 5B shows ON-evoked rhod dextran and spH signals measured from the same glomerulus. The spH signal has a slower rise time than the rhod dextran signal. The time-to-half-maximal signal amplitude of the spH signal was 35.3 ± 2.8 ms (n = 12 glomeruli, 6 slices). The spH signal also showed a much slower decay than the presynaptic calcium signal; this presumably reflects the relatively slow process of vesicle endocytosis (Gandhi and Stevens 2003; Sankaranarayanan et al. 2000). In response to odorant stimulation, recovery of the spH signal can take up to 30 s (Bozza et al. 2004); we therefore did not attempt to measure the decay rate of the spH signal in the present experiments. Single ON shocks evoked spH fluorescence increases of 0.3–2% ΔF/F. As with the presynaptic calcium signals, the magnitude of the spH signal was graded with stimulus intensity (Fig. 5C), likely reflecting the activation of additional ORN terminals at higher intensities. The amplitude of the spH signal was somewhat lower than that observed in response to odorant stimulation in vivo (Bozza et al. 2004), possibly because odorant stimulation activates more ORNs and/or elicits a longer train of action potentials in each ORN. Brief high-frequency trains of ON nerve shocks (50 –100 Hz, 50- to 200-ms duration) in slices evoked larger fluorescence increases of 3–7% ΔF/F, comparable to those seen in vivo (not shown).
We measured the relationship between transmitter release (as measured with spH) and presynaptic calcium influx by imaging responses to a single ON shock in different concentrations of external calcium ([Ca2+]ext). We correlated spH signals with [Ca2+]ext rather than with the optically measured presynaptic calcium signal because calcium dye saturation can result in an underestimation of calcium influx, especially at elevated [Ca2+]ext (Kreitzer et al. 2000), and because, in preliminary experiments, we occasionally observed evidence for dye saturation at high [Ca2+]ext, even with the low-affinity dextran (data not shown). spH signals were measured at [Ca2+]ext ranging from 0.25 to 4 mM (Fig. 6A; n = 14 glomeruli from 5 slices; see methods). The relationship between spH response amplitude and [Ca2+]ext was well-fit by a Hill function with a cooperativity coefficient of n = 2.07 ± 0.14 and k1/2 of 1.11 ± 0.05. These values are similar to those reported for the ORN-JG neuron synapse using EPSC and fast excitatory postsynaptic potential recordings in the rat olfactory bulb (Murphy et al. 2004). We independently verified this relationship by recording ON-evoked monosynaptic EPSCs from external tufted cells (n = 10) under different [Ca2+]ext in separate preparations (Fig. 6B; see methods). ET cells, which are readily identified by their spontaneous rhythmic bursting in current clamp, are known to receive monosynaptic input from ORNs (Hayar et al. 2004); EPSCs here were confirmed to be monosynaptic based on their short and relatively invariant latency (Fig. 6B; mean latency across cells, 2.62 ± 0.14 ms; 0.11-ms jitter across trials). These experiments yielded a relationship between [Ca2+]ext and EPSC amplitude that was nearly identical to that obtained with spH (n = 2.00 ± 0.16; k1/2 = 1.12 ± 0.06).
FIG. 6.

Transmitter release from ORN terminals depends superlinearly on calcium influx. A: ON-evoked spH signals recorded from a glomerulus under different external Ca2+ concentrations ([Ca2+]ext). Each trace is the average of 4 trials and is bleach-subtracted and low-pass filtered at 15 Hz. B: ON-evoked EPSCs recorded from an external tufted cell in different [Ca2+]ext. Each trace is the average of ≥6 trials. Stimulus artifact has been clipped. C: plots of spH signal (open squares, red) and external tufted cell EPSC amplitude (closed circles, black) as a function of [Ca2+]ext. Response amplitudes are normalized to the amplitude at 2 mM [Ca2+ext[r]]. Error bars are SE. Solid curves show fits of each dataset to the Hill equation. n, Hill coefficient. The fits are nearly identical for the spH and EPSC recordings. D: effect of ω-conotoxin GVIA on rhod dextran (low-affinity) and spH signals measured from the same glomerulus. ω-conotoxin GVIA (100 nM) reduces the rhod signal by ~50% (black traces) and reduces the spH signal by ~80% (red traces). Rhod traces are high-pass filtered at 0.4 Hz; spH traces are low-pass filtered at 15 Hz.
We also reduced presynaptic calcium influx with ω-CTX GVIA. ω-CTX GVIA caused a strong reduction in transmitter release as measured with spH (Fig. 6D). 100 nM ω-CTX GVIA reduced the spH signal to 15 ± 6% of control values (n = 6 glomeruli, 3 slices) while reducing the presynaptic calcium signal to 38 ± 4% of control (n = 10 glomeruli, 4 slices). Together, these experiments demonstrate that changes in the amplitude of the ON-evoked spH signal reliably report changes in the amount of transmitter released at the ORN synapse. They also demonstrate, as previously reported (Murphy et al. 2004), that the relationship between presynaptic calcium influx and transmitter release is superlinear, although less so than at synapses elsewhere in the CNS (Mintz et al. 1995; Bollmann et al. 2000).
As predicted given the preceding results, the ON-evoked spH signal showed strong paired-pulse depression. The time course of this PPD paralleled that of the presynaptic calcium signal, showing a slow onset and reaching maximum at ISIs of 100 –200 ms (Fig. 7A). The PPD of the spH signal was consistently stronger than that of the presynaptic calcium signal (Fig. 7A). At a 400-ms ISI, the paired-pulse ratio for the spH signal was 0.14 ± 0.01 (n = 59 glomeruli, 25 slices) compared with 0.68 ± 0.02 (n = 34) for CGD (P < 0.001, unpaired t-test). Unlike the presynaptic calcium signal, however, significant depression of the spH signal remained even at the shortest ISIs tested, with a paired-pulse ratio at 20 ms of 0.59 ± 0.04 (n = 15 glomeruli, 8 slices).
FIG. 7.

Feedback inhibition regulates transmitter release from ORNs as measured with spH. A: plots showing PPR of the spH signal (•) and low-affinity rhod signal (○; same data as in Fig. 2C) measured in different preparations. Numbers indicate number of glomeruli for the spH measurements for each interval. Paired-pulse depression of the spH signal shows a delayed onset like that of the rhod (Ca2+) signal. Rhod data are the same as shown in Fig. 3C. B: traces showing spH signals evoked by paired ON shocks (400-ms ISI) before (top) and during (bottom) application of APV/NBQX (100 μM/20 μM). In control ACSF, the spH signal shows strong paired-pulse depression (PPR ~ 0.20), which is reduced by APV/NBQX. Traces are averages of 4–6 trials and are low-pass filtered at 15 Hz. C: summary data showing effect of APV/NBQX on PPR of the spH signal (at 400-ms ISI) and on test and conditioning response amplitudes. APV/NBQX caused a significant increase in the PPR, with no change in the conditioning response amplitude. Because of the small test response amplitude, its percent increase after APV/NBQX was highly variable and so is not shown.
As in the calcium signal experiments, PPD of the spH signal was reduced by ionotropic glutamate receptor blockade (Fig. 7A): in the presence of APV/CNQX, the paired-pulse ratio increased from 0.14 ± 0.04 to 0.32 ± 0.06 (P < 0.001, paired t-test; n = 12 glomeruli, 5 slices; Fig. 7B). Replacing CNQX with NBQX, which more effectively blocks kainate as well as AMPA receptors, reduced PPD even further, with a paired-pulse ratio at 400 ms of 0.52 ± 0.07 ms (n = 9 glomeruli, 5 slices; Fig. 7C). As with the presynaptic calcium signal, glutamate receptor blockade increased the test response amplitude with no effect on the conditioning response (Fig. 7C).
As with the calcium signals, spH imaging also revealed a strong regulation of transmitter release from ORNs by GABAB receptors. Baclofen (2 μM) reduced the spH signal evoked by a single ON shock to 17 ± 4% of control values (n = 11 glomeruli, 4 slices; Fig. 8A). CGP55845 (50 μM) mimicked the effect of APV/NBQX, reducing PPD of the spH signal by causing an increase in the amplitude of the test response (paired-pulse ratio increased from 0.11 ± 0.08 to 0.58 ± 0.02; P < 0.001, paired t-test; n = 11 glomeruli, 4 slices; Fig. 8, B and C). The conditioning response was unaffected (Fig. 8, B and C; 6 ± 4% decrease, P = 0.07; 1-group, 2-tailed t-test). These data indicate that the reduction in presynaptic calcium influx following an initial ON shock is mediated, at least in part, by GABAB receptors; this mechanism also reduces the amount of transmitter released from ORNs and attenuates sensory input to olfactory bulb neurons.
FIG. 8.
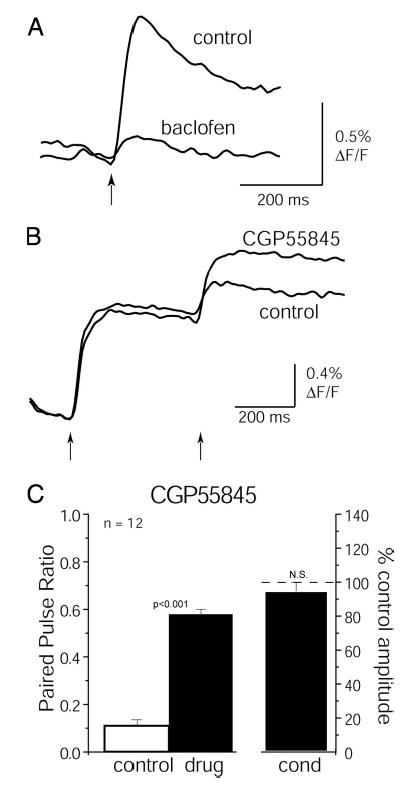
GABAB receptors mediate paired-pulse depression of transmitter release from ORNs. A: spH signals evoked by a single ON nerve shock before and during application of baclofen (2 μM). Baclofen strongly reduces the spH signal. B: spH signals evoked by paired ON shocks (400-ms ISI) before and during application of CGP55845 (50 μM). As with APV/NBQX, CGP55845 reduces paired-pulse depression. Traces in A and B are averages of 4 trials and are low-pass filtered at 15 Hz. C: summary data showing effect of CGP55845 (50 μM) on the spH signal. As with the calcium signal, CGP55845 reduces paired-pulse depression without affecting conditioning response amplitude. The reduction of PPR is similar to that induced by APV/NBQX.
DISCUSSION
Cellular mechanisms underlying presynaptic inhibition of mammalian ORNs
Considerable evidence indicates that input from ORNs onto neurons in the mammalian olfactory bulb is regulated by inhibitory feedback from bulbar interneurons, which are activated either tonically or in response to olfactory nerve input (Aroniadou-Anderjaska et al. 2000; Ennis et al. 2001; Hsia et al. 1999; Wachowiak and Cohen 1999). By selectively imaging calcium influx into and transmitter release from ORN presynaptic terminals, the present study directly demonstrates that ORN input to the bulb is regulated presynaptically and that this modulation is mediated, at least in part, by GABAB receptor-mediated inhibition of N-type, voltage-activated calcium channels. A similar mechanism regulates olfactory receptor input to the turtle olfactory bulb (Wachowiak and Cohen 1999). The present results extend these findings to the mammalian bulb and demonstrate that the modulation of presynaptic calcium influx significantly reduces transmitter release from ORNs.
GABAB receptor activation reduces presynaptic calcium influx in other areas of the mammalian CNS, including the retinogeniculate synapse (Chen and Regehr 2003), the synapse between cerebellar granule cells and Purkinje cells and mossy fibers (Dittman and Regehr 1997; Mitchell and Silver 2000), and hippocampal CA3-CA1 synapses (Pfrieger et al. 1994; Wu and Saggau 1995). The reduction is due to a G-protein-mediated downregulation of presynaptic voltage-sensitive calcium channels (Dolphin 1998; Isaacson 1998). The delayed onset of PPD observed here, together with the downregulation of calcium influx through presynaptic N-type calcium channels caused by baclofen, suggest that a similar mechanism mediates presynaptic inhibition at the ORN-olfactory bulb synapse.
We quantified the relationship between presynaptic calcium influx and transmitter release by recording spH signals and monosynaptic EPSCs while varying the external calcium concentration. With both recording methods, we found that the relationship between calcium influx and release was superlinear, although less so than at other central synapses (Bollmann et al. 2000; Mintz et al. 1995), a finding also reported by Murphy et al. (2004) for the ORN synapse. In addition, suppressing presynaptic calcium influx with baclofen or with ω-conotoxin GVIA strongly suppressed the spH signal, consistent with the fact that baclofen eliminates ON-evoked EPSCs in juxtaglomerular neurons of the rat olfactory bulb (Aroniadou-Anderjaska et al. 2000). We also found that the onset kinetics of paired-pulse suppression were similar for the presynaptic calcium and spH signals. Together these data suggest that the modulation of presynaptic calcium influx has a large impact on transmitter release from ORNs and thus comprises a major pathway by which olfactory input to the CNS in regulated.
Despite the importance of presynaptic calcium influx, other intracellular pathways are likely to play a role in regulating transmitter release from ORNs. For example, 2 μM baclofen suppressed presynaptic calcium influx by ~50%. The measured relationship between calcium influx and transmitter release (Fig. 6C) predicts that this suppression should result in an ~40% reduction in release, yet 2 μM baclofen in fact caused an ~80% reduction in the spH signal. Thus GABAB receptors appear to be coupled to additional intracellular pathways that can modulate transmitter release independent of changes in calcium influx. In addition, preliminary experiments with calcium-sensitive dyes and spH in our laboratories suggest that D2 dopamine receptors also modulate transmitter release from ORNs but via a mechanism that is less dependent on presynaptic calcium influx (data not shown). In other systems, activation of metabotropic receptors (such as GABAB receptors) can modulate release by affecting vesicle release machinery directly (Blackmer et al. 2001). In addition, cyclic nucleotides modulate resting calcium levels in ORN terminals and alter both spontaneous and ON-evoked transmitter release (Murphy and Isaacson 2003). These additional modulatory mechanisms can now be addressed with the presynaptic imaging approaches used in this study.
Strength and time course of presynaptic inhibition of ORNs
Earlier studies characterized presynaptic inhibition at the ORN synapse using field potential or whole cell recordings from olfactory bulb interneurons (Aroniadou-Anderjaska et al. 2000; Ennis et al. 2001; Murphy and Isaacson 2003). Our results agree qualitatively with those studies, showing a long-lasting PPD mediated by GABAB receptors on ORN terminals. However, field potentials recorded from the glomerular layer, which reflect postsynaptic currents arising from M/T cells (Aroniadou-Anderjaska et al. 1999), show a shorter duration suppression than we observed, with nearly complete recovery at 400-ms ISI (see Fig. 7B of Aroniadou-Anderjaska et al. 2000). The field potential recordings were performed with N-methyl-d-aspartate receptors blocked by APV, however, which may reduce ON-evoked GABA release from PG cells. Circuit interactions within the glomerulus may also account for these time-course differences. For example, ORNs provide excitatory input to M/T cells, to some PG cells, and to all external tufted cells. External tufted cells excite all PG cells (Hayar et al. 2004), which, in turn, inhibit M/T cells. Thus PPD of PG cells would be expected to reduce PG inhibition of M/T cells. This effect might partially offset PPD of excitatory ORN input to M/T cells, resulting in a more rapid recovery of mitral cell excitability (and field potential responses) than the recovery of transmitter release from ORNs. The massive convergence of ORNs onto M/T cells may also amplify ORN inputs such that a moderate amount of depression at longer ISIs is not apparent in the field potential recordings.
We found that the component of PPD mediated by synaptic feedback (i.e., eliminated by ionotropic glutamate receptor blockade) showed a delayed onset, becoming apparent between 20 and 50 ms and reaching peak magnitude between 100 and 200 ms. PPD remaining after glutamate receptor blockade and at short ISIs may be due to mechanisms intrinsic to the presynaptic terminal, such as synaptic vesicle depletion, activation of Ca2+-activated K+ channels (Isaacson and Murphy 2001; Murphy et al. 2004) or Ca2+ channel inactivation. Nonetheless, the slow onset kinetics of feedback presynaptic inhibition may be important in shaping the temporal dynamics of odorant-evoked input to a glomerulus. Active sniffing in awake rodents occurs at frequencies of 5–10 Hz (Youngentob et al. 1987) and presynaptic inhibition may serve to synchronize glomerular inputs to the onset of a sniff or to limit summation and saturation of postsynaptic responses during odorant sampling across multiple sniffs.
Synaptic organization of presynaptic inhibition in the olfactory bulb glomerulus
Although our data demonstrate an inhibition of ORN presynaptic terminals, ultrastructural studies of the glomerulus have provided no evidence for classical axoaxonic synapses onto these terminals (Hinds 1970; Pinching and Powell 1971). Nonetheless, both GABAB and D2 dopamine receptors are present on ORN terminals (Bonino et al. 1999; Koster et al. 1999). These receptors may be activated by spillover from transmitter released at periglomerular-M/T cell synapses. Spill-over of glutamate from M/T cells at this same synapse has been hypothesized to enhance excitation of M/T cells (Aroniadou-Anderjaska et al. 1999; Carlson et al. 2000; Isaacson 1999; Schoppa and Westbrook 2001). Signaling via spillover is well established in many other areas of the CNS (Dittman and Regehr 1997; Rossi and Hamann 1998).
While we focused on GABA-mediated effects in the present study, multiple transmitter pathways are involved in presynaptic inhibition of ORNs. In the lobster, both GABA and histamine, released from local interneurons, mediate presynaptic inhibition (Wachowiak and Cohen 1998, 1999), whereas in turtles and rodents, GABA and dopamine have been implicated (Aroniadou-Anderjaska et al. 2000; Ennis et al. 2001; Hsia et al. 2001; Wachowiak and Cohen 1999). Other signaling pathways may also be involved. For example, blocking ionotropic glutamate receptor activation, which blocks ON-evoked activation of postsynaptic neurons (Aroniadou-Anderjaska et al. 1999; Aungst et al. 2003; Keller et al. 1998), did not completely eliminate PPD of either calcium influx or transmitter release as measured with spH. Potential transmitters that might be involved in this remaining depression include glutamate acting via presynaptic metabotropic glutamate receptors, and adenosine or ATP acting via P2X receptors, which are expressed on ORN somata (Hegg et al. 2003).
Functional organization of presynaptic inhibition
The functional role of presynaptically regulating primary olfactory input to the CNS remains unclear. Postsynaptic processing at this level of the olfactory pathway is organized around the glomerulus, an anatomical and functional unit receiving highly convergent input from homotypic olfactory receptor neurons (Mombaerts et al. 1996; Treloar et al. 2002) and containing a complex network of synaptic interactions among local interneurons and the dendrites of olfactory bulb output neurons (Hayar et al. 2004; Shepherd et al. 2004). A subpopulation of interneurons, the short axon cells, extends between glomeruli and excites GABAergic interneurons, which in turn postsynaptically inhibit M/T cells, resulting in lateral inhibitory interactions among glomeruli (Aungst et al. 2003). Whether the GABA released by this interglomerular circuitry also mediates presynaptic inhibition of ORN terminals is unknown. If so, then one important role of presynaptic inhibition would be to refine spatial patterns of odorant-evoked input to different glomeruli. At the same time, however, our data show that presynaptic inhibition also occurs in the same glomerulus receiving input because we observed strong PPD in preparations in which only a single glomerulus was activated. This self-inhibition may function as a gain control mechanism, preventing saturation of postsynaptic responses in the face of massively convergent afferent inputs. Intraglomerular presynaptic inhibition may also shape the temporal dynamics of odorant-evoked input to a glomerulus. Several recent studies have used presynaptic calcium imaging and spH signals to characterize how odorants are represented in terms of spatiotemporal patterns of glomerular input (Bozza et al. 2004; Spors and Grinvald 2002; Wachowiak and Cohen 2001). These studies have reported graded response amplitudes across a wide range of odorant concentrations as well as complex, glomerulus-specific temporal dynamics of the presynaptic calcium signal. It will be interesting to investigate how these response features are shaped by presynaptic inhibition in vivo.
Acknowledgments
We thank L. Cohen for advice and for his generous loan of imaging equipment and M. Gainey and A. Elias for technical support.
Present address of P. M. Heyward: Dept. of Physiology, University of Otago, Dunedin, NZ.
Footnotes
GRANTS
This work supported by National Institute of Deafness and Other Communication Disorders Grants DC-04938, DC-05259, and DC-006441 to M. Wachowiak and DC-02173 and DC-36940 to M. T. Shipley.
References
- Aroniadou-Anderjaska V, Ennis M, Shipley MT. Dendrodendritic recurrent excitation in mitral cells of the rat olfactory bulb. J Neurophysiol. 1999;82:489–494. doi: 10.1152/jn.1999.82.1.489. [DOI] [PubMed] [Google Scholar]
- Aroniadou-Anderjaska V, Zhou F-M, Priest CA, Ennis M, Shipley MT. Tonic and synaptically evoked presynaptic inhibition of sensory input to rat olfactory bulb via GABAB heteroreceptors. J Neurophysiol. 2000;84:1194–1203. doi: 10.1152/jn.2000.84.3.1194. [DOI] [PubMed] [Google Scholar]
- Aungst JL, Heyward PM, Puche AC, Karnup SV, Hayar A, Szabo G, Shipley MT. Center-surround inhibition among olfactory bulb glomeruli. Nature. 2003;426:623–629. doi: 10.1038/nature02185. [DOI] [PubMed] [Google Scholar]
- Beierlein M, Gee KR, Martin VV, Regehr WG. Presynaptic calcium measurements at physiological temperatures using a new class of dextran-conjugated indicators. J Neurophysiol. 2004;92:591–599. doi: 10.1152/jn.00057.2004. [DOI] [PubMed] [Google Scholar]
- Blackmer T, Larsen EC, Takahashi M, Martin TF, Alford S, Hamm HE. G protein betagamma subunit-mediated presynaptic inhibition: regulation of exocytotic fusion downstream of Ca2+ entry. Science. 2001;292:293–297. doi: 10.1126/science.1058803. [DOI] [PubMed] [Google Scholar]
- Bollmann JH, Sakmann B, Borst JG. Calcium sensitivity of glutamate release in a calyx-type terminal. Science. 2000;289:953–957. doi: 10.1126/science.289.5481.953. [DOI] [PubMed] [Google Scholar]
- Bonino M, Cantino D, Sassoe-Pognetto M. Cellular and subcellular localization of gamma-aminobutyric acidB receptors in the rat olfactory bulb. Neurosci Lett. 1999;274:195–198. doi: 10.1016/s0304-3940(99)00697-7. [DOI] [PubMed] [Google Scholar]
- Bozza T, McGann JP, Mombaerts P, Wachowiak M. In vivo imaging of neuronal activity by targeted expression of a genetically encoded probe in the mouse. Neuron. 2004;42:9–21. doi: 10.1016/s0896-6273(04)00144-8. [DOI] [PubMed] [Google Scholar]
- Cajal RS.Histologie du Systeme Neurneux de l’Hommes et des Vertebres. Paris: Maloine, 1911.
- Carlson GC, Shipley MT, Keller A. Long-lasting depolarizations in mitral cells of the rat olfactory bulb. J Neurosci. 2000;20:2011–2021. doi: 10.1523/JNEUROSCI.20-05-02011.2000. [DOI] [PMC free article] [PubMed] [Google Scholar]
- Chen C, Regehr WG. Presynaptic modulation of the retinogeniculate synapse. J Neurosci. 2003;23:3130–3135. doi: 10.1523/JNEUROSCI.23-08-03130.2003. [DOI] [PMC free article] [PubMed] [Google Scholar]
- Chen WR, Shepherd GM. Membrane and synaptic properties of mitral cells in slices of rat olfactory bulb. Brain Res. 1997;745:189–196. doi: 10.1016/s0006-8993(96)01150-x. [DOI] [PubMed] [Google Scholar]
- Dittman JS, Regehr WG. Mechanism and kinetics of heterosynaptic depression at a cerebellar synapse. J Neurosci. 1997;17:9048–9059. doi: 10.1523/JNEUROSCI.17-23-09048.1997. [DOI] [PMC free article] [PubMed] [Google Scholar]
- Dolphin AC. Mechanisms of modulation of voltage-dependent calcium channels by G proteins. J Physiol. 1998;506:3–11. doi: 10.1111/j.1469-7793.1998.003bx.x. [DOI] [PMC free article] [PubMed] [Google Scholar]
- Ennis M, Zhou F-M, Ciombor KJ, Aroniadou-Anderjaska V, Hayar A, Borrelli E, Zimmer LA, Margolis F, Shipley MT. Dopamine D2 receptor-mediated presynaptic inhibition of olfactory nerve terminals. J Neurophysiol. 2001;86:2986–2997. doi: 10.1152/jn.2001.86.6.2986. [DOI] [PubMed] [Google Scholar]
- Gandhi SP, Stevens CF. Three modes of synaptic vesicular recycling revealed by single-vesicle imaging. Nature. 2003;423:607–613. doi: 10.1038/nature01677. [DOI] [PubMed] [Google Scholar]
- Hayar A, Karnup S, Ennis M, Shipley MT. External tufted cells: a major excitatory element that coordinates glomerular activity. J Neurosci. 2004;24:6676–6685. doi: 10.1523/JNEUROSCI.1367-04.2004. [DOI] [PMC free article] [PubMed] [Google Scholar]
- Hegg CC, Greenwood D, Huang W, Han P, Lucero MT. Activation of purinergic receptor subtypes modulates odor sensitivity. J Neurosci. 2003;23:8291–8301. doi: 10.1523/JNEUROSCI.23-23-08291.2003. [DOI] [PMC free article] [PubMed] [Google Scholar]
- Heidelberger R, Matthews G. Calcium influx and calcium current in single synaptic terminals of goldfish retinal bipolar neurons. J Physiol. 1992;447:235–256. doi: 10.1113/jphysiol.1992.sp019000. [DOI] [PMC free article] [PubMed] [Google Scholar]
- Heyward P, Ennis M, Keller A, Shipley MT. Membrane bistability in olfactory bulb mitral cells. J Neurosci. 2001;21:5311–5320. doi: 10.1523/JNEUROSCI.21-14-05311.2001. [DOI] [PMC free article] [PubMed] [Google Scholar]
- Hinds JW. Reciprocal and serial dendrodendritic synapses in the glomerular layer of the rat olfactory bulb. Brain Res. 1970;17:530–534. doi: 10.1016/0006-8993(70)90263-5. [DOI] [PubMed] [Google Scholar]
- Hsia AY, Vincent J-D, Lledo P-M. Dopamine depresses synaptic inputs into the olfactory bulb. J Neurophysiol. 1999;82:1082–1085. doi: 10.1152/jn.1999.82.2.1082. [DOI] [PubMed] [Google Scholar]
- Isaacson JS. GABAB receptor-mediated modulation of presynaptic currents and excitatory transmission at a fast central synapse. J Neurophysiol. 1998;80:1571–1576. doi: 10.1152/jn.1998.80.3.1571. [DOI] [PubMed] [Google Scholar]
- Isaacson JS. Glutamate spillover mediates excitatory transmission in the rat olfactory bulb. Neuron. 1999;23:377–384. doi: 10.1016/s0896-6273(00)80787-4. [DOI] [PubMed] [Google Scholar]
- Isaacson JS, Murphy GJ. Glutamate-mediated extrasynaptic inhibition: direct coupling of NMDA receptors to Ca(2+)-activated K+ channels. Neuron. 2001;31:1027–1034. doi: 10.1016/s0896-6273(01)00428-7. [DOI] [PubMed] [Google Scholar]
- Keller A, Yagodin S, Aroniadou-Anderjaska V, Zimmer L, Ennis M, Sheppard N, Shipley M. Functional organization of rat olfactory bulb glomeruli revealed by optical imaging. J Neurosci. 1998;18:2602–2612. doi: 10.1523/JNEUROSCI.18-07-02602.1998. [DOI] [PMC free article] [PubMed] [Google Scholar]
- Koster NL, Norman AB, Richtand NM, Nickell WT, Puche AC, Pixley SK, Shipley MT. Olfactory receptor neurons express D2 dopamine receptors. J Comp Neurol. 1999;411:666–673. doi: 10.1002/(sici)1096-9861(19990906)411:4<666::aid-cne10>3.0.co;2-s. [DOI] [PubMed] [Google Scholar]
- Kreitzer AC, Gee KR, Archer EA, Regehr WG. Monitoring presynaptic calcium dynamics in projection fibers by in vivo loading of a novel calcium indicator. Neuron. 2000;27:25–32. doi: 10.1016/s0896-6273(00)00006-4. [DOI] [PubMed] [Google Scholar]
- Miesenbock G, De Angelis DA, Rothman JE. Visualizing secretion and synaptic transmission with pH-sensitive green fluorescent proteins. Nature. 1998;394:192–195. doi: 10.1038/28190. [DOI] [PubMed] [Google Scholar]
- Mintz IM, Sabatini BL, Regehr WG. Calcium control of transmitter release at a cerebellar synapse. Neuron. 1995;15:675–688. doi: 10.1016/0896-6273(95)90155-8. [DOI] [PubMed] [Google Scholar]
- Mitchell SJ, Silver RA. GABA spillover from single inhibitory axons suppresses low-frequency excitatory transmission at the cerebellar glomerulus. J Neurosci. 2000;20:8651–8658. doi: 10.1523/JNEUROSCI.20-23-08651.2000. [DOI] [PMC free article] [PubMed] [Google Scholar]
- Mombaerts P, Wang F, Dulac C, Chao SK, Nemes A, Mendelsohn M, Edmondson J, Axel R. Visualizing an olfactory sensory map. Cell. 1996;87:675–686. doi: 10.1016/s0092-8674(00)81387-2. [DOI] [PubMed] [Google Scholar]
- Murphy GJ, Glickfeld LL, Balsen Z, Isaacson JS. Sensory neuron signaling to the brain: properties of transmitter release from olfactory nerve terminals. J Neurosci. 2004;24:3023–3030. doi: 10.1523/JNEUROSCI.5745-03.2004. [DOI] [PMC free article] [PubMed] [Google Scholar]
- Murphy GJ, Isaacson JS. Presynaptic cyclic nucleotide-gated ion channels modulate neurotransmission in the mammalian olfactory bulb. Neuron. 2003;37:639–647. doi: 10.1016/s0896-6273(03)00057-6. [DOI] [PubMed] [Google Scholar]
- Pfrieger FW, Gottmann K, Lux HD. Kinetics of GABAB receptor-mediated inhibition of calcium currents and excitatory synaptic transmission in hippocampal neurons in vitro. Neuron. 1994;12:97–107. doi: 10.1016/0896-6273(94)90155-4. [DOI] [PubMed] [Google Scholar]
- Pinching AJ, Powell TPS. The neuropil of the periglomerular region of the olfactory bulb. J Cell Sci. 1971;9:379–409. doi: 10.1242/jcs.9.2.379. [DOI] [PubMed] [Google Scholar]
- Ressler KJ, Sullivan SL, Buck LB. Information coding in the olfactory system: evidence for a stereotyped and highly organized map in the olfactory bulb. Cell. 1994;79:1245–1255. doi: 10.1016/0092-8674(94)90015-9. [DOI] [PubMed] [Google Scholar]
- Rossi DJ, Hamann M. Spillover-mediated transmission at inhibitory synapses promoted by high affinity alpha6 subunit GABA(A) receptors and glomerular geometry. Neuron. 1998;20:783–795. doi: 10.1016/s0896-6273(00)81016-8. [DOI] [PubMed] [Google Scholar]
- Rudomin P. Presynaptic inhibition of muscle spindle and tendon organ afferents in the mammalian spinal cord. Trends Neurosci. 1990;1:164–166. doi: 10.1016/0166-2236(90)90084-n. [DOI] [PubMed] [Google Scholar]
- Sankaranarayanan S, De Angelis D, Rothman JE, Ryan TA. The use of pHluorins for optical measurements of presynaptic activity. Biophys J. 2000;79:2199–2208. doi: 10.1016/S0006-3495(00)76468-X. [DOI] [PMC free article] [PubMed] [Google Scholar]
- Schoppa NE, Westbrook GL. Glomerulus-specific synchronization of mitral cells in the olfactory bulb. Neuron. 2001;31:639–651. doi: 10.1016/s0896-6273(01)00389-0. [DOI] [PubMed] [Google Scholar]
- Shepherd GM, Chen WR, and Greer CA. Olfactory bulb. In: The Synaptic Organization of the Brain (5th ed.), edited by Shepherd GM. Oxford: Oxford Univ Press, 2004, p. 165–216.
- Spors H, Grinvald A. Spatiotemporal dynamics of odor representations in the mammalian olfactory bulb. Neuron. 2002;34:301–315. doi: 10.1016/s0896-6273(02)00644-x. [DOI] [PubMed] [Google Scholar]
- Treloar HB, Feinstein P, Mombaerts P, Greer CA. Specificity of glomerular targeting by olfactory sensory axons. J Neurosci. 2002;22:2469–2477. doi: 10.1523/JNEUROSCI.22-07-02469.2002. [DOI] [PMC free article] [PubMed] [Google Scholar]
- Wachowiak M, Cohen LB. Presynaptic afferent inhibition of lobster olfactory receptor cells: reduced action-potential propagation into axon terminals. J Neurophysiol. 1998;80:1011–1015. doi: 10.1152/jn.1998.80.2.1011. [DOI] [PubMed] [Google Scholar]
- Wachowiak M, Cohen LB. Presynaptic inhibition of primary olfactory afferents mediated by different mechanisms in lobster and turtle. J Neurosci. 1999;19:8808–8817. doi: 10.1523/JNEUROSCI.19-20-08808.1999. [DOI] [PMC free article] [PubMed] [Google Scholar]
- Wachowiak M, Cohen LB. Representation of odorants by receptor neuron input to the mouse olfactory bulb. Neuron. 2001;32:723–735. doi: 10.1016/s0896-6273(01)00506-2. [DOI] [PubMed] [Google Scholar]
- Wachowiak M, Cohen LB. Correspondence between odorant-evoked patterns of receptor neuron input and intrinsic optical signals in the mouse olfactory bulb. J Neurophysiol. 2003;89:1623–1639. doi: 10.1152/jn.00747.2002. [DOI] [PubMed] [Google Scholar]
- Wachowiak M, Denk W, Friedrich RW. Functional organization of sensory input to the olfactory bulb glomerulus analyzed by two-photon calcium imaging. Proc Natl Acad Sci USA. 2004;101:9097–9102. doi: 10.1073/pnas.0400438101. [DOI] [PMC free article] [PubMed] [Google Scholar]
- Wu LG, Saggau P. GABAB receptor-mediated presynaptic inhibition in guinea-pig hippocampus is caused by reduction of presynaptic Ca2+ influx. J Physiol. 1995;485:649–657. doi: 10.1113/jphysiol.1995.sp020759. [DOI] [PMC free article] [PubMed] [Google Scholar]
- Youngentob SL, Mozell MM, Sheehe PR, Hornung DE. A quantitative analysis of sniffing strategies in rats performing odor discrimination tasks. Physiol Behav. 1987;41:59–69. doi: 10.1016/0031-9384(87)90131-4. [DOI] [PubMed] [Google Scholar]
- Zucker RS, Regehr WG. Short-term synaptic plasticity. Annu Rev Physiol. 2002;64:355–405. doi: 10.1146/annurev.physiol.64.092501.114547. [DOI] [PubMed] [Google Scholar]