

Abstract
Cadherins are a superfamily of adhesion molecules that mediate Ca2+-dependent cell–cell adhesion. T-cadherin (T-cad), a unique glycosylphosphatidylinositol-anchored member of the cadherin superfamily, was initially identified by immunoblotting of vascular cell membranes as an atypical low affinity low density lipoprotein (LDL)-binding protein. It is not known whether this heterophilic interaction is physiologically relevant. Expression of T-cadherin is upregulated in vascular cells during atherosclerosis, restenosis and tumour angiogenesis, conditions characterized by enhanced cell migration and growth. Elevated levels of serum low density lipoproteins (LDL), which result in cholesterol accumulation in vascular wall, is a widely accepted risk factor in atherosclerosis development. Additionally to its metabolic effects, LDL can produce hormone-like effects in a number of cell types. This study has utilized HEK293 cells and L929 cells stably transfected with T-cadherin cDNA to investigate T-cad-dependent responses to LDL. Stable expression of T-cad in both HEK293 and L929 cells results in significantly (p < 0.05) elevated specific surface binding of [I125]-LDL. Compared with mock-transfectants, cells expressing T-cad exhibit significantly (p < 0.01) enhanced LDL-induced mobilization of intracellular Ca2+-stores and a significantly (p < 0.01) increased migration toward an LDL gradient (0.1% BSA + 60 μg/ml LDL) in Boyden chamber migration assay. Thus LDL-binding to T-cad is capable of activating physiologically relevant intracellular signaling and functional responses.
Keywords: Ca2+-mediated cell signaling, LDL, LDL binding, migration, T-cadherin
Introduction
Cadherins are a superfamily of adhesion molecules that mediate Ca2+-dependent cell–cell adhesion and participate in the establishment of cell polarity, cell sorting and morphogenesis during embryonic development and in the adult organism [1]. The classical cadherins are single-span transmembrane proteins that are located primarily within adherent junctions and regulate cell adhesion. Binding of their intracellular domain to the actin cytoskeleton ensures the stability of cadherin-mediated adhesive junctions [2, 3]. T-cad is a unique member of the caherin superfamily. While possessing the general extracellular domain structure of the classical cadherins, it lacks the transmembrane and cytoplasmic parts and is bound to the plasma membrane via a glycosylphosphatidylinositol (GPI) anchor [4, 5]. T-cad can induce weak homophilic cell–cell adhesion between transfected cells [4] but is unlikely to participate in formation of stable adhesive cell–cell contacts because it does not link to the cytoskeleton.
T-cad was originally cloned from chick embryo brain, where it is expressed in a spatio-temporally restricted pattern. Somatic motor neurons of the chick spinal cord select their pathways as they grow towards their muscle targets avoiding particular regions with cells expressing T-cadherin [6]. Neurite outgrowth is inhibited in neurons cultured on substratum containing T-cad, suggesting that T-cad acts as a negative guidance cue for neurons in the developing nervous system [7]. T-cad is highly expressed in resident cardiovascular tissue endothelial cells (EC), vascular smooth muscle cells (VSMC), pericytes and cardiomyocytes [8]. A T-cad substratum inhibits adhesion and spreading of VSMC and human umbilical vein endothelial cells (HUVEC) [9], suggesting that T-cad might also function as a guidance molecule during vascular development and remodeling as it functions in the nervous system during neurite outgrowth [6, 7].
Additional functions for T-cad in control of vascular cell proliferation and migration have been proposed. T-cad expression is upregulated in vivo in some pathological conditions such as restenosis after balloon angioplasty [10], tumor angiogenesis [11, 12] and atherosclerosis [8] which are associated with abnormal migration, growth and phenotypic modulation of vascular cells. In vitro T-cad was recently found to be dynamically regulated during the cell cycle in VSMC and HUVEC, and overexpression led to an increased proliferation potential [13]. HUVEC overexpressing T-cad were also shown to display an increased capacity for migration potential that was dependent upon homophilic (i.e. T-cad–T-cad) interactions [9].
Using ligand blotting techniques we initially identified T-cadherin in plasma membrane preparations of VSMC as an LDL-binding protein with properties different from all known lipoprotein receptors [14–16]. The physiological consequences of this interaction are not known. However, elevated serum LDLs play an important role in atherosclerosis development not only by promoting cholesterol accumulation in vascular wall, but also by participating in pro-inflammatory responses such as cell adhesion, migration and proliferation [17, 18]. In this study we examine the hypothesis that binding of LDL to T-cad is able to induce physiologically relevant cellular responses. HEK293 and L929 cells stably transfected with human T-cad cDNA served as a useful experimental model since constitutive expression T-cad in these cells is absent.
Materials and methods
Chemicals
Electrophoresis reagents were obtained from Bio-Rad Laboratories (Hercules, USA). Trypsin and cell culture reagents were from Gibco (Life Technologies, Switzerland). Buffers and other chemicals were purchased from Sigma (St. Louis, MO, USA).
Cell culture and transfection
Human embryonic kidney cells (HEK293) expressing GPI-anchored human T-cad were obtained by clonal selection after stable transfection with the expression vector pcDNA 3.1 (Invitrogen, San Diego, USA) [19] using Lipofectamine 2000 reagent (Invitrogen). For control experiments we used cells stably transfected with pcDNA 3.1 vector encoding GFP protein (clone HEK/GFP). Clones were selected by incubation in DMEM/10% FBS containing 200 μg/ml Geniticin (Invitrogen). L929 cells were transfected with T-cad (vector pcDNA 3.1) using Lipofectamin 2000 reagent. Luciferase cDNA fragment in antisense orientation was cloned into the pcDNA 3.1 vector and used as a control [19]. Clones were selected by incubation in DMEM/10% FBS containing 200 μg/ml Geniticin (Invitrogen). T-cad expression in control transfectants (mocks) and T-cad transfectants (T-cad+) was examined using Western blotting. For the experiments described herein, cultures were maintained (unless otherwise specified) in DMEM containing 100 U/ml penicillin, 100 U/ml streptomycin and 10% fetal bovine serum (DMEM/FBS) at 37 °C and 5% CO2.
Western blotting
The cell monolayer was cooled to 4 °C, scraped into a lysis buffer containing 1% Triton X-100, 20 mM HEPES (pH 7.5), 150 mM NaCl, 1 mM MgCl2, 1 mM CaCl2 and protease inhibitor cocktail (PIERCE) and centrifuged at 16,000 g for 10 min at 4 °C. DNA in the clarified lysate was disrupted using a syringe and G21 needle and then protein concentration was determined using the Bio-Rad Protein Assay (Bio-Rad Laboratories) with BSA as a standard. Samples were diluted to equivalent protein concentrations in Laemmli buffer containing β-mercaptoethanol, heated for 5 min at 99 °C, electrophoresed on SDS/polyacrylamide (7.5%) gel and electroblotted onto nitrocellulose membranes (Immobilon, Millipore). Kaleidoscope Prestained Standards (Bio-Rad Laboratories) were used as molecular weight markers. After rinsing in Tris-buffer saline (TBS: 150 mM NaCl, 50 mM Tris/HCl, pH 7.4) membranes were pre-blocked for 30 min in incubation buffer (TBS containing 5% (w/v) of delipidated milk and 0.5% Tween 20; TBSM). Membranes were incubated for 1 h with primary rabbit polyclonal antibody against human T-cad [16], washed with TBSM, and then incubated for 1 h with secondary antibodies conjugated with horseradish peroxidase (Immune Jackson Research). Membanes were finally washed in TBS containing 0.5% Tween 20 and visualization of the antigen was performed using ECL™ Western Blotting Detection Reagents (Amersham Bioscience) and a CL-Xposure™ Film (Amersham Bioscience).
Purification and Iodination of LDL
LDL (density 1.019–1.063 g/ml) was isolated from the plasma of healthy male humans using sequential buoyant density centrifugation techniques with use of sodium bromide for density adjustments. LDL was exhaustively dialyzed against 0.15 M NaCl before Lowry determination of the protein concentration. LDL was sterile-filtered, stored at 4 °C and used within 3 weeks after isolation. LDL preparations contained only apo B-100 protein and were free of protein fragments known to be generated during LDL oxidation [20]. LDL was iodinated (specific activity 200–400 cpm/ng) using the iodine monochloride method [21].
[125I]-lipoprotein-binding
Binding of [125I]-LDL was studied in HEK and L929 cells (70–80% confluency) essentially as described previously [20]. Cells were rinsed well with binding buffer (serum-free DMEM medium containing 0.1% BSA; DMEM/BSA) and all subsequent washing and incubation procedures were conducted at 4 °C. Parallel series of dishes with cells were incubated for 4 h in DMEM/BSA containing 0 μg/ml, 5 μg/ml, 10 μg/ml, 25 μg/ml, 50 μg/ml, 75 μg/ml, 100 μg/ml of [125I]-LDL. Parallel dishes contained excess (1 mg/ml) of unlabelled LDL for determination of non-specific binding. Binding incubations were terminated by washing (three times) with PBS containing 1 mM CaCl2, 1 mM MgCl2, 2 mg/ml BSA. Cell bound [I125]-LDL per well was determined in a scintillation counter after solubilization in 0.1 M NaOH. Aliquots of cell lysates were taken for Lowry protein determination. Specific [I125]-LDL binding was determined after correction for non-specific binding ([I125]-LDL and data for saturation profiles of specific binding were analyzed by non-linear regression (Graph Pad Prism 4.0) to determine the maximal binding capacity (Bmax) and the dissociation constant (Kd). We also performed Scatchard analysis of specific saturation binding data after transformation into plots of the ratio of membrane-bound to free lipoprotein versus membrane-bound lipoprotein.
[Ca2+]in measurement
For measurement of [Ca2+]in HEK293 or L929 cells were seeded at a density representing 60% confluency onto glass coverslips coated with poly-D-lysine (Sigma) and cultured in DMEM without FBS overnight. Cells were incubated in DMEM containing 4 μM fura2/AM (Molecular Probes, Eugene, OR, USA) in the dark at 37 °C for 40–60 min, rinsed three times in HBSS buffer (130 mM NaCl, 5 mM KCl, 1.8 mM CaCl2, 1.0 mM MgCl2, 0.6 mM Na2HPO4, 0.4 mM, KH2PO4, 5 mM glucose, 20 mM HEPES-pH 7.4) and kept in the dark for 20 min to allow the cleavage of fura2/AM to the free fura-2 form. For [Ca2+]in measurements coverslips were mounted on a record chamber (0.2 ml) and perfused with HBSS buffer at room temperature. The imaging system consisted of an Axiovert 200 Zeiss inverted fluorescence microscope and 20X/0.75 objective, a digital camera (CCD camera CoolSnapfx RoperSci Inc), a 175 W xenon lamp and a filter wheel (Satter, USA). Cells were alternately excited with 340 and 380 wavelengths; fluorescence emission was monitored at ~505 nm. The fluorescence from 25–35 cells was simultaneously recorded. Cell images were produced at a rate of one image per 10 s. [Ca2+]in data acquisition and computation were performed using the Metafluor Analyst program (Universal Imaging Corp., Downingtown, PA). The ratio of fura-2-Ca2+complex (fluorescence at 340 nm) to free fura-2 (fluorescence at 380 nm) was used to indicate relative [Ca2+]in changes. Actual [Ca2+]in values were calculated as described [22]. The calibration curves were generated using fura-2-loaded cells treated with HBSS (no CaCl2 added) containing 5 μM ionomycin (Sigma), 10 mM EGTA (Rmin). Next, the same cells were incubated in HBSS containing 5 μM ionomycin, 10 mM EGTA and 10 mM CaCl2 (Rmax). Correction for background fluorescence was made at the end of each calibration experiment in cultured cells using a saline containing 2 mM MnCl2, to quench Ca2+-sensitive Fura-2 fluorescence. The dissociation constant Kd of the Fura-2-Ca2+ complex was assumed to be 225 nM in the cytosolic environment [22]. Figures were prepared using Graph Pad Prism 4.0 software.
Migration assay
Migration assay was performed using a modified Boyden microchamber [23]. Membranes (8 μm pore size) (Neuro Probe Inc., Gaithersberg, MD, USA) were precoated with collagen I solution (50 μg/ml). Near-confluent cultures of L929 cells were collected by suspension in Versene solution, resuspended in DMEM, counted and seeded into upper wells of the chamber at equal density. The lower wells contained DMEM/0.1% BSA (control), DMEM/0.1% BSA containing LDL, or DMEM/0.1% BSA containing LDL pre-incubated with Fab fragments of goat antibody against LDL (100 μg/ml) for 1 h [14]. After overnight incubation at 37 °C in the CO2 incubator the chamber was disassembled, cells on the upper side of the membrane were removed and cells that had migrated through the membrane were fixed and stained with Diff-Quik® Franklin Gothic Medium Staining Kit (Dade Behring GmbH, Marburg, Germany). The membrane was scanned and the intensity of spots was analysed using Scion Image software (Scion Corporation).
Statistics
All parameters were evaluated by the Student’s t-test. p < 0.05 was considered statistically significant. Results are expressed as mean ± S.E.M. unless otherwise specified.
Results
Expression of T-cad and binding of LDL
T-cad expression in cell lysates from T-cad+ and mock cells of HEK293 and L929 cell lines was examined by immunoblot analysis (Fig. 1). Only T-cad+ cells expressed T-cad (Fig. 1 lane 3, 5 and 6) and both the mature (105 kDa) and precursor (130 kDa) forms of T-cad [4] were present. Lysates of human umbilical vein endothelial cells (HUVEC) served as a positive control (lane 1).
Fig. 1.
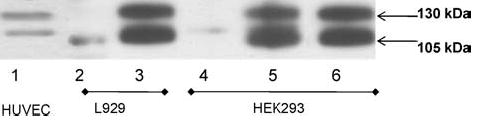
Overexpression of human T-cadherin in HEK 293 and L929 cell lines and constitutive expression of T-cadherin in HUVEC. Whole cell lysates (50 μg/lane) from T-cad-transfected L929 cells (clone TC3-lane 3) and HEK293 cells (clone T5-lane 5, clone T8-lane 6) and mock transfected cells HEK293 (clone HEK/GFP-lane 4) and L929 (clone K9-lane 2) were analyzed using immunoblot method. Lysates of HUVEC, which contain both 105 kDa and 130 kDa forms of T-cadherin (lane 1) served as a positive control.
Saturation binding studies using [I125]-LDL were performed on intact cell cultures to determine whether cell surface T-cad can bind LDL. Binding of [I125]-LDL was performed at 4 °C to minimize internalization [15]. Specific and saturable binding of [I125]-LDL was observed for both mock-and T-cad-transfected HEK293 (Fig. 2A) and L929 (Fig. 2B) cells. The Scatchard plots of specific binding data for [I125]-LDL in T-cad+ and mock cells were curvilinear, suggesting the existence of more than one binding site (not shown). Nonlinear regression analysis was applied to calculate the binding parameters for the high affinity and low affinity binding sites for HEK293 and L929 cell lines. The parameters for the high affinity binding site in HEK293 cells: for T-cad expressing cells Bmax was 18.73 ± 3.7 and Kd 3.46 ± 1.9 and for mock cells Bmax was 18.73 ± 2.8 and Kd 1.65 ± 0.64; in L929 cells for T-cad expressing cells Bmax was 21.84 ± 3.29 and Kd 1.16 ± 0.32 and for mock cells Bmax was 19.76 ± 3.37 and Kd 0.61 ± 0.38 (data not shown). The parameters for the low affinity binding site in HEK293 cells: for T-cad expressing cells Bmax was 315.5 ± 7.3 and Kd 64.9 ± 4.1 and for mock cells Bmax was 198.3 ± 12.9 and Kd 64.1 ± 3.5; in L929 cells for T-cad expressing cells Bmax was 113.6 ± 5.8 and Kd 61.4 ± 7.51 and for mocks Bmax was 88.7 ± 7.6 and Kd 69.8 ± 5.0. For both HEK293 and L929 cell lines nonlinear regression analysis of saturation profiles for two-site model revealed a significantly (P < 0.05) increased Bmax of the low affinity binding site for T-cad+ cells compared to mock cells, but there were no significant differences with respect to Kd values (Fig. 2).
Fig. 2.
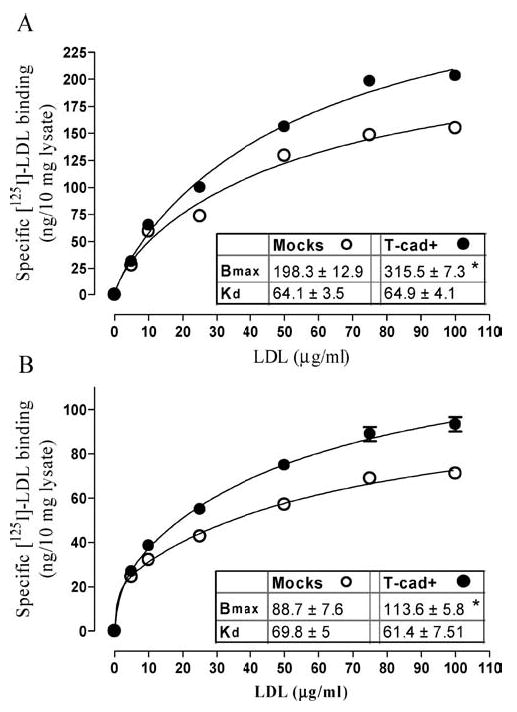
LDL binding capacity is increased in T-cad expressing HEK293 and L929 cell lines. Panel A: HEK293 cells. Panel B: L929 cells. Specific surface-binding of [125I]-LDL to T-cad expressing cells (closed symbols) and mock-transfected cells (open symbols) was determined as described in ‘Materials and Methods’. Non-linear regression analysis was applied to calculate the binding parameters Bmax and Kd. Data (means ± S.E.M.) were obtained from six independent experiments. * indicates significant difference (p < 0.05) between T-cad+ cells and mock cells.
Induction of [Ca2+]in elevation
To determine T-cad mediated intracellular signaling in response to LDL administration we tested the ability of LDL (at a single saturating concentration 60 μg/ml) to raise [Ca2+]in in Fura-2 AM loaded HEK293 and L929 cell cultures. The fluorescence recordings presented in Fig. 3 (HEK293 cells) and Fig. 4 (L929 cells) demonstrate that LDL induced rapid and reversible elevations of [Ca2+]in. After reaching peak levels within a few seconds, the [Ca2+]in rapidly declined to the basal level. However the amplitude of [Ca2+]in elevation was 2–3.5 fold higher (p < 0.01) in T-cad expressing cells as compared to mock cells. The rapid [Ca2+]in elevation was mainly due to mobilization of intracellular stores since it was also observed in Ca2+-free medium (data not shown).
Fig. 3.
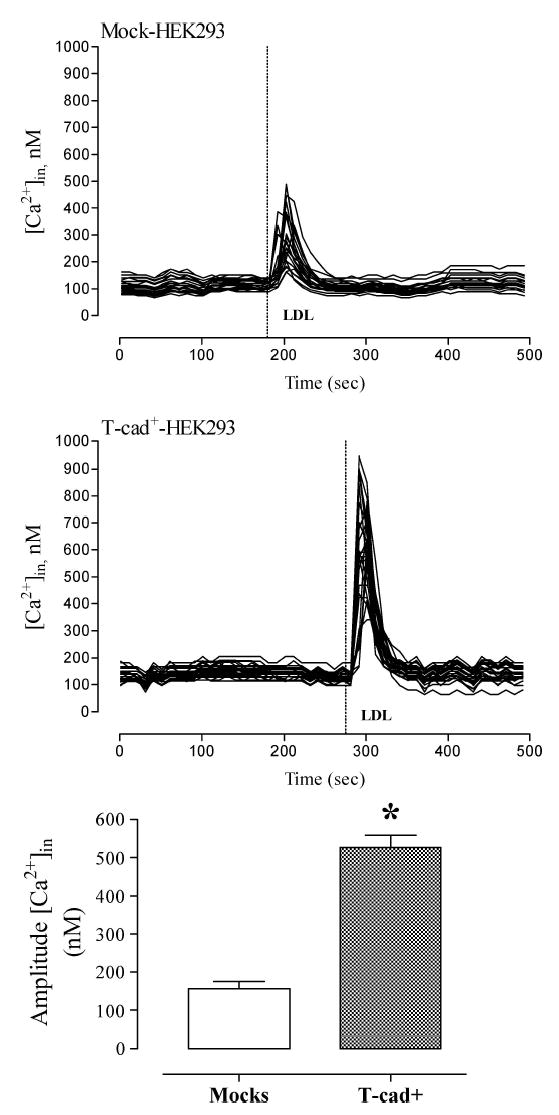
T-cad-expressing HEK293 exhibit increased calcium responsiveness to LDL. Alterations in [Ca2+]in concentration in response to the addition of 60 μg/ml LDL was monitored in Fura-2 loaded HEK293 cells as described in ‘Materials and Methods’. Individual kinetic profiles and mean amplitude (mean ± S.E.M.) of the Ca2+ response to LDL in mock cells (n = 21) and T-cad+ cells (n = 28) are shown. * indicates significant difference (p < 0.01) between T-cad+ and mock cells.
Fig. 4.
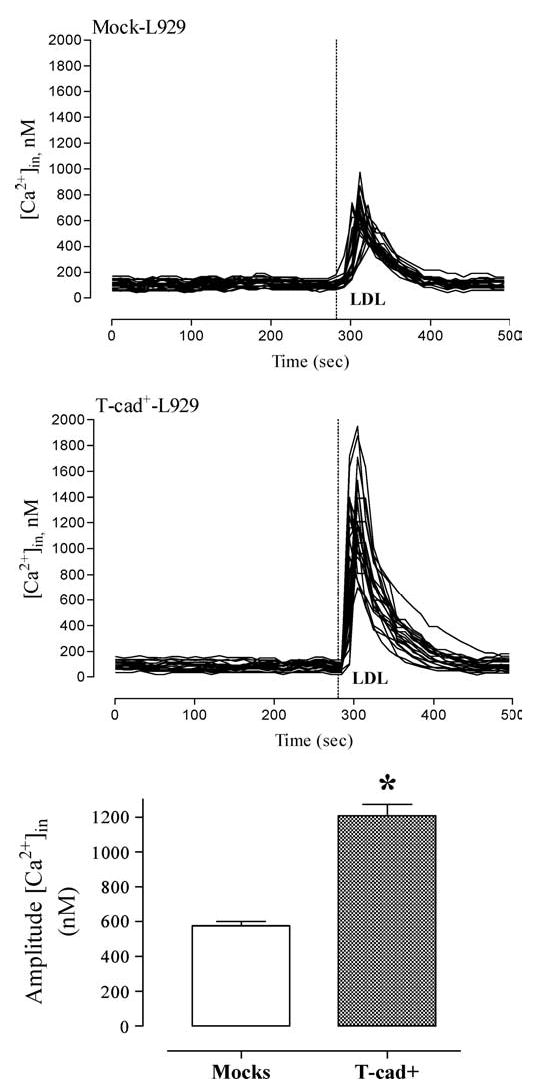
T-cad-expressing L929 exhibit increased calcium responsiveness to LDL. Alterations in [Ca2+]in concentration in response to the addition of 60 μg/ml LDL was monitored in Fura-2 loaded L929 cells as described in ‘Materials and Methods’. Individual kinetic profiles and mean amplitude (mean ± S.E.M.) of the Ca2+ response to LDL in mock cells (n = 22) and T-cad+ cells (n = 22) are shown. * indicates significant difference (p < 0.01) between T-cad+ and mock cells.
To further elucidate the mechanism of LDL-induced [Ca2+]in elevation we performed a set of experiments on HEK293 (not shown) and L929 (Fig. 5) cells treated with cyclopiazonic acid (CPA). CPA treatment is known to selectively inhibit Ca2+-ATPase of the sarcoplasmic reticulum (SERCA pumps-sarco(endo)plasmic reticulum Ca2+-ATPase) and to induce release of Ca2+ from intracellular stores without increasing cellular inositol-1, 4, 5-trisphosphate, thereby resulting in total depletion of agonist-sensitive Ca2+ stores [24, 25]. Initially during pretreatment of cell cultures with 20 μM CPA in Ca2+-containing medium there was a transient elevation of [Ca2+]in due to the Ca2+ efflux from intracellular stores. By the end of the 5 min CPA pretreatment period [Ca2+]in returned to baseline. LDL (60 μg/ml) added under these conditions failed to increase [Ca2+]in in either T-cad+ or mock cells. These data suggest that LDL stimulates [Ca2+]in elevation predominantly via mobilization of Ca2+ from the sarcoplasmic reticulum.
Fig. 5.
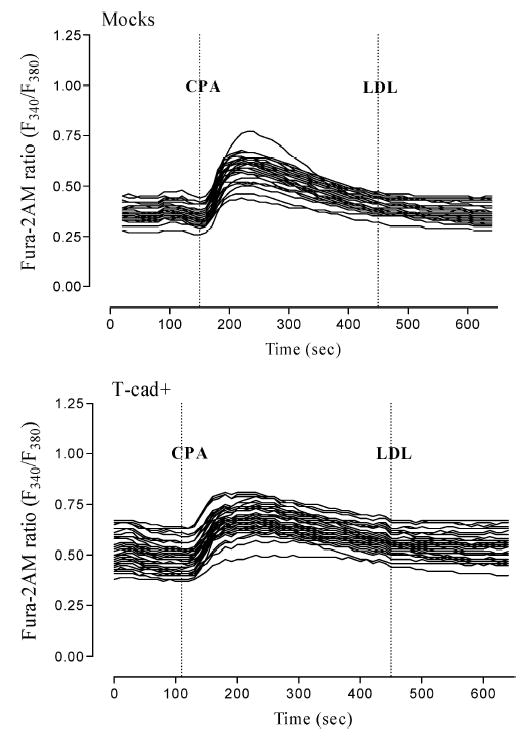
Intracellular calcium release response to LDL is absent after depletion of intracellular calcium stores. Preincubation of T-cad+ and mock-transfected L929 cells with 20 μM CPA in the Ca2+-containing medium for 5 min resulted in the slow and transient Ca2+ rise. Within 5 min the [Ca2+]in concentration gradually decreased. LDL (60 μg/ml) added in that conditions had no effect on [Ca2+]in and there was no significant difference in Ca2+-response of T-cad+ cell compared to mock cells. Data (mean ± S.E.M.) were obtained from three independent experiments.
Induction of migration by LDL
Figure 6 presents results of experiments, which assessed the role of T-cad in cell migration by chemotaxis assay using a Boyden chamber. T-cad+ and mock L929 cells were seeded into upper wells of the chamber at an equal density representing near-confluency. Spontaneous migration under control conditions (DMEM containing 0.1% BSA in the lower wells) was slightly, but not significantly, higher in T-cad+ compared to mock cells. Inclusion of LDL into the lower chamber increased cell chemotaxis in a dose-dependent manner (data not shown) and migration of T-cad+ cells was significantly (p < 0.01) greater than of the mock cells (Fig. 6; LDL at 60 μg/ml). For both T-cad+ and mock cells pre-incubation of LDL with Fab fragments of goat antibody against LDL abolished the chemotactic properties of LDL. Fab fragments alone did not affect cell migration. These data suggest that T-cad facilitates cell migratory responses to LDL.
Fig. 6.
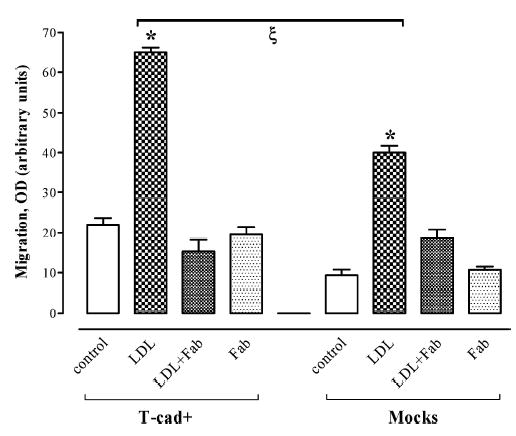
T-cadherin overexpression stimulates cell migration in response to LDL. The Boyden chamber assay was used to determine migration of cells in control conditions (DMEM/0.1% BSA), and in DMEM/0.1% BSA containing LDL (LDL), DMEM/0. 1% BSA containing LDL pre-incubated with Fab fragments of goat antibody against LDL (LDL+Fab), or DMEM/0.1% BSA with Fab fragments (Fab) as described in Methods. Data (mean ± S.E.M.) were obtained from three independent experiments. * indicates significant migration difference (p < 0.001) between control and LDL-containing conditions. ζ indicates significant difference in LDL-stimulated migration between T-cad+ cells and mock cells (p < 0.01).
Discussion
Elevated serum LDL levels, which result in cholesterol accumulation in vascular wall, is widely accepted as a risk factor in atherosclerosis development [17, 18]. There is much evidence to indicate that LDL can stimulate a number of signaling events in a variety of cells by apparently endocytosis-independent mechanisms [27–29]. Functionally LDL has been demonstrated to activate macrophages [30], promote platelet shape change and proaggregatory effects, stimulate surfactant secretion by alveolar type II cells [31], promote VSMC migration and proliferation [32, 33] and to alter blood vessel tone via both endothelial-dependent mechanisms and direct action on vascular smooth muscle cells [34, 35]. The functional responses to LDL in VSMC occur concomitantly with a number of cellular events, including stimulation of phosphoinositide catabolism, phospholipase C activation and mobilization of [Ca2+]in [20, 27, 29, 32, 33, 36]. These “hormone-like” responses elicited by LDL are rapid, dose dependent and saturable, indicating the involvement of specific receptor/binding sites in LDL-stimulated signal transduction
Our early classical binding studies with labeled LDL on quiescent VSMC have shown two LDL-binding sites, namely the “classical” receptor (Kd 1–2 μg/ml) and a novel low affinity binding site (Kd 40–50 μg/ml) [15]. Ligand blotting techniques subsequently revealed a major LDL-binding protein with Mr 105/130 kDa from de-endothelialized human medial aortic membranes with properties distinct from the presently known types of lipoprotein receptors [14–16]. There was a close correspondence between the characteristics of low affinity LDL-binding and LDL-mediated signaling [14, 15, 37]. This novel LDL binding p105/130 protein was eventually identified as T-cad [16, 38].
In this study we first stably transfected both HEK293 and L929 cells with T-cad cDNA and compared LDL-binding parameters in these cells with their respective mock-transfected controls. The Scatchard plot of binding data for [I125] LDL in T-cad expressing and mock cells was curvilinear, suggesting the existence of more than one binding site. Non-linear regression analysis of saturation profiles for two-site model revealed a significantly increased Bmax of the low affinity binding site for T-cad+ cells compared to mock cells for both cell lines, and data on binding parameters correlate well with data obtained for the low affinity binding site in vascular smooth muscle cells [15]. Increased specific LDL binding on T-cad expressing HEK293 and L929 cells thus provides evidence that LDL is a specific ligand for T-cad. These results are in agreement with the previous studies on HEK293 cells where it was shown that T-cad expression increased LDL surface binding and this effect was abolished upon phosphatidylinositol-specific phospholipase C cleavage [39, 40].
To determine whether binding of LDL by T-cad elicits an intracellular signaling response we compared mock and T-cad+ cells of HEK293 and L929 cell lines with respect to their Ca2+ mobilization response to LDL. The maximal amplitude of [Ca2+]in elevation was 2–3.5 fold higher in T-cad expressing cells compared to mock cells. [Ca2+]in elevation was mainly due to mobilization of intracellular stores since it was also observed in Ca2+-free medium. The effect of LDL administration was totally abolished in the presence of CPA, which completely depletes intracellular Ca2+ stores via specific inhibition of Ca2+-ATPase of the sarcoplasmic reticulum. These data indicate that binding of LDL by T-cad produces an intracellular signaling response (i.e. Ca2+ mobilization) analogous to the specific receptor-mediated path-way(s) utilized by Ca2+-mobilizing hormones. One might thus speculate that alterations in cellular expression of T-cad might influence the status of cellular Ca2+-signalling independently of changes in serum LDL concentrations.
The in vivo role of T-cad-associated LDL-induced Ca2+-signaling in the cardio-vascular system, where T-cad is upregulated in vascular cells under pathological conditions [8, 10], is unknown. However, several important disease states such as hypertension, heart disease, diabetes and others result from abnormal Ca2+-signaling. A broadening or increase in the amplitude of the Ca2+-spikes enhances the extent of the Ca2+-pulse, which over time could stimulate a distinct program of gene transcription and result in cardiac hypertrophy [41]. During the onset of congestive heart failure the amplitude of Ca2+-spikes is much reduced due to downregulation of β-adrenergic signaling system and declined activity of SERCA pumps (sarco(endo)plasmic reticulum Ca2+-ATPase) [41].
This study also demonstrates that LDL can induce a T-cad dependent functional cellular response, namely cell migration. Boyden chamber assay showed that T-cad expression in L929 cells facilitates spontaneous cell migration and that the LDL-induced migration of T-cad+ cells was significantly greater than of the mock cells. A role for T-cad in regulation of migration is supported by in vitro data on polarization of T-cad to the leading edge of migrating HUVEC and VSMC in the experimental wound model [19]. The apical cell surface distribution of T-cad as shown in vivo for chick intestinal epithelium chick and in vitro for polarized T-cad transfected MDCK cells was proposed to possibly endow T-cad with recognition functions [42].
Thus in the context of its ability to bind LDL physiologically T-cad might function as an extracellular sensory receptor mediating LDL-dependent cell signaling and cell migration. A potential sensory-signaling function for T-cad is further supported by its presence in membrane “raft” domains [43]. GPI-anchored proteins, which are present in membrane domains (rafts) enriched in signaling molecules, are increasingly being recognized to be involved in numerous intracellular signalling pathways such as Ca2+ signalling or tyrosine phosphorylation [44, 45]. Further studies should address which “adaptor molecules” might be recruited in response to the binding of LDL by T-cad and which downstream pathways lead to modulation of LDL-T-cad dependent cell migration.
Acknowledgments
This study was supported by grants from the Russian Foundation of Basic Research (Grant No. 04-04-49399), the Wellcome Trust (Grant No. 210183) and the Herzkreislauf Stiftung.
References
- 1.Perez-Moreno M, Jamora C, Fuchs E. Sticky business: Orchestrating cellular signals at adherens junctions. Cell. 2003;112:535–548. doi: 10.1016/s0092-8674(03)00108-9. [DOI] [PubMed] [Google Scholar]
- 2.Angst BD, Marcozzi C, Magee AI. The cadherin superfamily: Diversity in form and function. J Cell Sci. 2001;114:629–641. doi: 10.1242/jcs.114.4.629. [DOI] [PubMed] [Google Scholar]
- 3.Ivanov DB, Philippova MP, Tkachuk VA. Structure and functions of classical cadherins. Biochemistry (Mosc) 2001;66:1174–1186. doi: 10.1023/a:1012445316415. [DOI] [PubMed] [Google Scholar]
- 4.Vestal DJ, Ranscht B. Glycosyl phosphatidylinositol–anchored T-cadherin mediates calcium-dependent, homophilic cell adhesion. J Cell Biol. 1992;119:451–461. doi: 10.1083/jcb.119.2.451. [DOI] [PMC free article] [PubMed] [Google Scholar]
- 5.Ranscht B, Dours-Zimmermann MT. T-cadherin, a novel cadherin cell adhesion molecule in the nervous system lacks the conserved cytoplasmic region. Neuron. 1991;7:391–402. doi: 10.1016/0896-6273(91)90291-7. [DOI] [PubMed] [Google Scholar]
- 6.Fredette BJ, Ranscht B. T-cadherin expression delineates specific regions of the developing motor axon-hindlimb projection pathway. J Neurosci. 1994;14:7331–7346. doi: 10.1523/JNEUROSCI.14-12-07331.1994. [DOI] [PMC free article] [PubMed] [Google Scholar]
- 7.Fredette BJ, Miller J, Ranscht B. Inhibition of motor axon growth by T-cadherin substrata. Development. 1996;122:3163–3171. doi: 10.1242/dev.122.10.3163. [DOI] [PubMed] [Google Scholar]
- 8.Ivanov D, Philippova M, Antropova J, Gubaeva F, Iljinskaya O, Tararak E, Bochkov V, Erne P, Resink T, Tkachuk V. Expression of cell adhesion molecule T-cadherin in the human vasculature. Histochem Cell Biol. 2001;115:231–242. doi: 10.1007/s004180100252. [DOI] [PubMed] [Google Scholar]
- 9.Ivanov D, Philippova M, Tkachuk V, Erne P, Resink T. Cell adhesion molecule T-cadherin regulates vascular cell adhesion, phenotype and motility. Exp Cell Res. 2004;293:207–218. doi: 10.1016/j.yexcr.2003.09.030. [DOI] [PubMed] [Google Scholar]
- 10.Kudrjashova E, Bashtrikov P, Bochkov V, Parfyonova Y, Tkachuk V, Antropova J, Iljinskaya O, Tararak E, Erne P, Ivanov D, Philippova M, Resink TJ. Expression of adhesion molecule T-cadherin is increased during neointima formation in experimental restenosis. Histochem Cell Biol. 2002;118:281–290. doi: 10.1007/s00418-002-0463-6. [DOI] [PubMed] [Google Scholar]
- 11.Takeuchi T, Ohtsuki Y. Recent progress in T-cadherin (CDH13, H-cadherin) research. Histol Histopathol. 2001;16:1287–1293. doi: 10.14670/HH-16.1287. [DOI] [PubMed] [Google Scholar]
- 12.Wyder L, Vitaliti A, Schneider H, Hebbard LW, Moritz DR, Wittmer M, Ajmo M, Klemenz R. Increased expression of H/T-cadherin in tumor-penetrating blood vessels. Cancer Res. 2000;60:4682–4688. [PubMed] [Google Scholar]
- 13.Ivanov D, Philippova M, Allenspach R, Erne P, Resink T. T-cadherin upregulation correlates with cell-cycle progression and promotes proliferation of vascular cells. Cardiovasc Res. 2004;64:132–143. doi: 10.1016/j.cardiores.2004.06.010. [DOI] [PubMed] [Google Scholar]
- 14.Bochkov VN, Tkachuk VA, Philippova MP, Stambolsky DV, Buhler FR, Resink TJ. Ligand selectivity of 105 kDa and 130 kDa lipoprotein-binding proteins in vascular-smooth-muscle-cell membranes is unique. Biochem J. 1996;317(1):297–304. doi: 10.1042/bj3170297. [DOI] [PMC free article] [PubMed] [Google Scholar]
- 15.Tkachuk VA, Kuzmenko YS, Resink TJ, Stambolsky DV, Bochkov VN. Atypical low density lipoprotein binding site that may mediate lipoprotein-induced signal transduction. Mol Pharmacol. 1994;46:1129–1137. [PubMed] [Google Scholar]
- 16.Tkachuk VA, Bochkov VN, Philippova MP, Stambolsky DV, Kuzmenko ES, Sidorova MV, Molokoedov AS, Spirov VG, Resink TJ. Identification of an atypical lipoprotein-binding protein from human aortic smooth muscle as T-cadherin. FEBS Lett. 1998;421:208–212. doi: 10.1016/s0014-5793(97)01562-7. [DOI] [PubMed] [Google Scholar]
- 17.Ross R. Cell biology of atherosclerosis. Annu Rev Physiol. 1995;57:1451–1455. doi: 10.1146/annurev.ph.57.030195.004043. [DOI] [PubMed] [Google Scholar]
- 18.Goldstein JL, Brown MS, Anderson RG, Russell DW, Schneider WJ. Receptor-mediated endocytosis: Concepts emerging from the LDL receptor system. Annu Rev Cell Biol. 1985;1:1–39. doi: 10.1146/annurev.cb.01.110185.000245. [DOI] [PubMed] [Google Scholar]
- 19.Philippova M, Ivanov D, Tkachuk V, Erne P, Resink TJ. Polarisation of T-cadherin to the leading edge of migrating vascular cells in vitro: A function in vascular cell motility? Histochem Cell Biol. 2003;120:353–360. doi: 10.1007/s00418-003-0584-6. [DOI] [PubMed] [Google Scholar]
- 20.Bochkov VN, Tkachuk VA, Kuzmenko YS, Borisova YL, Buhler FR, Resink TJ. Characteristics of low and high density lipoprotein binding and lipoprotein-induced signaling in quiescent human vascular smooth muscle cells. Mol Pharmacol. 1994;45:262–270. [PubMed] [Google Scholar]
- 21.Goldstein JL, Basu SK, Brown MS. Receptor mediated endocytosis of low density lipoproteins in cultured cells. Methods Enzymol. 1983;98:241–260. doi: 10.1016/0076-6879(83)98152-1. [DOI] [PubMed] [Google Scholar]
- 22.Grynkiewicz G, Poenie M, Tsien RY. A new generation of Ca2+ indicators with greatly improved fluorescence properties. J Biol Chem. 1985;260:3440–3450. [PubMed] [Google Scholar]
- 23.Mukhina S, Stepanova V, Traktouev D, Poliakov A, Beabealashvilly R, Gursky Y, Minashkin M, Shevelev A, Tkachuk V. The chemotactic action of urokinase on smooth muscle cells is dependent on its kringle domain. Characterization of interactions and contribution to chemotaxis. J Biol Chem. 2000;275:16450–16458. doi: 10.1074/jbc.M909080199. [DOI] [PubMed] [Google Scholar]
- 24.Uyama Y, Imaizumi Y, Watanabe M. Effects of cyclopiazonic acid, a novel Ca2+-ATPase inhibitor, on contractile responses in skinned ileal smooth muscle. Br J Pharmacol. 1992;106:208–214. doi: 10.1111/j.1476-5381.1992.tb14316.x. [DOI] [PMC free article] [PubMed] [Google Scholar]
- 25.Demaurex N, Lew DP, Krause KH. Cyclopiazonic acid depletes intracellular Ca2+ stores and activates an influx pathway for divalent cations in HL-60 cells. J Biol Chem. 1992;267:2318–2324. [PubMed] [Google Scholar]
- 26.Brown MS, Goldstein JL. A receptor-mediated pathway for cholesterol homeostasis. Science. 1986;232:34–47. doi: 10.1126/science.3513311. [DOI] [PubMed] [Google Scholar]
- 27.Block LH, Knorr M, Vogt E, Locher R, Vetter W, Groscurth P, Qiao B-Y, Pometta D, James R, Regenass M, Pletscher A. Low density lipoproteins causes general cellular activation with increased phosphatidylinositol turnover and lipoprotein catabolism. Proc Natl Acad Sci USA. 1988;85:885–889. doi: 10.1073/pnas.85.3.885. [DOI] [PMC free article] [PubMed] [Google Scholar]
- 28.Buhler FR, Tkachuk VA, Hahn AW, Resink TJ. Low and high density lipoproteins as hormonal regulators of platelet, vascular endothelial and smooth muscle cell interactions: Relevance to hypertension. J Hypertens. 1991;(Suppl 9):S28–S36. [PubMed] [Google Scholar]
- 29.Bochkov VN, Rozhkova TA, Matchin Yu G, Lyakishev AA, Bochkova NA, Borisova Yu L, Kukharchuk VV, Tkachuk VA. LDL and agonist-induced Ca2+-mobilization in platelets of healthy subjects and in patients with familial hyperlipoproteinemia type II. Thromb Res. 1991;61:403–409. doi: 10.1016/0049-3848(91)90654-f. [DOI] [PubMed] [Google Scholar]
- 30.Kelley JL, Rozek MM, Suenram CA, Schwartz CJ. Activation of human peripheral blood monocytes by lipoproteins. Am J Pathol. 1988;130:223–231. [PMC free article] [PubMed] [Google Scholar]
- 31.Voyno-Yasenetskaya TA, Dobbs LG, Erickson SK, Hamilton RL. Low density lipoprotein- and high density lipoprotein mediated signal transduction and exocytosis in alveolar type II cells. Proc Natl Acad Sci USA. 1993;90:4256–4260. doi: 10.1073/pnas.90.9.4256. [DOI] [PMC free article] [PubMed] [Google Scholar]
- 32.Resink TJ, Bochkov VN, Hahn AW, Philippova MP, Buhler FR, Tkachuk VA. Low and high-density lipoproteins as mitogenic factors for vascular smooth muscle cells: Individual, additive and synergistic effects. J Vasc Res. 1995;32:328–338. doi: 10.1159/000159107. [DOI] [PubMed] [Google Scholar]
- 33.Scott-Burden T, Resink TJ, Hahn AW, Baur U, Box RJ, Buhler FR. Induction of growth-related metabolism in human vascular smooth muscle cells by low density lipoprotein. J Biol Chem. 1989;264:12582–12589. [PubMed] [Google Scholar]
- 34.Sachinidis A, Mengden T, Locher R, Brunner C, Vetter W. Novel cellular activities for low density lipoprotein in vascular smooth muscle cells. Hypertension. 1990;15:704–711. doi: 10.1161/01.hyp.15.6.704. [DOI] [PubMed] [Google Scholar]
- 35.Knorr M, Locher R, Vogt E, Vetter W, Block LH, Ferracin F, Lefkovits H, Pletscher A. Rapid activation of human platelets by low concentrations of low-density lipoprotein via phosphatidylinositol cycle. Eur J Biochem. 1988;172:753–759. doi: 10.1111/j.1432-1033.1988.tb13953.x. [DOI] [PubMed] [Google Scholar]
- 36.Bochkov V, Tkachuk V, Buhler F, Resink T. Phosphoinositide and calcium signalling responses in smooth muscle cells: Comparison between lipoproteins, Ang II, and PDGF. Biochem Biophys Res Commun. 1992;188:1295–1304. doi: 10.1016/0006-291x(92)91372-w. [DOI] [PubMed] [Google Scholar]
- 37.Kuzmenko YS, Bochkov VN, Philippova MP, Tkachuk VA, Resink TJ. Characterization of an atypical lipoprotein-binding protein in human aortic media membranes by ligand blotting. Biochem J. 1994;303:281–287. doi: 10.1042/bj3030281. [DOI] [PMC free article] [PubMed] [Google Scholar]
- 38.Stambolsky DV, Kuzmenko YS, Philippova MP, Bochkov VN, Bespalova ZD, Azmuko AA, Kashirina NM, Vlasik TN, Tkachuk VA, Resink TJ. Identification of 130 kDa cell surface LDL-binding protein from smooth muscle cells as a partially processed T-cadherin precursor. Biochim Biophys Acta. 1999;1416:155–160. doi: 10.1016/s0005-2736(98)00218-1. [DOI] [PubMed] [Google Scholar]
- 39.Resink TJ, Kuzmenko YS, Kern F, Stambolsky D, Bochkov VN, Tkachuk VA, Erne P, Niermann T. LDL binds to surface-expressed human T-cadherin in transfected HEK293 cells and influences homophilic adhesive interactions. FEBS Lett. 1999;463:29–34. doi: 10.1016/s0014-5793(99)01594-x. [DOI] [PubMed] [Google Scholar]
- 40.Niermann T, Kern F, Erne P, Resink T. The glycosyl phosphatidylinositol anchor of human T-cadherin binds lipoproteins. Biochem Biophys Res Commun. 2000;276:1240–1247. doi: 10.1006/bbrc.2000.3465. [DOI] [PubMed] [Google Scholar]
- 41.Berridge MJ, Bootman MD, Roderick HL. Calcium signalling: Dynamics, homeostasis and remodelling. Nat Rev Mol Cell Biol. 2003;4:517–529. doi: 10.1038/nrm1155. [DOI] [PubMed] [Google Scholar]
- 42.Koller E, Ranscht B. Differential targeting of T- and N-cadherin in polarized epithelial cells. J Biol Chem. 1996;271:30061–30067. doi: 10.1074/jbc.271.47.30061. [DOI] [PubMed] [Google Scholar]
- 43.Philippova MP, Bochkov VN, Stambolsky DV, Tkachuk VA, Resink TJ. T-cadherin and signal-transducing molecules co-localize in caveolin-rich membrane domains of vascular smooth muscle cells. FEBS Lett. 1998;429:207–210. doi: 10.1016/s0014-5793(98)00598-5. [DOI] [PubMed] [Google Scholar]
- 44.Cebecauer M, Cerny J, Horejsi V. Incorporation of leucocyte GPI-anchored proteins and protein tyrosine kinases into lipid-rich membrane domains of COS-7 cells. Biochem Biophys Res Commun. 1998;243:706–710. doi: 10.1006/bbrc.1998.8149. [DOI] [PubMed] [Google Scholar]
- 45.Hiscox S, Hallett MB, Morgan BP, van den Berg CW. GPI-anchored GFP signals Ca2+ but is homogeneously distributed on the cell surface. Biochem Biophys Res Commun. 2002;293:714–721. doi: 10.1016/S0006-291X(02)00280-2. [DOI] [PubMed] [Google Scholar]