

Abstract
The retinoid cycle is a recycling system that replenishes the 11-cis-retinal chromophore of rhodopsin and cone pigments. Photoreceptor-specific retinol dehydrogenase (prRDH) catalyzes reduction of all-trans-retinal to all-trans-retinol and is thought to be a key enzyme in the retinoid cycle. We disrupted mouse prRDH (human gene symbol RDH8) gene expression by targeted recombination and generated a homozygous prRDH knock-out (prRDH−/−) mouse. Histological analysis and electron microscopy of retinas from 6- to 8-week-old prRDH−/− mice revealed no structural differences of the photoreceptors or inner retina. For brief light exposure, absence of prRDH did not affect the rate of 11-cis-retinal regeneration or the decay of Meta II, the activated form of rhodopsin. Absence of prRDH, however, caused significant accumulation of all-trans-retinal following exposure to bright lights and delayed recovery of rod function as measured by electroretinograms and single cell recordings. Retention of all-trans-retinal resulted in slight overproduction of A2E, a condensation product of all-trans-retinal and phosphatidylethanolamine. We conclude that prRDH is an enzyme that catalyzes reduction of all-trans-retinal in the rod outer segment, most noticeably at higher light intensities and prolonged illumination, but is not an essential enzyme of the retinoid cycle.
Reduction and oxidation of retinoids are key reactions of the retinoid cycle (visual cycle), which is critical for the production of the chromophore of rhodopsin, 11-cis-retinal (1, 2). When light strikes the visual pigments (rhodopsin and cone opsins) in photoreceptors, it causes the 11-cis-retinylidene chromophore to isomerize to its all-trans configuration, before all-trans-retinal is released from the binding site of the pigments (3) (see Scheme 1). The NADPH-dependent reduction of all-trans-retinal in photoreceptor outer segments is the first step in the regeneration of bleached visual pigment. The reduction occurs directly on the cytoplasmic surface of outer segment disk membranes. Once all-trans-retinal escapes into the internal disk space, it is pumped out to the cytosol by a photoreceptor-specific ATP-binding transporter (4–8). Several all-trans-retinol dehydrogenases (RDHs)1 from the photoreceptor cells have been identified. First, Haeseleer et al. (9) cloned a cone-specific enzyme from the short-chain dehydrogenase/reductase (SDR) family with properties that suggest participation in the retinoid cycle. Next, Rattner and colleagues (10) reported the identification of a novel member of the SDR family, photoreceptor RDH (prRDH or RDH8), that localized to photoreceptors and possessed enzymatic properties closely matching those previously reported for RDH activity in ROS. The authors suggested that prRDH is the enzyme responsible for the reduction of all-trans-retinal to all-trans-retinol within the photoreceptor outer segment. The sequence homology among SDRs is typically low (20–40%), but the structural homology is high and most protein folds are conserved (11). prRDH shows significant homology (48% identity) with 17-hydroxysteroid dehydrogenase type 1 (10) but displays low sequence similarity to other SDRs. Interestingly, some SDRs have a dual-specificity, catalyzing oxidation/reduction of retinoids and steroids (12). More recently, Haeseleer et al. (13) identified several RDH genes expressed in the eye, with RDH12 being present in photoreceptor cells. RDH12 appears to be the key enzyme involved in visual processes, because null mutants in this gene lead to an early-onset rod/cone dystrophy termed Leber congenital amaurosis (14, 15). Thus, the role of prRDH and retinal SDR1, in the light of pathogenic RDH12 mutations, is unclear. No mutations that are associated with retinal diseases were reported for prRDH or retSDR1 genes (see Refs. 16 and 17).
Scheme 1. Release of all-trans-retinal from opsin and its reduction in the vertebrate retina.

In the rod outer segment (ROS), light causes the isomerization (reaction a) of the rhodopsin chromophore, 11-cis-retinylidene (1), to all-trans-retinylidene. All-trans-retinal (2) is hydrolyzed and then reduced (reaction b) in the reaction catalyzed by all-trans-retinal-specific RDH(s), including prRDH. All-trans-retinol (3) diffuses to RPE, where it is esterified by lecithin:retinol acyl transferase to all-trans-retinyl esters and stored in subcellular structures called retinosomes.
RDHs have other important roles in photoreceptor physiology. The activity of all-trans-RDH tightly controls the level of all-trans-retinal in the retina, because all-trans-retinal and ethanolamine can form N-retinylidene-N-retinylethanolamine (A2E), a fluorescent constituent of lipofuscin that accumulates in the RPE during aging and might be a culprit of age-related macular degeneration (18–20). A2E consists of two molecules of all-trans-retinal and one of ethanolamine, molecular components of the photoreceptor outer membrane. Thus, A2E should accumulate in vivo when the all-trans-retinal is not cleared efficiently. Indeed, in an Abcr−/− mouse model of Stargardt’s disease, A2E accumulated to levels more than 20 times greater than those observed in WT mice (21). All-trans-retinal might form complexes with opsins that activate G protein persistently and cause desensitization of photoreceptor cells (22–26) (reviewed in Ref. 27). Thus, the mechanism of all-trans-retinal clearance is very important to the physiology of the visual processes and the pathologies of the retina.
Here, we report on the generation of prRDH knock-out mice and characterize how disruption of the prRDH gene affects phototransduction and A2E formation. Our data support an auxiliary role for this enzyme in the retinoid cycle and reveal new evidence for an alternative RDH(s) that produces all-trans-retinol from all-trans-retinal in photoreceptor outer segments released from photoactivated rhodopsin and compensates for the lack of prRDH.
MATERIALS AND METHODS
Animals
All animal experiments employed procedures approved by the University of Washington and University of Utah Animal Care Committees and conformed to recommendations of the American Veterinary Medical Association Panel on Euthanasia and recommendations of the Association of Research for Vision and Ophthalmology. Animals were maintained in complete darkness or on a 12-h light and 12-h dark cycle. All manipulations were done under dim red or infrared light (biochemistry: >560 nm; single cell recordings: >950 nm). Most experiments used 6- to 12-week-old mice.
Construction of Targeting Vector and Generation of prRDH−/−Mice
Partial prRDH cDNA sequences covering exons 2 and 3 were amplified from mouse (λunizapII) and human (λgt10) retina cDNA libraries using primers RDH1 (5′-ACCAGGTCGTGGCCACCATG) and RDH4 (5′-GTTGAAGATGACACCCTGCAGGCC). A complete mouse prRDH cDNA coding sequence was derived from fragments using RDH1/T3 and RDH4/T7 amplified from the mouse retina library. The mouse prRDH gene was originally derived in silico from a contig (accession number AC073775) that contained the entire prRDH gene. The prRDH knock-out construct was prepared as follows: A BAC clone (BAC#25802) was identified by PCR screening of a mouse 129SvJ library, and its identity was confirmed by PCR using primers amplifying all exons. The 25802 BAC clone was digested with EcoRI to generate a 11.7-kb EcoRI fragment containing 5′-UTR sequences and exons 1–4, and with BamHI to generate an overlapping 11-kb fragment containing exons 2–6 and 3′-untranslated region sequences. The fragments were mapped by restriction digests and direct sequencing and shown to span 19.4 kb. Both fragments were subcloned into the pZERO2 vector. The 11.7-kb EcoRI fragment was digested with SacI to generate a 5.3-kb fragment (long arm) containing exon 1 and 5′ upstream sequences. To generate the 3′-short arm, the 11.7-kb BamHI fragment containing exons 2–6 was digested with EcoRI and XhoI to generate a 3.8-kb EcoRI/XhoI fragment containing exons 5 and 6. The long arm was cloned into the 5′ multiple cloning site, and the short arm into the EcoRI/XhoI 3′-multiple cloning site of 38loxPNeo, generating the targeting vector (Fig. 1) in which exons 2–4 of prRDH were deleted. An embryonic stem cell line was established by transfecting 192 ES stem cell cultures with the targeting vector. Purified DNA from the cell lines was digested with EcoRI (upstream probe) and BamHI (downstream probe). The EcoRI digest was probed with an upstream 11.4-kb EcoRI/XbaI fragment to generate diagnostic fragments of 11.7 kb (WT allele) and 9.8 kb (knock-out allele). The BamHI digest was probed with a 2.3-kb BamHI/XhoI fragment of the short arm to generate diagnostic fragments of 11.6 kb (WT) and 8.5 kb (knock-out). Two clones (#319 and #372) were obtained showing the expected WT and knock-out fragments. Both were expanded for transfection into blastocysts. A chimeric mouse was generated by the knock-out facility at the University of Utah using line #372. The chimeric mouse was outbred by standard procedures into the C57BL/6J strain (Jackson, Bar Harbor, ME) for pigmented mice or the BALB/c strain for albino mice to generate prRDH+/− and prRDH−/− mice.
Fig. 1. The mouse prRDH gene, the targeting construct, and expression.
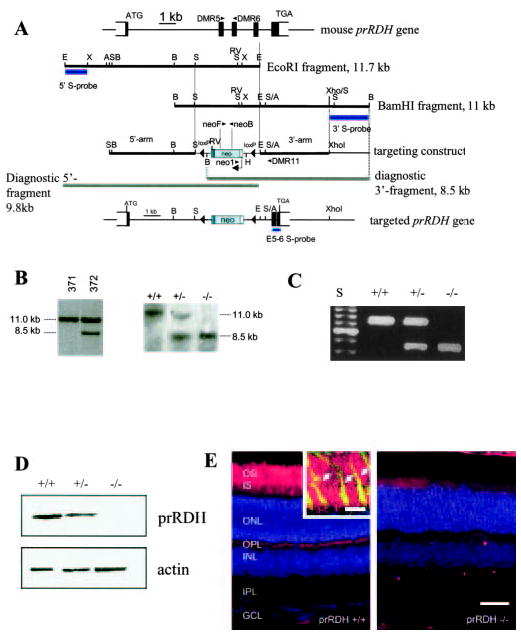
A, mouse prRDH gene structure, targeting construct, and targeted gene in which exons 2–4 have been deleted. The position of WT primers DMR5 and DMR6 in exons 2 and 3, respectively, is indicated. The 11.7-kb EcoRI fragment was used for cloning of the 5′-long arm, and the 11-kb BamHI fragment for cloning of the 3′-short arm. Bars underneath the genomic fragments indicate probes used for Southern blotting of ES cell line candidates. In the targeting construct, a fragment containing exons 2–4 was replaced by a neo cassette flanked by loxP sites. The extent of fragments representing the null allele is shown underneath the targeting construct. Bottom, schematic of the targeted prRDH gene. A, Acc65i; B, BamHI; E, EcoRI, H, HindIII; RV, EcoRV; S, SacI; X, XbaI; and XH, XhoI cleavage sites. In B: Left panel, Southern blot of BamHI-digested DNA of two ES cell lines hybridized with the 3′-probe; #371, negative cell line (no recombination); #372, positive clone showing the 11-kb WT allele and the 8.5-kb null allele. This line was used to generate the prRDH−/− mouse. Right panel, Southern blot with BamHI-digested DNA from SvJ WT, prRDH+/−, and prRDH−/− mice. The probe (E5–6 S-probe) was a 350-bp genomic fragment containing exon 5, intron 5, and exon 6 (see “Materials and Methods”). C, genotyping of prRDH+/+, prRDH+/−, and prRDH−/− mouse lines. The WT fragment was generated by PCR with DMR5 and DMR6 primers. The fragment corresponding to knock-out allele was generated by amplification with neo1 and DMR11 primers. Internal neo primers neoF and neoB (inside the coding sequence of neomycin phosphorylase) were used occasionally as an alternate primer pair. D, immunoblotting of proteins from the ROS extract from prRDH+/+ and prRDH−/− mice. The blot was developed using anti-prRDH polyclonal antibody generated against the C-terminal peptide derived from the prRDH sequence (“Materials and Methods”). The equal loading of the sample was verified by immunoblotting with anti-actin polyclonal antibody. E, immunocytochemical localization of prRDH (red) in mouse rod and cone outer segments. Eight-week-old frozen sections were probed with the polyclonal anti-prRDH antibody, generated as described under “Materials and Methods.” The specific response is present in the photoreceptors in the eye of prRDH+/+ mice and not in prRDH−/− mice. Scale bar, 50 μm. The nuclear layers were stained with Hoechst 33342 (Molecular Probes, Eugene, OR) dye. Inset, higher magnification of the photoreceptor outer segment layer. Anti-prRDH (red) is immunoreactive to both rod and cones (arrows). Cone sheaths (green) are labeled by fluorescein labeled PNA (peanut agglutinin). Yellow indicates colocalization. Scale bar, 10 μm.
PCR Genotyping prRDH+/+, prRDH+/−, and prRDH−/− Mice
To identify the WT allele, primer pairs DMR5 (exon 2, 5′-GAAG-GAGCCATTGGAGGCAGCTGC-3′) and DMR6 (exon 3, 5′-CTGGAAG-CACAGCTTTGACCAGAC-3′) producing an 800-bp amplicon were used. The knock-out allele was identified with DMR11 (5′-TCCGCCT-TGGAAACCTGAGCCAGAAG-3′) and Neo-1 (5′-TGCGAGGCCAGAG-GCCACTTGTGTAGC-3′) producing a 450-bp amplicon. In several instances, we also used neoF (5′-ACA ACA GAC AAT CGG CTG C) and neoB (5′-GCT CTT CGT CCA GAT CAT CC) for verification of the presence of the neo cassette. The PCR conditions were 94 °C for 30 s, 65 °C for 30 s, then 72 °C for 90 s; a total of 35 cycles was used.
Southern Blotting
For Southern blot identification of wild-type and mutant mice, tail DNA from prRDH+/+, prRDH+/−, and prRDH−/− was digested with BamHI, separated on a 0.75% agarose gel, and transferred to nitrocellulose using standard procedures. For hybridization, a 350-bp probe (E5–6 S-blot in Fig. 1A) containing part of exon 5, intron 5, and part of exon 6 was amplified with sense primer mRDHE5-F (5′-CATCTCAATGGTGGAGCCAGGCCC) and antisense primer mRDH E5-R (5′-GTTCTGCTCTGTTTGTCTAGGCCACACAC), using wild-type mouse genomic DNA as a template. The amplification was performed using 30 cycles of 94 °C for 20 s, 69 °C for 20 s, and 72 °C for 1 min. The amplicon was purified using a Qiagen gel extraction kit. 75 ng of the purified DNA was labeled using a random primer labeling kit (Roche Applied Science). The denatured probe was added to the blot with 20 ml of Express Hyb hybridization solution (BD Biosciences Clontech) and incubated overnight at 68 °C. The blot was washed three times in 1% SDS, 1× SSC for 1 h. The blot was then exposed on BioMax film (Eastman Kodak) with an intensifier screen over 72 h.
Bacterial Expression, Sf9 Cell Expression of Mouse prRDH, and Anti-prRDH Antibody Production
Mouse retina RNA was isolated using the MicroAqueous RNA Isolation Kit (Ambion Inc., Austin, TX). prRDH cDNA was amplified using Herculase Polymerase (Stratagene, La Jolla, CA) using the primers 5′-GGATCCATGGCCTCTCAG-CAGCGGAC-3′ and 5′-CTCGAGTCAGTTCTGCTCTGTTTGTCTA-3′. Full-length prRDH coding region was cloned downstream of His6 into the baculovirus expression vector through BamHI and XhoI and transfected to Sf9 cells. The C-terminal of prRDH (150–317 residues) was cloned downstream of His6 into bacteria expression vector pET30b through EcoRI and XhoI and expressed in BL21(DE3) by 0.25 mm isopropyl 1-thio-β-d-galactopyranoside induction. The His6-tagged mouse prRDH protein was purified by Ni2+-nitrilotriacetic acid affinity chromatography using the manufacturer’s protocol (Qiagen, Valencia, CA). The purified protein was examined by gel electrophoresis. After in-gel trypsin digestion, the eluted tryptic peptides were microsequenced by liquid chromatography-mass spectrometry to verify the identity of the recombinant prRDH. The purified C-terminal fusion protein from Escherichia coli and the C-terminal 16-amino acid-long peptide (CGCLPTRVWPRQTEQN) conjugated with keyhole limpet hemocyanin (Pierce) were used to immunize mice as described previously (28). The polyclonal antibody was tested for its specificity by immunocytochemical testing of the prRDH+/+ and prRDH−/− mouse retinas.
Immunoblot
SDS-PAGE was performed using 12.5% polyacrylamide gels (29), and DNA was electrophoretically transferred onto Immobilon-P (Millipore, Bedford, MA). The membrane was blocked with 3% bovine serum albumin in 10 mm phosphate (pH 7.5) containing 100 mm NaCl and incubated for 3 h with anti-prRDH antibody (Ab). A secondary Ab conjugated with alkaline phosphatase (Promega, Madison, WI) was used at a dilution of 1:5,000. Ab binding was detected by incubation with nitro blue tetrazolium/5-bromo-4-chloro-3-indolyl phosphate (Promega). When peroxidase-conjugated secondary Ab (Sigma) was employed at a dilution of 1:10,000, Ab binding was detected with the ECL system (Amersham Biosciences).
Light Microscopy
For light microscopy, eyecups were fixed in 2% glutaraldehyde, 2% paraformaldehyde for 18 h, infiltrated with 20% sucrose in 0.1 m sodium phosphate, pH 7.4, and then embedded in a 33% optimal cutting temperature compound (Miles, Laboratories, Elkhart, IN) diluted with 20% sucrose in 0.1 m sodium phosphate, pH 7.4. Thin sections were cut at 5 μm and subjected to light microscopy.
Immunocytochemistry
All procedures have been described previously (13). Sections were analyzed under an epifluorescence microscope (Nikon, Tokyo, Japan). Digital images were captured with a digital camera (ORCA-ER, Hamamatsu Photonics, Bridgewater, NJ). High magnification images (Fig. 1E, inset) were captured by a Zeiss LSM 510 NLO confocal microscope.
Transmission EM
For transmission EM, mouse eyecups were fixed primarily by immersion in 2.5% glutaraldehyde, 1.6% paraformaldehyde in 0.08 m PIPES, pH 7.4, containing 2% sucrose, initially at room temperature for ~1 h, then at 4 °C for the remainder of 24 h. The eyecups were then washed with 0.13 m sodium phosphate, pH 7.3, and secondarily fixed with 1% OsO4 in 0.1 m sodium phosphate, pH 7.4, for 1 h at room temperature. The eyecups were dehydrated through a CH3OH series and transitioned to the epoxy embedding medium with propylene oxide. The eyecups were embedded for sectioning in Eponate 812. Ultrathin sections (60 –70 nm) were stained with aqueous saturated uranium acetate and Reynold’s formula lead citrate prior to survey and micrography with a Philips CM10 electron microscope.
Rhodopsin Measurements
All procedures were performed under dim red light as described previously (30). Typically, two mouse eyes were used per rhodopsin measurement. Mouse eyes were enucleated and rinsed with double distilled H2O. The lenses were removed, and the eyes were cut into three or four pieces and frozen immediately on a dry ice/ethanol bath. Rhodopsin was extracted with 0.9 ml of 20 mm BisTris propane, pH 7.5, containing 10 mm DM and 5 mm freshly neutralized NH2OH-HCl. The sample was homogenized with a Dounce tissue homogenizer and shaken for 5 min at room temperature. The sample was then centrifuged at 14,000 rpm for 5 min at room temperature. The supernatant was collected, and the pellet was extracted one more time. The combined supernatants were centrifuged at 50,000 rpm for 10 min, and absorption spectra were recorded before and after a 12-min bleach (60-watt incandescent bulb). The concentration of rhodopsin was determined by the decrease in absorption at 500 nm using the molar extinction coefficient ɛ = 42,000 m−1 cm−1.
Preparation of Mouse ROS
Twelve mouse retinas were placed in a tube with 200 μl of 8% OptiPrep (Nycomed, Oslo, Norway) in Ringer’s buffer (130 mm NaCl, 3.6 mm KCl, 2.4 mm MgCl2, 1.2 mm CaCl2, 10 mm Hepes, pH 7.4, containing 0.02 mm EDTA) and vortexed for 1 min. The samples were centrifuged at 200 × g for 1 min, and the supernatant containing the ROS was removed gently. The pellet was dissolved in 200 μl of 8% OptiPrep, vortexed, and centrifuged again. The vortexing and sedimentation sequence was repeated ten times. The collected ROS supernatants (~2 ml) were combined, overlaid on a 10–30% continuous gradient of OptiPrep in Ringer’s buffer, and centrifuged for 50 min at 26,500 × g. ROS were harvested as a second band (about two-thirds of the way from the top), diluted three times with Ringer’s buffer, and centrifuged for 3 min at 500 × g to remove the cell nuclei. The supernatant containing ROS was transferred to a new tube and centrifuged for 30 min at 26,500 × g. The pelleted material contained pure, osmotically intact ROS.
RDH Assays
Activities of Sf9 cell membrane-expressed prRDH and ROS of prRDH−/− and prRDH+/+ mice were assayed by monitoring the production of all-trans-retinol (reduction of all-trans-retinal) (31). The reduction reaction mixture (100 μl) contained MES (final concentrations, 62–66 mm, pH 5.5), dithiothreitol (1 mm), prRDH+/+ (5 μg), or prRDH−/− (5 μg) mice ROS in the presence or absence of NAD(P)H (1 mm), and 20 μm all-trans-retinal substrate stock, added last to initiate the reaction. For the endogenous assay, ROS (5 μg) was bleached at 70% with an electronic flash. The reaction was incubated at 37 °C for 15 min or as indicated in the figure, and then terminated with 400 μl of of hexane two times. The hexane CH3OH and extracted with 500 μl solution was analyzed by HPLC using 10% ethyl acetate in hexane to confirm the production of the corresponding retinol.
HPLC Analysis of Retinoids
All experimental procedures related to extraction, derivatization, and separation of retinoids from dissected mouse eyes were carried out as described previously (32–35). All reactions involving retinoids were carried out under dim red light. Retinoids were separated by normal phase HPLC (Ultrasphere-Si, 4.6 μm, 250 mm, Beckman, Fullerton, CA) with 10% ethyl acetate and 90% hexane at a flow rate of 1.4 ml/min with detection at 325 nm using an HP1100 HPLC with a diode array detector and HP Chemstation A.03.03 software.
ERGs
Prior to recording, mice were dark-adapted for 48 h. Under safety light, mice were anesthetized by intraperitoneal injection using 20 μl/g body weight of 6 mg/ml ketamine and 0.44 mg/ml xylazine diluted with 10 mm sodium phosphate (pH 7.2) containing 100 mm NaCl. The pupils were dilated with 1% tropicamide. A contact lens electrode was placed on the eye, and a reference electrode and ground electrode were placed in the ear and on the tail. ERGs were recorded with the universal testing and electrophysiological system UTAS E-3000 (LKC Technologies, Inc., Gaithersburg, MD).
For single-flash ERG recording, flash stimuli had a range of intensities (−3.7 to 2.8 log cd·s·m−2), and white light flash duration was adjusted according to intensity (from 20 μs to 1 ms). Three to five recordings were made with >10-s intervals, and for higher intensity intervals, intervals were 10 min or as indicated. There were no significant differences between the first and the fifth flash. Light-adapted responses were examined after bleaching at 1.4 log cd·m−2 for 15 min. Typically, four to eight animals were used for the recording of each point in all conditions. Leading edges of the ERG responses were fitted with a model of rod photoreceptor activation (36) as previously described (32). Statistical analysis was carried out using the one-way analysis of variance test.
Recovery of dark adaptation was investigated as previously published (37). Briefly, dark-adapted mice were bleached with the background light of a Ganzfeld chamber (500 cd·m−2) for 3 min. After bleach, a single-flash ERG at −0.2 cd·s·m−2 was used to monitor recovery of a-wave amplitude every 5 min for 60 min in the dark condition. The recovery ratio was calculated by normalizing single flash a-wave amplitude responses at various times following bleaching to the dark-adapted a-wave response at the identical flash intensity of −0.2 cd·s·m−2. The recovery ratio versus time after bleaching was plotted in Sigma Plot 2002 version 8.02. The results were examined using the one-way analysis of variance test.
Recordings from Photoreceptor Cells
Suction electrode recordings from rod photoreceptors followed published procedures (38, 39). C57BL/6J mice were used as controls. Rod responses were each measured from four mice that were dark-adapted for at least 12 h. Photon densities measured at the preparation were converted to photoisomerizations per rod (photoactivated rhodopsin/rod) assuming a collecting area of 0.5 μm2 (40). All experiments were conducted at 35–37 °C.
Rates of Meta II Decay
All measurements were performed with 0.1 nm rhodopsin in a Ringer’s buffer (130 mm NaCl, 3.6 mm KCl, 2.4 mm MgCl2, 1.2 mm CaCl2, 10 mm Hepes, pH 7.4, containing 0.02 mm EDTA). A PerkinElmer Life Sciences LS 50B luminescence spectrophotometer was used to measure the increase in intrinsic Trp fluorescence due to hydrolysis of the protonated Schiff base and release of all-trans-retinal from rhodopsin (24, 41, 42). ROS was bleached by a Fiber-Lite illuminator for 15 s from a distance of 15 cm, immediately followed by fluorescence measurements. A thermostat was applied to stabilize the temperature of the cuvette at 20 °C during the measurement. Fluorometer slit settings were 2.5 μm at 295 nm for excitation, and 8 μm at 330 nm for emission, respectively.
Mouse A2E Analysis
Two whole mouse eyes were homogenized in 0.5 ml of 100 mm phosphate buffer, pH 7.0, with a glass-glass homogenizer. After adding 0.5 ml of CH3OH the eyes were again homogenized. A2E was extracted twice with 0.5 ml of CHCl3, dried with anhydrous MgSO4, and concentrated on the SpeedVac. The residue was redissolved in 150 μl of CH3OH, and 100 μl was analyzed by reverse phase HPLC using a C18 column (4.6 × 250 mm 5μ, Agilent Technologies) developed using CH2Cl2:CH3OH (1:1) with the addition of 0.1% trifluoroacetic acid as solvent. Quantification of A2E was performed with a known concentration of pure synthetic A2E prepared as described previously (18).
Radioactive A2E Preparation
11,12-Di-[3H]all-trans-retinol was purchased from ARC, Inc. (St. Louis, MO) and had specific radioactivity of 44.5 Ci/mmol. One hundred microliters of the stock solution was mixed with 1 ml of anhydrous CH2Cl2, 0.8 mg of [3H]all-trans-retinol, and 5 mg of MnO2 (20 times excess), stirred for 24 h at room temperature, and centrifuged. CH2Cl2 was evaporated, and [3H]all-trans-retinal was extracted twice with hexane (100 μl each), concentrated under vacuum, mixed with 1 ml of absolute ethanol and 0.08 mg of ethanolamine in 100 μl of ethanol and 0.08 mg of acetic acid in 100 μl of ethanol. The reaction mixture was left at room temperature for 3 days, after which iso-[3H]A2E was purified by reverse phase chromatography as described above. [3H]A2E could not be purified because it eluted together with a compound absorbing at 445 nm. Iso-[3H]A2E was then isomerized to [3H]A2E under regular fluorescent light for 3 h, and concentrated in a vacuum to a final volume of 1.5 ml. To calculate the extraction yield of A2E, eyes were homogenized with the addition of 100 μl of the [3H]A2E (~40,000 cpm). A2E was separated using HPLC analysis as described above. Peaks corresponding to A2E were collected, and radioactivity was measured on a liquid scintillation counter. Calculated yield for the extraction was 41.5%. For mouse analysis, the amounts of A2E were corrected using this coefficient.
Visualization of Lipofuscin by Confocal Microscopy
Imaging was performed using a Zeiss LSM 510 NLO confocal microscope (Carl Zeiss, Thornwood, NY) with LSM510 software 3.0 as described previously (43). A2E (green) was visualized by collecting emissions at >560 nm by excitation at 488 nm. Laser light was focused through the sclera on the RPE by a Plan-Neofluar 40×/1.3 numerical aperture objective lens, and the signal was collected by a descanned detector in the LSM510 confocal module (Carl Zeiss).
RESULTS
Mouse prRDH Gene and Targeting Construct
We cloned the mouse prRDH cDNA by PCR from mouse retina cDNA libraries, and derived the gene structure originally in silico (contig accession number AC073775, 214 kb in length, containing the contiguous mouse prRDH gene). The prRDH gene appears to be present as a single copy in the mouse and human genome. The mouse (chromosome 9) and human (chromosome 19p13.2-p13.3) genes consist of six exons (Fig. 1A) spanning ~8 kb of genomic DNA. The human prRDH gene has been screened for pathogenic mutations in retinitis pigmentosa patients, but only polymorphisms were identified (16).
To delineate the role of prRDH (RDH8) in the retinoid cycle, we generated a knock-out mouse in which exons 2–4 of the mouse prRDH gene were deleted by targeted recombination. A BAC clone containing the entire prRDH gene was isolated, and overlapping genomic fragments were used to construct a targeting vector in which exons 2–4 were deleted (Fig. 1A). From one (#372, Fig. 1B) of two identified positive ES cell lines we obtained one chimeric mouse that transmitted the knock-out allele to offspring. To genotype the knock-out mice, the WT allele was identified using the primer pair DMR5 and DMR6 (located in exons 2 and 3, which are deleted in the knock-out mouse, yielding a diagnostic fragment ~800 bp), and the knock-out gene was identified using DMR11 (in exon 5) and Neo1 (located in the coding sequence of neomycin phosphorylase, 450-bp fragment) (Fig. 1C). The identities of the PCR products were verified by direct sequencing. The expression of prRDH was abolished in the eye of prRDH−/− mice, as determined by immunoblotting (Fig. 1D). Disruption of gene expression was also confirmed by immunocytochemistry, which showed that the staining was abolished in ROS and cone outer segments (Fig. 1E). The specificity of the antibody was verified by using bacterially or Sf9-expressed prRDH protein (data not shown). The male and female prRDH−/− mice were fertile, developed normally, and reached similar body weights.
Histology and Ultrastructure of the Retina from prRDH−/− Mice
At 6–8 weeks of age, light microscopy revealed no major abnormalities in the retinas of prRDH−/− mice. The ROS were similar in length in prRDH−/− and prRDH+/+ mice (Fig. 2A and B, n = 3). The thickness of each major layer in the retina was also similar in the two genetic strains (Fig. 2, C and D). Retinas of prRDH+/− and prRDH+/+ mice were indistinguishable by light microscopy (data not shown). EM analysis of the outer retina and RPE layer revealed no gross differences between prRDH−/−, prRDH+/−, and prRDH+/+ mice (Fig. 3, A–C). Higher resolution at the interface between the RPE and ROS showed normal structures (Fig. 3, D–F). Older, 8-month-old prRDH−/− mice showed no sign of degeneration (data not shown).
Fig. 2. Retina histology of prRDH−/− and prRDH+/+ mice.
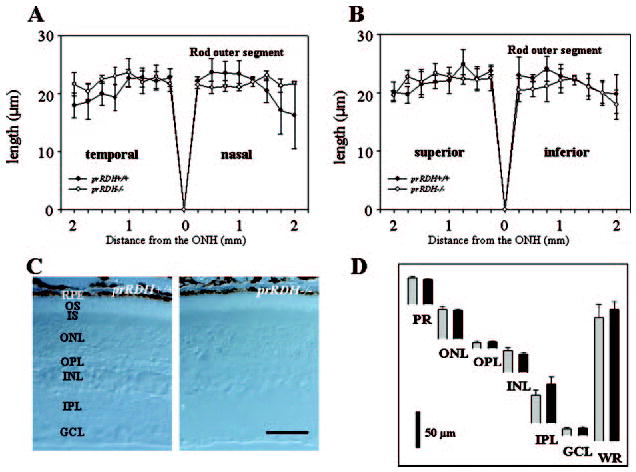
A and B, ROS thickness (in microns) plotted as a function of the retinal location (in millimeters) from the optic nerve head. The age of mice was 8 –10 postnatal weeks. Open circles, prRDH−/−; closed circles, prRDH+/+. C, a representative cross-section (Nomarsky optics) of the retina from prRDH+/+ and prRDH−/− mice. D, quantification of the thickness of different layers of the retina from prRDH+/+ (black bars) and prRDH−/− mice (gray bars) measured at 1.25 mm superior to the optic nerve head. Error bars indicate the standard error of the mean (n > 3). RPE, retinal pigment epithelium; OS, outer segment; IS, inner segment; ONL, outer nuclear layer; OPL, outer plexiform layer; INL, inner nuclear layer; IPL, inner plexiform layer; GCL, ganglion cell layer; and WR, whole retina.
Fig. 3. Montage of cross-section of the retinas of 2-month-old mice analyzed by transmission EM.

Upper panels (A–C) show the cross-section of the RPE and the photoreceptor cells. Lower panels (D–F) show a higher magnification of the RPE and ROS. The sections were prepared as described under “Materials and Methods.” The scale bar represents 10 μm.
Retinoid Analysis from prRDH−/− Mouse Eyes
Retinoids were identified and quantified using HPLC (see “Materials and Methods”). All mice were raised in the dark to eliminate interference from background light on the isomeric composition of retinoids. Retinoids were identified by co-elution with authentic retinoids and on-line UV spectroscopy. The amount of 11-cis-retinal in retinas from prRDH+/+, prRDH+/−, and prRDH−/− mice was not significantly different (Table I) and was similar to that from mice of other genetic backgrounds studied previously (34, 44, 45). Rhodopsin levels in prRDH+/+ and prRDH−/− were also not significantly different and were similar to 11-cis-retinal levels (Table I). Other retinoids, including retinyl esters, were comparable for all genetic backgrounds (Table I).
Table I. Rhodopsin and retinoid contents in dark-adapted mice from different genetic backgrounds.
Mice were dark-adapted for more than 48 h. The results are presented with standard error, and n was between 3 and 5. Rhodopsin and retinoids were measured as described under “Materials and Methods.”
| prRDH+/+ | prRDH+/− | prRDH−/− | |
|---|---|---|---|
| pmol/eye | |||
| Rhodopsin | 468.7 ± 55.6 | NDa | 448.4 ± 84.7 |
| Retinoid | |||
| Dark-adapted | |||
| All-trans-retinyl esters | 79.6 ± 5.8 | 86.8 ± 3.2 | 61.1 ± 6.4 |
| 11-cis-Retinal | 529.6 ± 21.1 | 501.8 ± 17.4 | 514.8 ± 16.3 |
| All-trans-retinal | 64.3 ± 7.6 | 76.5 ± 11.0 | 62.7 ± 19.4 |
| All-trans-retinol | 4.6 ± 1.7 | 5.2 ± 1.6 | 7.9 ± 1.6 |
| 11-cis-Retinol | 23.5 ± 16.3 | 14.8 ± 3.9 | 20.5 ± 6.9 |
| 15-min dark recovery after a flashb | |||
| All-trans-retinyl esters | 201.3 ± 4.9 | 166.4 ± 15.6 | 102.6 ± 17.6 |
| 11-cis-Retinal | 287.0 ± 3.7 | 300.0 ± 29.6 | 292.6 ± 12.0 |
| All-trans-retinal | 85.7 ± 7.6 | 75.0 ± 7.6 | 223.5 ± 15.3 |
| All-trans-retinol | 36.0 ± 11.8 | 28.8 ± 3.9 | 17.7 ± 1.7 |
| 11-cis-Retinol | 19.4 ± 3.3 | 16.6 ± 5.3 | 19.9 ± 2.3 |
ND, not determined.
Retinoid composition after 15 min of recovery after a flash that bleached ~40% rhodopsin. Pigmented mice were used for the experiments.
RDH Activity in Cells Expressing prRDH and in the Retina of prRDH−/− Mice
Next we measured how disrupting prRDH affected the reduction of all-trans-retinal. All-trans-retinal was applied exogenously to ROS and the all-trans-RDH activity was determined from the rate of production of all-trans-retinol (see “Materials and Methods”). The prRDH+/+ all-trans-RDH activity was ~4-fold higher in the presence of NADPH compared with NADH, as observed previously (10, 13, 31, 46, 47) (Fig. 4A, upper panel). The all-trans-RDH activity of recombinant expressed prRDH was also higher with NADPH than with NADH (Fig. 4A, lower panel).
Fig. 4. All-trans-RDH activity in the ROS from prRDH mice and in prRDH-Sf9 cells.

A, RDH activity in mouse ROS extract from prRDH−/− mice. An aliquot of ROS (5 μg) from prRDH+/+ and prRDH−/− mice was suspended in 100 μl of 100 mm MES, pH 5.5, containing 1 mm NADPH or NADH, and 200 μm all-trans-retinal. After 15 min incubation at 37 °C, the all-trans-retinol product was quantified by HPLC (upper panel). In control experiments, nucleotide specificity of prRDH expressed in a heterologous expression system was examined (lower panel). Sf9 cells expressing mouse prRDH were homogenized with 10 mm sodium phosphate (pH 7.5), containing 100 mm NaCl and 1 mm DM. The supernatant was cleared from insoluble particles by centrifugation for 20 min at 10,000 × g, and an aliquot containing 10 μg of protein in 20 μl was mixed with 100 μl of 100 mm MES, pH 5.5, containing 1 mm NADPH or NADH, and 200 μm all-trans-retinal. After 15 min of incubation at 37 °C, the all-trans-retinol product was quantified by HPLC. Untransfected cells were used as negative controls. B, reduction of all-trans-retinal generated from bleached rhodopsin. An aliquot of ROS (5 μg) from prRDH+/+ and prRDH−/− mice was suspended in 100 μl of 100 mm MES, pH 5.5, containing 1 mm NADPH or NADH. All-trans-retinal was generated by a flash from a photographic flash lamp (bleaching ~70% of rhodopsin), and the amount of all-trans-retinol produced was quantified by HPLC analysis. Error bars indicate the standard error of the mean (n > 5). *, p < 0.0001.
Following light activation, rhodopsin expels the all-trans-retinal chromophore from the binding pocket (48), and the chromophore is reduced to all-trans-retinol (Scheme 1). We compared the initial time course of all-trans-retinol production in ROS from prRDH+/+ and prRDH−/− mice after bleaching rhodopsin in the absence of exogenous all-trans-retinal. The initial RDH activity was reduced in ROS of prRDH−/− mice, but retained selectivity for NADPH over NADH (Fig. 4B). Thus, RDH activity is reduced but not eliminated in ROS of prRDH−/− mice, suggesting that an alternative ROS enzyme is involved in the reduction reaction. The maximal level of all-trans-retinol production was not achieved in ROS from prRDH−/−, because slow reduction reaction allowed all-trans-retinal to become adsorbed to the tube or form a Schiff base product between the aldehyde and free amino groups (see also Fig. 3 in Ref. 26).
Flow of Retinoids in prRDH−/− Mice
To understand how loss of prRDH affected the retinoid flow throughout the visual cycle, retinoids were analyzed using HPLC at various times after an intense flash (bleaching ~40% rhodopsin). As expected, bleaching caused the formation of all-trans-retinal, which was reduced to all-trans-retinol. As described above for measurements on isolated outer segments, the reduction kinetics were slower in prRDH−/− retinas than prRDH+/+ retinas (Fig. 5A, left panel). Reduction kinetics in prRDH+/− and prRDH+/+ retinas were similar.
Fig. 5. Kinetics of all-trans-retinal reduction and 11-cis-retinal recovery in prRDH+/+, prRDH+/−, and prRDH−/− mice.

Retinoids were quantified by HPLC performed on samples collected at different time points after a flash that bleached ~40% of the visual pigment for the pigmented mice (A) and ~80% for the albino mice (B). Closed circles, open circles, and closed triangles represent data obtained from prRDH+/+, prRDH+/−, and prRDH−/− mice, respectively. Error bars indicate the standard error of the mean (n > 3). Mice were reared under 24-h dark conditions.
Although the reduction of all-trans-retinal was slowed in prRDH−/− mice, this had little effect on the kinetics of the entire visual cycle. The right panel of Fig. 5A shows the 11-cis-retinal content at several time points after bleach. The kinetics of 11-cis-retinal formation are similar in prRDH−/− and prRDH+/+ mice, suggesting that the reduction of all-trans-retinal to all-trans-retinol in prRDH−/− mice was still faster than other rate-limiting processes in the retinoid cycle.
Table I compares levels of other retinoids 15 min after the flash. Besides a slower reduction rate of all-trans-retinal and a slight decrease in the level of all-trans-retinyl esters, other parameters and levels of other retinoids in the cycle were in the normal range for all time points from 1 min to 120 min (data not shown).
Similar experiments were carried out in albino mice, in which bleaching is significantly more profound. All-trans-retinal was reduced to all-trans-retinol by photoreceptor all-trans-RDHs more slowly in albino prRDH−/− mice than prRDH+/+ mice (Fig. 5B, left panel). The 11-cis-retinal production was similar in albino prRDH−/− and prRDH+/+ mice (Fig. 5B, right panel). The 11-cis-retinal production was slower than non-albino mice because of higher bleaching levels. A slowed rate of regeneration of 11-cis-retinal with increased bleaching has been described previously (49–51); this behavior differs from the simple kinetic equation described for man (52). We conclude that the phenotype of prRDH−/− mice differs only mildly from the normal phenotype, suggesting that remaining RDH activity exceeds the requirements of the retinoid cycle for reduction of all-trans-retinal and is carried out by multiple enzymes.
ERG Analysis
To evaluate rod- and cone-mediated light responses, prRDH−/− mice were studied using non-invasive ERG methods (53). The amplitudes of the a- and b-waves were not significantly different (p > 0.2, one-way analysis of variance) in dark- and light-adapted prRDH−/− and prRDH+/+ mice (Fig. 6, A–D). From a-wave maximal responses in dark-adapted mice (36), sensitivities and maximal a-wave amplitude were estimated, and these parameters were not found to be significantly different (Table II, p > 0.2, one-way analysis of variance). Finally, responses to a 10-Hz flicker were similar for dark- and light-adapted prRDH−/− and prRDH+/+ mice (data not shown). Thus, prRDH deletion does not significantly alter the ability of rods and cones to generate light responses.
Fig. 6. Single-flash ERG responses of increasing intensity for prRDH+/+ and prRDH−/− mice.
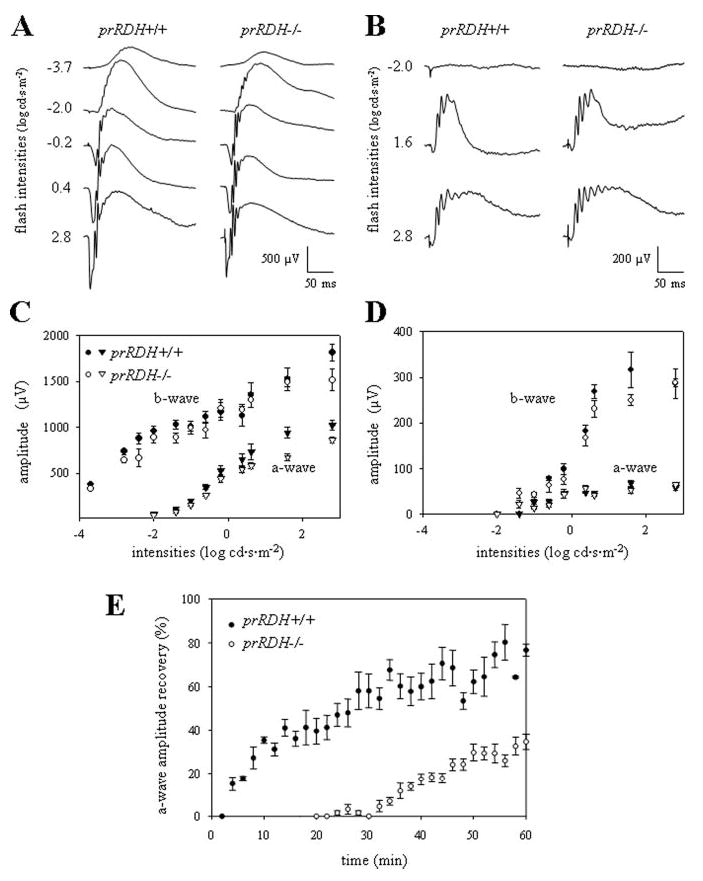
Serial responses to increasing flash stimuli were obtained for prRDH+/+ and prRDH−/− mice for selected intensities under dark-adapted conditions (A) and under light-adapted conditions (B). A function of a-wave and b-wave versus light intensity under dark-adapted conditions (C) and light-adapted conditions (D) was plotted. E, measurements of a-wave recovery rates after constant light stimulation. The dark-adapted mice were bleached with intense constant illumination (500 cd·m−2) for 3 min and the recovery of a-wave amplitudes was monitored with single-flash ERG (−0.2 cd·s·m−2) for 60 min. The recovery rate was significantly attenuated in prRDH−/− (p < 0.0001) compared with prRDH+/+ mice (n = 5 in each condition).
Table II. Quantitative parameters of ERG a-wave.
ERGs were recorded as described under “Materials and Methods.” Leading edges (initial 5–20 ms depending on response) of dark-adapted ERG photoresponses evoked by 2.8 log cd·s·m−2 flashes are fitted with a model of phototransduction. Maximum a-wave amplitude, and sensitivity parameters, of a-wave in prRDH−/− mice compared with WT mice.
| prRDH+/+ | prRDH−/− | |
|---|---|---|
| Maximum a-wave amplitude (μV) | 964.6 ± 48.4 | 897.6 ± 75.3 |
| Sensitivity (log cd−1·m2·s−3) | 6.2 ± 0.3 | 5.6 ± 0.4 |
Recovery of the ERG response (dark adaptation) following bleach was also measured by monitoring the amplitude of the a-wave after exposure to intense constant illumination (500 cd·m−2) for 3 min. The recovery of the responses was substantially slower in prRDH−/− mice compared with prRDH+/+ mice (p < 0.0001, Fig. 6E).
The total retinoid level in the eye, quantitatively represented in the whole eye analysis, indicated bleaching of about 66 ± 4% of rhodopsin and elevated levels of all-trans-retinal (Fig. 7A). After 30 min of dark adaptation, only 3 and 31% of free all-trans-retinal was present in prRDH+/+ and prRDH−/− mouse eyes, respectively. The desensitization of rod function likely resulted from the presence of all-trans-retinal in the retina in prRDH−/− mice, whereas in prRDH+/+ mice all-trans-retinol was reduced and esterified to retinyl esters in the RPE (Fig. 7B). Thus, although the absence of prRDH does not substantially slow 11-cis-retinal regeneration, the slowed reduction of all-trans-retinal causes a slowed recovery of sensitivity following a significant bleach.
Fig. 7. Recovery of 11-cis-retinal after prolonged and intense bleaching in prRDH+/+ and prRDH−/− mice.

A, dark-adapted mice were exposed to background light of 500 cd·m−2 for 3 min and returned to the dark. Retinoid analysis by HPLC was performed at 0 and 30 min after the bleach. B, dark-adapted mice were exposed to background light of 500 cd·m−2 for 3 min and returned to the dark. Retinoid analysis by HPLC was performed 30 min after the bleach separately for the retina and the RPE. There is partial unavoidable cross-contamination of the RPE and the retina as measured by the presence of retinyl esters in the retinal fraction and 11-cis-retinal in the RPE. Note that retinal isomers were converted into oximes with hydroxylamine before HPLC separation.
Single Cell Recordings
To measure the effect of prRDH deletion on rod light responses, outer segment membrane currents of prRDH+/+ and prRDH−/− mice were recorded with suction electrodes. Responses of dark-adapted prRDH−/− and prRDH+/+ rods were indistinguishable, but the prRDH−/− rods recovered from bleach more slowly. These results are described in more detail below.
Fig. 8 shows flash families from a prRDH+/+ (left) and prRDH−/− rod (right). The flash strength required to produce a half-maximal response was very similar in the two types of rod: 10.6 ± 0.7 photoactivated rhodopsin in prRDH+/+ cells (mean ± S.E., n = 12) and 10.7 ± 0.8 photoactivated rhodopsin in prRDH−/− cells (n = 11). Thus deletion of the prRDH gene did not significantly affect the sensitivity of dark-adapted rods.
Fig. 8. Rods from prRDH−/− mice have normal sensitivity but slowed recovery from bleach.

A, flash families from prRDH+/+ (left) and prRDH−/− (right) rods. Average responses are superimposed for flashes producing 4, 8, 16, 32, 64, and 128 photoactivated rhodopsin molecules (Rho*). Response amplitudes were normalized by the response to the brightest flash. B, recovery of dark current following a ~4% bleach at t = 0. Individual measurements of the dark current (○) were fit with an exponential to estimate the recovery time constant 75 s for the prRDH+/+ rod and 130 s for the prRDH−/− rod. Dark currents were normalized to those determined shortly after initiating the recording. C, recovery of sensitivity following a ~4% bleach. Sensitivity was determined by fitting stimulus-response relations from data like that in A and estimating the flash strength required to produce a half-maximal response. These sensitivity measures were normalized to that determined shortly after starting the recording. Measured sensitivities (○) were fit with an exponential with the same time constant as the dark current data in B.
Fig. 8 (B and C) show recovery of the dark current and sensitivity of a prRDH+/+ (left) and prRDH−/− (right) rod following a 4% bleach at t = 0. The dark current was measured by periodically delivering flashes sufficiently bright to produce saturating responses. The sensitivity (half-saturating flash strength) was measured periodically from flash families like those in A. The smooth lines fit to the experimental points are single exponential fits, which were used to estimate the time course of recovery. The dark current and sensitivity recovered with a similar time course (i.e. the exponential fits have the same time constants). This was true in both prRDH+/+ and prRDH−/− rods. However, for a 4% bleach, the time constant of dark current recovery was 116 ± 16 s in prRDH−/− rods (mean ± S.E., n = 11) and 83 ± 10 s in prRDH+/+ rods (n = 12). A similar difference was observed following an 8% bleach: prRDH−/− rods recovered with a time constant of 250 ± 60 s (n = 6), whereas prRDH+/+ rods recovered with a time constant of 150 ± 20 s (n = 7). Thus deletion of prRDH produced a modest slowing of the recovery of the rod photocurrent and photosensitivity following bleach.
Similar observations were made using ERG. After a flash that bleached ~40% of rhodopsin, no recovery of a-wave during 50 min in the dark was observed in prRDH−/− mice, whereas prRDH+/+ mice recovered about 50% of the maximal a-wave (data not shown).
Meta II Decay in ROS from prRDH+/+ and prRDH−/− Mice
To evaluate if the decay of Meta II is affected by the lack of prRDH, we used an intrinsic Trp fluorescence assay (41). No significant differences in the rate of Meta II decay were observed (Fig. 9), suggesting that the prRDH does not directly facilitate removal of the chromophore from the binding sites (24).
Fig. 9. Meta II decay in ROS from prRDH+/+ and prRDH−/− mice.

The increase in intrinsic Trp fluorescence of rhodopsin in the ROS from prRDH+/+ (A) or prRDH−/− mice (B) was measured. When fitted to the first order reaction, a similar relaxation time (τ) was observed using prRDH+/+ (τA = 18.1 min; τC = 2.6 min) and prRDH−/− (τB = 19.3 min; τD = 3.0 min) ROS. The fitted curves of A and B have values of R2 > 0.91.
A2E Accumulation in prRDH−/− Mice
Free all-trans-retinal can condense with ethanolamine to an A2E fluorescent product as observed in Abcr−/− mice (21). To detect the amount of A2E we used two techniques. First, A2E was detected at levels higher in prRDH−/− mice than in the WT (Fig. 10A). This accumulation was significantly higher in mice raised under a 12-h light/12-h dark cycle as compared with mice kept in the dark throughout their life. Higher levels of A2E were also visualized by fluorescent microscopy (Fig. 10B). These results suggest that the level of A2E is elevated in prRDH−/− mice, but the difference with the WT mice was not as significant as that reported previously between Abcr−/− mice and WT (21).
Fig. 10. A2E in eyes from prRDH+/+ and prRDH−/− mice.
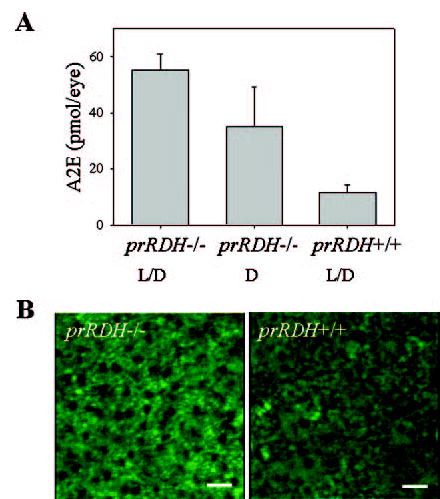
A, quantification of A2E from prRDH−/− mice raised in the dark or on a 12-h light/dark cycle, and prRDH+/+ mice raised on a 12-h light/dark cycle, by normal phase HPLC as described under “Materials and Methods.” Error bars indicate the standard error of the mean (n > 5). B, microscopic visualization of lipofuscin ex vivo. Images were obtained from RPE cells, and three-dimensional projections (left, prRDH−/−; right, prRDH+/+) were constructed from multiple images. RPE autofluorescence is shown in green. In these experiments, 7- to 9-month-old mice were employed.
DISCUSSION
Restoration (return to the dark state) of photosensitive rhodopsin and cone visual pigments requires the formation of 11-cis-retinal via the retinoid cycle (2). The first step in the cycle, the reduction of a major fraction of all-trans-retinal to all-trans-retinol, is thought to take place in photoreceptor outer segments (ROS in rods and cone outer segments in cones), whereas all other reactions, including esterification and isomerization, occur within the RPE. The removal of a residual fraction of all-trans-retinal from the disks appears to be facilitated by an ATP-binding cassette transporter, termed ABCR (gene symbol ABCA4). All-trans-retinal is reduced to all-trans-retinol by an NADPH-dependent all-trans-RDH, thought to be prRDH, belonging to the large family of SDR and located in the outer segments of photoreceptors (10, 54). Most likely, rods and cones have a different but related set of RDHs that are capable of catalyzing this reaction (9). Retinol then diffuses or is translocated across the cell membrane into the RPE by an unknown mechanism, where it is esterified by lecithin:retinol acyl trans-ferase. In a key step of central importance to the retinoid cycle, all-trans-retinyl esters are isomerized by an unidentified isomerohydrolase, or cleaved by a retinyl ester hydrolase and then isomerized to 11-cis-retinol by a putative isomerase (1). 11-cis-Retinol is then oxidized to 11-cis-retinal in a reaction catalyzed by another NAD-dependent RDH, termed 11-cis-RDH (RDH5), as well as by RDH11 and other RDHs (37). In the final step of the retinoid cycle, 11-cis-retinal translocates back to the rod photoreceptor plasma and disk membranes, where it forms a protonated Schiff base with opsins to regenerate visual pigments.
PrRDH Knock-out Mice
Mouse and human prRDH polypeptides are highly conserved and are most closely related to 17-β-hydroxysteroid dehydrogenases. To identify a specific role of prRDH in the retinoid cycle, we generated prRDH knock-out mice in which central exons 2–4 containing in part the dinucleotide-binding site (residues 143–171 in mouse prRDH) were deleted. Nathans and colleagues (55) have shown that prRDH has a C-terminal signal sequence, similar to the sequence present at the C terminus of rhodopsin, which is responsible for the vectorial transport of the enzyme from the site of synthesis to ROS. prRDH is likely a membrane-associated enzyme by way of the palmitoylation of C-terminal conserved Cys residues (54). These findings suggest that rhodopsin and prRDH could be transported independently of one another, rather than tightly associated, as suggested by prRDH’s biochemical facilitation of removal of the chromophore from rhodopsin (24). We reasoned that a prRDH knock-out would disable or interfere with reduction of all-trans-retinal in the rod photoreceptors, and cause problems with efficient regeneration of 11-cis-retinal. Genotyping, Southern blotting, immunoblotting, and immunocytochemistry all indicated that the prRDH gene was successfully deleted, and mouse prRDH−/− ROS activity assays clearly showed that RDH activity (the production of retinol from all-trans-retinal in the presence of NADPH) was suppressed, but not eliminated. However, the prRDH−/− retina developed normally, and both photopic and scotopic ERGs were normal. Lack of this enzyme also did not affect the decay of photoactivated rhodopsin, as measured in a fluorescent assay.
Role of prRDH in Intense and Prolonged Bleaches and Photoreceptor Desensitization
As shown in this study, prRDH−/− mice accumulate all-trans-retinal after intense bleach; however, the regeneration rate of 11-cis-retinal is within the normal range. A prolonged illumination that bleaches a large fraction of the pigment leads to significantly different recovery kinetics of the visual functions (Figs. 6C and 8C). These results, in conjunction with retinoid analysis (Fig. 7), suggest that the opsin-all-trans-retinal complex is the desensitizing species that slows the recovery of the dark sensitivity. From the previous biochemical analysis, it was proposed that opsin and the opsin-all-trans-retinal complex can trigger phototransduction (27). Opsin alone can activate G protein transducin (56), but the complex is much more effective in the interaction with phototransduction proteins (22, 23, 25, 26). This study provides the first in vivo evidence that such a mechanism operates in prRDH−/− mice. These conclusions are in agreement with evidences from electrophysiological experiments, which also suggest that the photoactivated form of rhodopsin (metarhodopsin II) and longer-lived photoproducts (like opsin-all-trans-retinal complexes) of rhodopsin bleaching contribute to bleaching desensitization (extensively and insightfully reviewed by Fain and colleagues (57)).
A2E Is Only Slightly Elevated in prRDH−/− Mice
Over-accumulation of all-trans-retinal could result in the formation of A2E as a result of the all-trans-retinal condensation with free amines such as those of phosphatidylethanolamine. It has been noted before that in mice lacking ABCR and accumulating all-trans-retinal, A2E amasses in RPE cells at a greatly increased rate compared with controls (21). Formation of A2E was inhibited when Abcr−/− mice were raised in total darkness (58). The absolute value could be misleading due to differences in the extraction techniques and analysis, such as the use of phosphate salt in the organic phase on normal phase columns (58). Other important factors are the age of the mice and, possibly, their diet. However, within the experiment there should be consistency between mice of different genetic backgrounds. For Abcr−/− mice the level of A2E was consistently higher by a factor of 20 as compared with WT mice (52, 21). In our experimental conditions, there was no more than double the amount of A2E in prRDH−/− mice compared with WT mice. These results appear to be consistent with the images obtained by fluorescent microscopy. Dark and 12-h light/12-h dark cycle rearing had a minor effect on the accumulation of A2E. It might be reasonably concluded that a lack of cytoplasmic prRDH does contribute to A2E overaccumulation.
RDHs and Retinal Diseases
The human RDH8 gene consisting of six exons is located on 19p13.2-p13.3, but no retinal diseases have so far been linked to defects in this gene (16). Of all eye-specific RDHs, only the RDH5 enzyme has been thoroughly characterized, and mutations in this gene are associated with the human disorder fundus albipunctatus. In contrast to the human phenotype, RDH5−/− mice show a delayed dark adaptation, but normal fundi (45, 47). Haeseleer et al. (13) showed that, in addition to retSDR and prRDH, several SDR RDHs were present in the retina and RPE (RDH11–14). Particularly significant, based on in situ hybridization, was the presence of RDH12 mRNA in photoreceptor inner segments.
In addition, immunocytochemistry assays indicated the presence of RDH13 and RDH14 in inner segments, whereas RDH11 was expressed in the RPE. It was recently shown that defects in the RDH12 gene lead to severe retinal dystrophy termed Leber congenital amaurosis, strongly suggesting that this enzyme plays a prominent role in the retinoid cycle (14, 15). The defects are missense mutations, truncations (stop codons), or frameshift mutations, likely causing null alleles. The severe visual impairment resulting from RDH12 null alleles is in marked contrast to the relatively mild phenotype of fundus albipunctatus observed with mutations in the RDH5 gene. These genetic results suggest that RDH12 could be the key enzyme of the retinoid cycle, whereas prRDH could have a complementary role, use different steroids or other hydrophobic substrates as do other SDRs, or play a different role altogether in photoreceptor physiology.
In summary, we have generated mice with a disrupted prRDH gene lacking an enzyme that catalyzes the reduction of all-trans-retinal to all-trans-retinol, a key event in the retinoid cycle involved in the regeneration of the visual chromophore, 11-cis-retinal. The histological analysis, flow of retinoids, A2E accumulation, ERGs, and single cell recording revealed that photoreceptor visual functions are mildly affected in the absence of prRDH. However, prRDH can participate in the retinoid cycle at high intensity bleaches, contributing to the clearing of all-trans-retinal from the photoreceptors and preventing desensitization. We propose that prRDH is an enzyme whose activity contributes in vivo to all-trans-retinal reduction at higher light intensities and prolonged illumination but is not the key enzyme of the retinoid cycle as suggested previously. This missing enzyme appears to be RDH12.
Acknowledgments
We thank Dr. Geeng-Fu Jang and Dr. Joshua McBee for help with RDH assays and mass spectrometric analysis, Daniel Possin for EM analysis, Amy Look for technical help during the course of this study, and Rebecca Birdsong for help during manuscript preparation.
Footnotes
This work was supported by National Institutes of Health Grants EY08123, EY08061, EY11850, and EY13385, the Stargardt and Retinal Eye Disease Fund, a grant from James and Jayne Lea, a grant from Research to Prevent Blindness, Inc. to the Dept. of Ophthalmology at the University of Utah, a grant from the Macular Vision Research Foundation, a Center grant from the Foundation Fighting Blindness to the University of Utah, and a grant from the E. K. Bishop Foundation.
The abbreviations used are: RDH, retinol dehydrogenase; prRDH, photoreceptor retinol dehydrogenase; Ab, antibody; AMD, age-related macular degeneration; A2E, (2-[2,6-dimethyl-8-(2,6,6-trimethyl-1-cyclohexen-1-yl)-1E,3E,5E,7E-octatetraenyl]-1-(2-hydroxyethyl)-4-[4-methyl-6-(2,6,6-trimethyl-1-cyclohexen-1-yl)-1E,3E,5E-hexatrienyl]pyridinium); DM, dodecyl-β-maltoside; EM, electron microscope (microscopy); ERG, electroretinogram; HPLC, high pressure liquid chromatography; ROS, rod outer segment(s); RPE, retinal pigment epithelium; SDR, short-chain dehydrogenase/reductase; WT, wild-type; PIPES, 1,4-piperazinediethanesulfonic acid; BisTris, 2-[bis(2-hydroxyethyl)amino]-2-(hydroxymethyl)propane-1,3-diol; MES, 4-morpholineethanesulfonic acid; ES cells, embryonic stem cells.
References
- 1.Kuksa V, Imanishi Y, Batten M, Palczewski K, Moise AR. Vision Res. 2003;43:2959–2981. doi: 10.1016/s0042-6989(03)00482-6. [DOI] [PubMed] [Google Scholar]
- 2.McBee JK, Palczewski K, Baehr W, Pepperberg DR. Prog Retin Eye Res. 2001;20:469–529. doi: 10.1016/s1350-9462(01)00002-7. [DOI] [PubMed] [Google Scholar]
- 3.Filipek S, Stenkamp RE, Teller DC, Palczewski K. Annu Rev Physiol. 2003;65:851–879. doi: 10.1146/annurev.physiol.65.092101.142611. [DOI] [PMC free article] [PubMed] [Google Scholar]
- 4.Allikmets R, Singh N, Sun H, Shroyer NF, Hutchinson A, Chidambaram A, Gerrard B, Baird L, Stauffer D, Peiffer A, Rattner A, Smallwood P, Li Y, Anderson KL, Lewis RA, Nathans J, Leppert M, Dean M, Lupski JR. Nat Genet. 1997;15:236–246. doi: 10.1038/ng0397-236. [DOI] [PubMed] [Google Scholar]
- 5.Sun H, Molday RS, Nathans J. J Biol Chem. 1999;274:8269–8281. doi: 10.1074/jbc.274.12.8269. [DOI] [PubMed] [Google Scholar]
- 6.Ahn J, Molday RS. Methods Enzymol. 2000;315:864–879. doi: 10.1016/s0076-6879(00)15887-2. [DOI] [PubMed] [Google Scholar]
- 7.Ahn J, Wong JT, Molday RS. J Biol Chem. 2000;275:20399–20405. doi: 10.1074/jbc.M000555200. [DOI] [PubMed] [Google Scholar]
- 8.Molday LL, Rabin AR, Molday RS. Nat Genet. 2000;25:257–258. doi: 10.1038/77004. [DOI] [PubMed] [Google Scholar]
- 9.Haeseleer F, Huang J, Lebioda L, Saari JC, Palczewski K. J Biol Chem. 1998;273:21790–21799. doi: 10.1074/jbc.273.34.21790. [DOI] [PubMed] [Google Scholar]
- 10.Rattner A, Smallwood PM, Nathans J. J Biol Chem. 2000;275:11034–11043. doi: 10.1074/jbc.275.15.11034. [DOI] [PubMed] [Google Scholar]
- 11.Jornvall H, Persson B, Krook M, Atrian S, Gonzalez-Duarte R, Jeffery J, Ghosh D. Biochemistry. 1995;34:6003–6013. doi: 10.1021/bi00018a001. [DOI] [PubMed] [Google Scholar]
- 12.Biswas MG, Russell DW. J Biol Chem. 1997;272:15959–15966. doi: 10.1074/jbc.272.25.15959. [DOI] [PubMed] [Google Scholar]
- 13.Haeseleer F, Jang GF, Imanishi Y, Driessen CA, Matsumura M, Nelson PS, Palczewski K. J Biol Chem. 2002;277:45537–45546. doi: 10.1074/jbc.M208882200. [DOI] [PMC free article] [PubMed] [Google Scholar]
- 14.Janecke AR, Thompson DA, Utermann G, Becker C, Hubner CA, Schmid E, McHenry CL, Nair AR, Ruschendorf F, Heckenlively J, Wissinger B, Nurnberg P, Gal A. Nat Genet. 2004;36:850–854. doi: 10.1038/ng1394. [DOI] [PubMed] [Google Scholar]
- 15.Perrault I, Hanein S, Gerber S, Barbet F, Ducroq D, Dollfus H, Hamel C, Dufier JL, Munnich A, Kaplan J, Rozet JM. Am J Hum Genet. 2004;75:639–646. doi: 10.1086/424889. [DOI] [PMC free article] [PubMed] [Google Scholar]
- 16.Fishman GA, Roberts MF, Derlacki DJ, Grimsby JL, Yamamoto H, Sharon D, Nishiguchi KM, Dryja TP. Arch Ophthalmol. 2004;122:70–75. doi: 10.1001/archopht.122.1.70. [DOI] [PubMed] [Google Scholar]
- 17.Han W, Yip SP, Wang J, Yap MK. J Hum Genet. 2004;49:16–23. doi: 10.1007/s10038-003-0100-9. [DOI] [PubMed] [Google Scholar]
- 18.Parish CA, Hashimoto M, Nakanishi K, Dillon J, Sparrow J. Proc Natl Acad Sci U S A. 1998;95:14609–14613. doi: 10.1073/pnas.95.25.14609. [DOI] [PMC free article] [PubMed] [Google Scholar]
- 19.Liu J, Itagaki Y, Ben-Shabat S, Nakanishi K, Sparrow JR. J Biol Chem. 2000;275:29354–29360. doi: 10.1074/jbc.M910191199. [DOI] [PubMed] [Google Scholar]
- 20.Eldred GE. Nature. 1993;364:396. doi: 10.1038/364396a0. [DOI] [PubMed] [Google Scholar]
- 21.Weng J, Mata NL, Azarian SM, Tzekov RT, Birch DG, Travis GH. Cell. 1999;98:13–23. doi: 10.1016/S0092-8674(00)80602-9. [DOI] [PubMed] [Google Scholar]
- 22.Hofmann KP, Pulvermuller A, Buczylko J, Van Hooser P, Palczewski K. J Biol Chem. 1992;267:15701–15706. [PubMed] [Google Scholar]
- 23.Jager S, Palczewski K, Hofmann KP. Biochemistry. 1996;35:2901–2908. doi: 10.1021/bi9524068. [DOI] [PubMed] [Google Scholar]
- 24.Schadel SA, Heck M, Maretzki D, Filipek S, Teller DC, Palczewski K, Hofmann KP. J Biol Chem. 2003;278:24896–24903. doi: 10.1074/jbc.M302115200. [DOI] [PMC free article] [PubMed] [Google Scholar]
- 25.Buczylko J, Saari JC, Crouch RK, Palczewski K. J Biol Chem. 1996;271:20621–20630. doi: 10.1074/jbc.271.34.20621. [DOI] [PubMed] [Google Scholar]
- 26.Palczewski K, Jager S, Buczylko J, Crouch RK, Bredberg DL, Hofmann KP, Asson-Batres MA, Saari JC. Biochemistry. 1994;33:13741–13750. doi: 10.1021/bi00250a027. [DOI] [PubMed] [Google Scholar]
- 27.Palczewski K, Saari JC. Curr Opin Neurobiol. 1997;7:500–504. doi: 10.1016/s0959-4388(97)80029-3. [DOI] [PubMed] [Google Scholar]
- 28.Adamus G, Zam ZS, Arendt A, Palczewski K, McDowell JH, Hargrave PA. Vision Res. 1991;31:17–31. doi: 10.1016/0042-6989(91)90069-h. [DOI] [PubMed] [Google Scholar]
- 29.Laemmli UK. Nature. 1970;227:680–685. doi: 10.1038/227680a0. [DOI] [PubMed] [Google Scholar]
- 30.Zhu L, Jang GF, Jastrzebska B, Filipek S, Pearce-Kelling SE, Aguirre GD, Stenkamp RE, Acland GM, Palczewski K. J Biol Chem. 2004;279:53828–53839. doi: 10.1074/jbc.M408472200. [DOI] [PMC free article] [PubMed] [Google Scholar]
- 31.Jang GF, McBee JK, Alekseev AM, Haeseleer F, Palczewski K. J Biol Chem. 2000;275:28128–28138. doi: 10.1074/jbc.M004488200. [DOI] [PMC free article] [PubMed] [Google Scholar]
- 32.Van Hooser JP, Aleman TS, He YG, Cideciyan AV, Kuksa V, Pittler SJ, Stone EM, Jacobson SG, Palczewski K. Proc Natl Acad Sci U S A. 2000;97:8623–8628. doi: 10.1073/pnas.150236297. [DOI] [PMC free article] [PubMed] [Google Scholar]
- 33.Van Hooser JP, Liang Y, Maeda T, Kuksa V, Jang GF, He YG, Rieke F, Fong HK, Detwiler PB, Palczewski K. J Biol Chem. 2002;277:19173–19182. doi: 10.1074/jbc.M112384200. [DOI] [PMC free article] [PubMed] [Google Scholar]
- 34.Maeda T, Van Hooser JP, Driessen CA, Filipek S, Janssen JJ, Palczewski K. J Neurochem. 2003;85:944–956. doi: 10.1046/j.1471-4159.2003.01741.x. [DOI] [PMC free article] [PubMed] [Google Scholar]
- 35.Batten ML, Imanishi Y, Maeda T, Tu DC, Moise AR, Bronson D, Possin D, Van Gelder RN, Baehr W, Palczewski K. J Biol Chem. 2004;279:10422–10432. doi: 10.1074/jbc.M312410200. [DOI] [PMC free article] [PubMed] [Google Scholar]
- 36.Breton ME, Schueller AW, Lamb TD, Pugh EN., Jr Invest Ophthalmol Vis Sci. 1994;35:295–309. [PubMed] [Google Scholar]
- 37.Kim TS, Maeda A, Maeda T, Heinlein C, Kedishvili N, Palczewski K, Nelson PS. J Biol Chem. 2005;280:8694–8704. doi: 10.1074/jbc.M413172200. [DOI] [PMC free article] [PubMed] [Google Scholar]
- 38.Baylor DA, Lamb TD, Yau KW. J Physiol. 1979;288:589–611. [PMC free article] [PubMed] [Google Scholar]
- 39.Field GD, Rieke F. Neuron. 2002;35:733–747. doi: 10.1016/s0896-6273(02)00822-x. [DOI] [PubMed] [Google Scholar]
- 40.Field GD, Rieke F. Neuron. 2002;34:773–785. doi: 10.1016/s0896-6273(02)00700-6. [DOI] [PubMed] [Google Scholar]
- 41.Farrens DL, Khorana HG. J Biol Chem. 1995;270:5073–5076. doi: 10.1074/jbc.270.10.5073. [DOI] [PubMed] [Google Scholar]
- 42.Heck M, Schadel SA, Maretzki D, Bartl FJ, Ritter E, Palczewski K, Hofmann KP. J Biol Chem. 2003;278:3162–3169. doi: 10.1074/jbc.M209675200. [DOI] [PMC free article] [PubMed] [Google Scholar]
- 43.Imanishi Y, Batten ML, Piston DW, Baehr W, Palczewski K. J Cell Biol. 2004;164:373–383. doi: 10.1083/jcb.200311079. [DOI] [PMC free article] [PubMed] [Google Scholar]
- 44.Saari JC, Garwin GG, Van Hooser JP, Palczewski K. Vision Res. 1998;38:1325–1333. doi: 10.1016/s0042-6989(97)00198-3. [DOI] [PubMed] [Google Scholar]
- 45.Driessen CA, Winkens HJ, Hoffmann K, Kuhlmann LD, Janssen BP, Van Vugt AH, Van Hooser JP, Wieringa BE, Deutman AF, Palczewski K, Ruether K, Janssen JJ. Mol Cell Biol. 2000;20:4275–4287. doi: 10.1128/mcb.20.12.4275-4287.2000. [DOI] [PMC free article] [PubMed] [Google Scholar]
- 46.Cideciyan AV, Haeseleer F, Fariss RN, Aleman TS, Jang GF, Verlinde CL, Marmor MF, Jacobson SG, Palczewski K. Vis Neurosci. 2000;17:667–678. doi: 10.1017/s0952523800175029. [DOI] [PMC free article] [PubMed] [Google Scholar]
- 47.Jang GF, Van Hooser JP, Kuksa V, McBee JK, He YG, Janssen JJ, Driessen CA, Palczewski K. J Biol Chem. 2001;276:32456–32465. doi: 10.1074/jbc.M104949200. [DOI] [PMC free article] [PubMed] [Google Scholar]
- 48.Okada T, Ernst OP, Palczewski K, Hofmann KP. Trends Biochem Sci. 2001;26:318–324. doi: 10.1016/s0968-0004(01)01799-6. [DOI] [PubMed] [Google Scholar]
- 49.Bonds AB, MacLeod DI. J Physiol. 1974;242:237–253. doi: 10.1113/jphysiol.1974.sp010704. [DOI] [PMC free article] [PubMed] [Google Scholar]
- 50.Cicerone CM, Green DG. J Physiol. 1981;314:213–224. doi: 10.1113/jphysiol.1981.sp013702. [DOI] [PMC free article] [PubMed] [Google Scholar]
- 51.Perlman I. J Physiol. 1978;278:141–159. doi: 10.1113/jphysiol.1978.sp012297. [DOI] [PMC free article] [PubMed] [Google Scholar]
- 52.Alpern M. J Physiol. 1971;217:447–471. doi: 10.1113/jphysiol.1971.sp009580. [DOI] [PMC free article] [PubMed] [Google Scholar]
- 53.Hetling JR, Pepperberg DR. J Physiol Lond. 1999;516:593–609. doi: 10.1111/j.1469-7793.1999.0593v.x. [DOI] [PMC free article] [PubMed] [Google Scholar]
- 54.Luo W, Marsh-Armstrong N, Rattner A, Nathans J. J Neurosci. 2004;24:2623–2632. doi: 10.1523/JNEUROSCI.5302-03.2004. [DOI] [PMC free article] [PubMed] [Google Scholar]
- 55.Rattner A, Chen J, Nathans J. J Biol Chem. 2004;279:42202–42210. doi: 10.1074/jbc.M407928200. [DOI] [PubMed] [Google Scholar]
- 56.Melia TJ, Jr, Cowan CW, Angleson JK, Wensel TG. Biophys J. 1997;73:3182–3191. doi: 10.1016/S0006-3495(97)78344-9. [DOI] [PMC free article] [PubMed] [Google Scholar]
- 57.Fain GL, Matthews HR, Cornwall MC, Koutalos Y. Physiol Rev. 2001;81:117–151. doi: 10.1152/physrev.2001.81.1.117. [DOI] [PubMed] [Google Scholar]
- 58.Mata NL, Weng J, Travis GH. Proc Natl Acad Sci U S A. 2000;97:7154–7159. doi: 10.1073/pnas.130110497. [DOI] [PMC free article] [PubMed] [Google Scholar]