

Abstract
Background
Evidence suggests that vitamin D status in adults, as assessed by serum 25-hydroxyvitamin D (25-OHD), is positively associated with calcium absorption fraction and inversely associated with serum PTH. Few comparable pediatric data exist.
Objectives
The objective of this study was to evaluate the relationships among vitamin D status, PTH, and calcium absorption in mid-pubertal boys and girls.
Methods
Calcium absorption was measured as part of an evaluation of the effects of prebiotics (inulin-type fructans) using a stable isotope method in 93 young adolescents, 12.7 ± 1.0 yr of age, receiving diets averaging approximately 900 mg/d calcium.
Results
A significant positive relation to calcium absorption was found for serum 1,25-dihydroxyvitamin D(P = 0.048) and PTH(P = 0.007), but not for 25-OHD (P = 0.77). PTH was significantly inversely related to 25-OHD and was positively related to serum 1,25-dihydroxyvitamin D and osteocalcin. PTH was marginally significantly inversely related to lumbar spinal, but not whole body, bone mineral density.
Conclusions
These data suggest that in adolescents, especially in the presence of vitamin D insufficiency, PTH secretion increases to adapt to higher rates of bone formation associated with growth. This results in higher serum 1,25(OH)2D concentrations and increased calcium absorption results. Vitamin D status, as reflected by the serum 25-OHD level, is not closely related to calcium absorption. Whether adaptation to low serum 25-OHD is adequate under physiologically stressful situations, including those leading to very low serum 25-OHD levels, is unknown.
Abbreviations: BMC, Bone mineral content; BMD, bone mineral density; CI, confidence interval; ITF, inulin-type fructan; 25-OHD, 25-hydroxyvitamin D; 1,25-(OH)2D, 1,25-dihydroxyvitamin D
INCREASING EVIDENCE SUGGESTS that vitamin D insufficiency is a common occurrence in children and adults (1). Although in small children vitamin D insufficiency often manifests as rickets or fractures, this occurs infrequently in adolescence (2). However, subtle effects of vitamin D inadequacy may occur, which include the failure to achieve peak bone mass or the development of hyperparathyroidism with bone loss and fractures (3, 4).
Because the principal physiological function recognized for vitamin D (especially in pediatric populations) is enhancing calcium absorption, it is important to understand dietary vitamin D (and calcium) requirements based upon the effects of vitamin D status on calcium absorption. These relationships are complicated by skin conversion of provitamin D to vitamin D, which varies with the degree of skin exposure to sunlight. Nonetheless, biochemical measures of vitamin D metabolites should provide a basis for evaluating the effects of vitamin D deficiency and the effects of vitamin D on calcium absorption. Such data in preadolescent or adolescent children are very limited.
We conducted a study evaluating supplementation of the diet with inulin-type fructans (ITF; prebiotics) in young adolescents. Previously reported results of this study included calcium absorption as related to the Fok1 polymorphism of the vitamin D receptor (5) and the prebiotic supplementation (6). We have also analyzed data at the end point of that study as related to vitamin D metabolites, PTH concentration, and calcium absorption. In carrying out this current analysis, we hypothesized that serum 25-hydroxyvitamin D (25-OHD) would be significantly positively correlated to fractional calcium absorption.
Subjects and Methods
Subjects
Through responses to public advertising, we identified 50 girls and 50 boys who participated in a longitudinal study of the effects of 12 months of an ITF on calcium absorption. Subjects were selected to approximately match the ethnic distribution of the greater Houston area. To be enrolled, subjects had to be healthy, Tanner stage 2 or 3 (breast stage for females, penile stage for males). Girls had to be premenarcheal at the start of the study. Subjects with chronic illnesses requiring regular medications were ineligible. All Tanner stage evaluations were performed by physical examination. Of the original cohort, 93 subjects were available for evaluation at 1 yr. The data in this report are from the end of the study, 12 months after enrollment, when 84 of the 93 subjects were Tanner 3, 4, or 5. This time probably represents a peak in calcium accretion to the skeleton.
A parent or legal guardian gave written informed consent for each subject, and all subjects gave written assent. The institutional review board of Baylor College of Medicine and affiliated hospitals approved this protocol.
Clinical protocol
Subjects completed a 1-yr intervention study in which they were randomized to receive either an ITF or a maltodextrin control daily. Results, presented previously, demonstrated a significant benefit (difference, 5.9 ± 2.8%; P = 0.04) in calcium absorption after supplementation with ITF (6). At the end of the year, at the time that calcium absorption was measured, subjects had a physical examination to assess Tanner stage, and measurements were made of serum alkaline phosphatase activity, osteocalcin, 1,25-dihydroxyvitamin D [1,25(OH)2D], 25-OHD, and PTH.
Dietary methods
Using telephone screening, we excluded subjects who avoided all dairy products or whose usual intake of calcium appeared to be less than 500 mg/d. To accurately determine intakes, all foods and beverages during in-patient visits were weighed before and after intake. Subjects kept weighed food records for 2 d. To reflect dietary food contents during the study, dietary intake data were collected using Nutrition Data System for Research software versions 4.03 and 4.05 (Nutrition Coordinating Center, University of Minnesota, Minneapolis, MN).
Calcium absorption measurements
Stable isotope studies were performed as previously described (5, 6). Most subjects received a breakfast that contained approximately one third of their daily calcium intake. Toward the end of breakfast, subjects were given 20 μg 46Ca mixed with 240 ml calcium-fortified orange juice. After breakfast, 42Ca (1.2 mg) was infused over 2 min. Beginning with breakfast, a complete 24-h urine collection was obtained. After discharge, subjects collected a second 24-h urine collection at home. Calcium absorption was calculated from the relative recovery of the oral and the iv tracer during the entire 48-h study period.
Analytical methods
Serum 25-OHD was measured using a commercial RIA kit from DiaSorin, Inc. (Stillwater, MN). Measurement of 1,25-(OH)2D was performed using a commercial kit (DiaSorin, Inc.). The procedure is a dual antibody RIA performed after minicolumn extraction of 0.5 ml sera. Intra- and interassay coefficient of variation is 8–10%. Serum intact PTH was measured using an immunoradiometric assay kit by Diagnostic Systems Laboratories (Webster, TX).
Osteocalcin was determined using an RIA method previously described (7). Samples were immediately spun and frozen at −60 C and assayed for osteocalcin in the laboratory of Dr. Caren Gundberg (Yale University, New Haven, CT) using an immunoassay that recognizes both intact and the major n-mid proteolytic fragment. Samples for this assay are stable for 2 yr at −80 C. All samples were run in the same batch. Interassay variability was 3%. Serum N-telopeptide was measured using a commercial assay (Osteomark NTx; Wampole Laboratories, Princeton, NJ). Serum alkaline phosphatase activity was measured using standard clinical laboratory methods at Texas Children’s Hospital.
Bone mineral measurement methods
Whole body scans were performed using a Hologic QDR-4500A dual energy x-ray absorptiometer (Hologic, Inc., Waltham, MA) that operates in the fan-beam mode. Total body bone mineral content (BMC) and areal bone mineral density (BMD) values were determined as were lumbar spine BMC and BMD. Total body BMD and spine BMD precisions were less than 1%, whereas whole body BMC and BMD precision were less than 1.5%. Standard software based on adult subjects was used for interpretation of measurements.
Statistical analysis
A sample size of 100 subjects enrolled with at least 80 subjects completing 1 yr of intervention was based on identifying a significant effect of the ITF use on calcium absorption (6). Data are reported for the magnitude of effect of vitamin D metabolites and other factors on 25-OHD, PTH, calcium absorption, and bone mineralization using the partial η-squared calculation of SPSS statistical software (SPSS, Inc., Chicago, IL), as discussed previously (8). η-squared is the fraction of variation in the dependent variable (calcium absorptive efficiency or PTH) that is accounted for by the independent variable after controlling for other independent covariates. Values for η-squared and for the slope of the relationship (regression coefficient) are included only for results with P < 0.05. All data are shown as the mean ± sd
Results
Anthropometric results are shown in Table 1 along with study results for primary outcomes. Because it is useful to understand the distribution of the results for the key findings, histograms show results for calcium intake and absorption (Fig. 1) and PTH, 25-OHD, and 1,25(OH)2D levels (Fig. 2).
TABLE 1.
Anthropometric, dietary, and biochemical data for study population (n = 93, except as noted)
| Mean ± sd | Range | |
|---|---|---|
| Age (yr) | 12.6 ± 1.0 | 10.1 to 14.0 |
| Weight (kg) | 48.4 ± 10.4 | 29.2 to 74.9 |
| Weight z-score | 0.37 ± 0.95 | −1.94 to 2.40 |
| Height (cm) | 155.5 ± 9.0 | 135.3 to 178 |
| Height z-score | 0.19 ± 0.37 | −2.35 to 2.31 |
| Calcium intake (mg/d) | 906 ± 280 | 417 to 1616 |
| Osteocalcin (n = 85; ng/ml) | 30 ± 20 | 1 to 105 |
| Serum N-telopeptide (n = 83; nm BCE/liter) | 102 ± 38 | 29 to 160 |
| Calcium absorption (%) | 36.1 ± 14.0 | 9.9 to 75.2 |
| 25-OHD (ng/ml) | 27.9 ± 7.9 | 9.0 to 50.5 |
| PTH (pg/ml) | 36.6 ± 19.7 | 6.3 to 98.3 |
| 1,25(OH)2D (n = 92; pg/ml) | 65 ± 17 | 39 to 114 |
For 25-OHD, multiply by 2.496 for nmol/liter. For 1,25(OH)2D, multiply by 2.6 for pmol/liter. For PTH, multiply by 0.105 for pmol/liter.
Fig. 1.
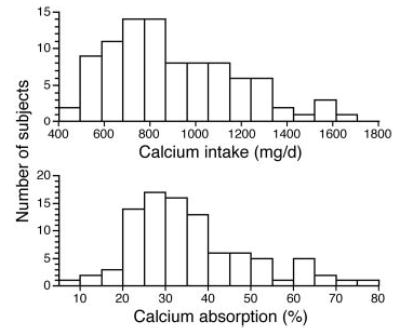
Distribution of calcium intake and absorption (percentage) in 93 study subjects (15 distribution groups).
Fig. 2.
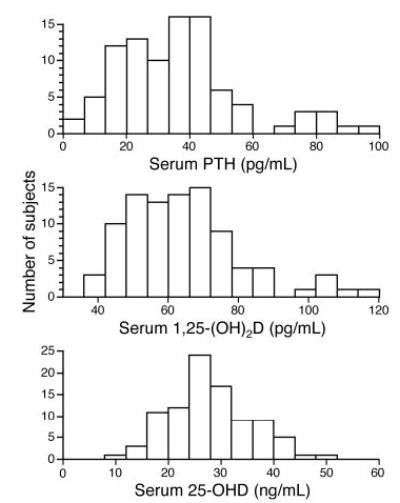
Distributions of serum 25-OHD in 93 study subjects (15 distribution groups), of serum intact PTH in 93 study subjects (15 distribution groups), and of serum 1,25(OH)2D in 92 study subjects (15 distribution groups) are shown. For 5-OHD, multiply by 2.496 for nanomoles per liter; for 1,25(OH)2D, multiply by 2.6 for picomoles per liter; and for PTH, multiply by 0.105 for picomoles per liter.
Of the 93 subjects, one had a serum 25-OHD level less than 12 ng/ml (1.1%), 15 had serum 25-OHD levels less than 20 ng/ml (16.1%), and 68 had serum 25-OHD levels less than 32 ng/ml (73.1%). The PTH level was greater 50 pg/ml in 18 subjects (19.4%) and more than 80 pg/ml in five subjects (5.4%).
The ethnic distribution was 48 Caucasians, 13 African-Americans, 22 Hispanics, and 10 Asians. There were 47 females and 46 males. Nine subjects were Tanner stage 2, 40 were Tanner 3, 39 were Tanner 4, and five were Tanner 5. Of the 47 girls, 16 had reached menarche by the time of the study. One female Hispanic subject did not have enough serum for 1,25(OH)2D measurement, so the covariate analysis had n = 92. A small number of missing values for serum osteocalcin, N-telopeptide, or alkaline phosphatase activity are noted in the data results.
PTH
In analyzing the relationship between vitamin D status and serum PTH, we included as covariates Fok1 genotype, gender, Tanner stage (breast/penile), ethnicity, season of measurement (2-month intervals), and randomization to ITF compared with control. Entering both serum 25-OHD and 1,25(OH)2D in the analysis showed that 25-OHD was significantly inversely correlated to PTH (P = 0.003; η-squared = 0.11), whereas 25(OH)2D was positively associated with PTH (P = 0.03; η-squared = 0.07). No other variable was significantly related to PTH (P > 0.1). Of particular note was the lack of a significant effect of ethnicity (P = 0.26) and gender (P = 0.28) on PTH. Figure 3A shows the linear relationship between serum 25-OHD and PTH.
Fig. 3.
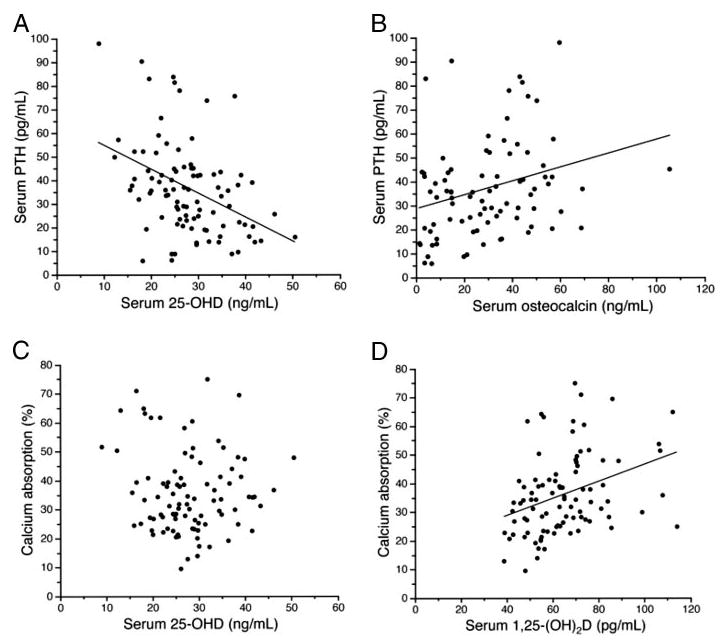
A, Linear regression of serum 25-OHD and PTH: n = 93; y = −1.01 × x + 64.7; se of slope, 0.24; r = −0.41; P < 0.001. For 5-OHD, multiply by 2.496 for nanomoles per liter; for PTH, multiply by 0.105 for picomoles per liter. B, Linear regression of serum osteocalcin and PTH; n = 85, y = 0.28*x +28.3, se of slope = 0.10, r = 0.29, P = 0.008. For PTH, multiply by 0.105 for picomoles per liter. C, Linear regression of serum 25-OHD and calcium absorption (percentage): n = 93; r = 0.073; P = 0.49. For 25-OHD levels, less than 25 ng/ml (n = 35); y = −1.69 × x + 72.1; se of slope = 0.60; r = −0.45; P = 0.009. For 25-OHD, multiply by 2.496 for nanomoles per liter. D, Linear regression of 1,25(OH)2D and calcium absorption (percentage): y = 0.30 × x + 18.0; se of slope, 0.084; r = 0.35; P = 0.001. For 1,25(OH)2D, multiply by 2.6 for picomoles per liter.
Using the logarithmic transformation for serum PTH and comparing it to the nontransformed values for 25-OHD and 1,25(OH)2D, similar results were obtained, except that only 25-OHD, not 1,25(OH)2D, was significantly related to PTH (Table 2). Evaluating the relationship between 25-OHD and PTH using an exponential curve produced no improvement in fit, and the r value decreased from 0.40 to 0.36 when comparing the linear to the exponential fit.
TABLE 2.
Interrelationship of PTH, calcium absorption fraction, and vitamin D in study subjects evaluated using multiple regression analysis
| Dependent variable | Independent variable | Regression coefficient | 95% CI | η2 | P value |
|---|---|---|---|---|---|
| Serum PTHa | 25-OHD | −0.998 | −1.651 to −0.344 | 11.1 | 0.003 |
| 1,25(OH)2D | 0.306 | 0.036 to 0.576 | 6.5 | 0.03 | |
| LogPTHb | 25-OHD | −0.031 | −0.050 to −0.011 | 11.5 | 0.003 |
| 1,25(OH)2D | 0.006 | −0.002 to 0.015 | 0.12 | ||
| 25-OHDc | PTH | −0.111 | −0.184 to −0.38 | 11.1 | 0.003 |
| Calcium absorption fraction fractiond | PTH | 0.195 | 0.054 to 0.335 | 9.6 | 0.007 |
| 1,25(OH)2D | 0.171 | 0.002 to 0.34 | 5.3 | 0.048 | |
| 25-OHD | −0.064 | −0.496 to 0.368 | 0.77 |
Covariates in all analysis were Fok1 genotype, gender, Tanner stage (breast/penile), ethnicity, season of measurement (2-month intervals), and randomization to inulin-type fructan compared with control.
All other covariates, P > 0.2; ITF, P = 0.70.
Natural logarithm of PTH. All other covariates P > 0.2; ITF, P = 0.38.
Other significant cofactors were season (P = 0.002), ethnicity (P = 0.012). ITF was not significant (P = 0.36), and 1,25(OH)2D was not significant (P = 0.23).
Calcium intake is included as a covariate in this model. Significant cofactors were season (P = 0.018), Tanner stage (P = 0.002), and inulin-type fructan (P = 0.006).
If serum osteocalcin is added to this analysis, using the same covariates as before, it was highly significantly positively related to PTH (P < 0.001; η-squared = 0.18; n = 85). If total alkaline phosphatase was used instead of osteocalcin, it was not significantly related to PTH (P = 0.23), nor was serum N-telopeptide (n = 83; P = 0.09). Using logarithmic transforms resulted in similar results. The linear relationship between PTH and osteocalcin is shown in Fig. 3B.
25-OHD concentration
Using a model identical with that used for PTH, except with 25-OHD as the outcome variable, significant predictors of 25-OHD were ethnicity (P = 0.012; η-squared = 0.14), season (P = 0.002; η-squared = 0.23), and PTH (P = 0.003; η-squared = 0.11). Adding osteocalcin to this relationship showed that it was not a predictor of 25-OHD level (P = 0.94), nor was 1,25(OH)2D (P = 0.23). Using logarithmic transforms led to virtually identical results.
Fractional absorption of calcium
Covariates in analyses included ITF, Fok1 genotype, gender, Tanner stage, ethnicity, calcium intake, and season of measurement. Effects of 25-OHD, 1,25(OH)2D, and PTH were considered. PTH, ITF, season, and Tanner stage each was positively significantly related to absorption (Table 2). None of the other factors, including calcium intake (P = 0.08) and 25-OHD (P = 0.77), was not significant. Adding osteocalcin was not significant (P = 0.93; n = 85), nor was N-telopeptide (P = 0.72; n = 83). The use of logarithmic values for 25-OHD, PTH, or both did not change the variables that were significantly related to calcium absorption. The linear relationship between fractional absorption of calcium and both 25-OHD and 1,25(OH)2D are shown in Fig. 3, C and D.
We evaluated the interaction of serum 25-OHD with PTH in determining calcium absorption fraction. This interaction was statistically significant (P = 0.0006) with the covariates of ITF, Fok1 genotype, gender, Tanner stage, ethnicity, calcium intake, and season of measurement. Because of this significance, we evaluated various cutoff values for serum 25-OHD to determine whether lower values would lead to a significant effect of 25-OHD on calcium absorption. Using the same covariates, evaluation of those subjects (n = 35) with 25-OHD levels below 25 ng/ml showed a significant negative relationship between 25-OHD and fractional calcium absorption, with a slope of −1.6 [95% confidence interval (CI), −2.9 to −0.2; P = 0.02]. PTH remained significantly positively related to calcium absorption for this small subgroup (slope, 0.27; 95% CI, 0.01–0.52; P = 0.04). For those subjects (n = 58) with 25-OHD levels greater than 25 ng/ml, neither 25-OHD (P = 0.67) nor PTH (P = 0.11) was significantly related to calcium absorption. Cutoff values of 20 and 32 ng/ml did not lead to significant effects of 25-OHD on calcium absorption.
There was no significant interaction of calcium intake and either serum PTH or 25-OHD in determining calcium absorption. No cutoff values for calcium intake or 25-OHD were found for which calcium intake was significantly related to fractional absorption.
The effect of ITF on calcium absorption results was evaluated by considering the relationship between fractional absorption of calcium and PTH in both subjects who did and who did not receive ITF. In a limited model including 25-OHD, calcium intake, and Tanner stage for those receiving ITF (n = 47), PTH was positively associated with absorption fraction (slope, 0.28; 95% CI, 0.06–0.50; P = 0.01) and was not associated with serum 25-OHD (P = 0.32). For those (n = 45) who did not receive ITF, PTH was positively associated with absorption fraction (slope, 0.28; 95% CI, 0.06–0.50; P = 0.01) and was not associated with 25-OHD (P = 0.36).
Bone mineral mass
Multiple models were evaluated to consider any relationship between serum 25-OHD, 1,25(OH)2D, or PTH and total body BMC or total body BMD. None of these models suggested a significant relationship between the biochemical values and bone mineralization. For example, evaluating whole body BMD using as covariates genotype, gender, Tanner stage, ethnicity, season of measurement, ITF, weight, 25-OHD, 1,25(OH)2D, and PTH, only weight (P < 0.001) and genotype (P = 0.048) were significant. Serum 25-OHD (P = 0.12), 1,25(OH)2D (P = 0.86), and PTH (P = 0.38) were not significantly related to total body BMD. Using the same model, only weight was significantly correlated to lumbar spine BMC (P < 0.001), and weight and gender correlated to lumbar spine BMC. Substituting the weight z-score for weight in the regression analyses did not substantially change these relationships.
For lumbar spine BMD, there was a trend toward a negative relationship with PTH (P = 0.07; slope = −0.002; 95% CI, −0.003–0.000). If weight z-score is substituted for weight in this relationship, lumbar spine BMD was significantly negatively related to serum PTH (P = 0.04; slope, −0.002; 95% CI, −0.004–0.000); gender, Tanner stage, and weight also were significant in this relationship. Regardless of whether PTH was included in the regression, serum 25-OHD was not related to lumbar spinal BMD.
Discussion
We have shown that during peak pubertal growth and bone formation, low levels of 25-OHD are associated with increased PTH and subsequently increased serum 1,25(OH)2D. The net effect of these changes is to increase calcium absorption, so there is no direct relationship between serum 25-OHD and calcium absorption. The independent effects of serum osteocalcin and 25-OHD in predicting PTH suggest that rapid bone-forming activity during midpuberty and low vitamin D status both contribute to a rise in PTH to meet calcium needs. Our results also suggest that during peak pubertal growth, variations in vitamin D status and PTH do not directly affect total body bone mineral mass as do bodyweight and genetic factors, although a small affect of PTH level on lumbar spinal BMD was seen. However, it is important to note that virtually none of our subjects had a serum 25-OHD level less than 12 ng/ml, which in children is often associated with clinical rickets or osteomalacia (9, 10). Calcium intake was not a significant determinant of calcium absorption, probably due to the relatively narrow range of intake.
The results of this study, demonstrating a lack of a significant relationship between serum 25-OHD level and calcium absorption, differ substantially from the relationships found in adults (11), but are consistent with our previous report of smaller population groups of children and adolescents (12, 13). In 1995, we reported calcium absorption in a group of 70 African-American and non-Hispanic Caucasian girls (12). Data also were available for serum 25-OHD in those subjects, but were not published in that paper. We have reanalyzed that data (using calcium intake, ethnicity, and Tanner stage as covariates) and found no relationship between serum 25-OHD and fractional calcium absorption (P = 0.96). Excluding the covariates showed a trend toward a negative relationship (r = −0.22; P = 0.07) between serum 25-OHD and fractional calcium absorption. These results are similar to the findings of a significant negative relationship between serum 25-OHD and calcium absorption in the current study when limited to the subjects with serum 25-OHD levels less than 25 ng/ml. In a subgroup of 42 girls from that 1995 study (13), we reported a significant correlation between serum 1,25(OH)2D and fractional calcium absorption (r = 0.36; P = 0.02). PTH was not assessed in that study.
A second dataset evaluated Caucasian and Hispanic 7- and 8-yr-old girls (13). In this case we did not find a significant relationship between 25-OHD levels and PTH levels. Furthermore, no significant relationship was found between calcium absorption and serum 1,25(OH)2D, 25-OHD, or PTH. However, all subjects in that report were prepubertal, which might explain the reason for the differences in results between those data and the results of this study, because bone-forming activity is much lower during the prepubertal period (14–17).
An inverse relationship between 25-OHD values and PTH has been shown in adolescents in Boston; 42% of the adolescents had serum 25-OHD levels below 20 ng/ml (9). No specific consequences of the low vitamin D levels or increased PTH concentrations were reported.
Lower bone mineralization was found in early adolescent (10- to 12-yr-old) girls in Finland with low serum 25-OHD or high PTH levels (4). Effects were seen primarily in girls with serum 25-OHD levels below 10 ng/ml, a level rarely seen in our studies of children in Houston and uncommon in Boston subjects (9). A second longitudinal study of Finnish girls showed a 4% lower increment in lumbar spinal BMD over 3 yr in young adolescent girls with very low serum 25-OHD (<8 ng/ml) compared with those with serum 25-OHD levels greater than 15 ng/ml (18). PTH was not reported in that cohort.
These two studies from Finland (4, 18) are consistent with our finding of a marginally significant negative relationship between serum PTH (but not 25-OHD) and lumbar spinal BMD. During pubertal growth, spinal BMD may be particularly sensitive to trabecular bone growth, which may account for our finding of a PTH relationship at that site, but not for total body BMD. The greater 25-OHD values in our population relative to the Finnish studies may have limited our ability to identify an effect of low 25-OHD on BMC or BMD values.
Notably, an inverse relationship between serum 25-OHD and PTH is seen in adults, especially for those with serum 25-OHD levels less than 32 ng/ml (1). In adults, an exponential relationship has been described, with a lower PTH plateau value of 36 pg/ml reached at a 25-OHD value of 31 ng/ml (19). However, that analysis involved more than 1500 subjects, far more than we have available with our database. Our data do not show improvement in fit using an exponential, rather than linear, model to relate PTH to serum 25-OHD. An exponential fit of our data provides a value of 25-OHD of 23 ng/ml for the adult plateau PTH value of 36 pg/ml. The exponential slope of our data was also lower than that in adults (−0.044 in adults vs. −0.011 in our data using 25-OHD expressed as nanomoles per liter) (19). Together, these findings suggest suppression of PTH in our subjects at lower 25-OHD levels and a smaller exponential increase in PTH at low 25-OHD in adolescents compared with adults.
Few other studies have evaluated the relationship between 25-OHD and calcium absorption in older children or adolescents. Northern Chinese children, aged 9–16 yr, had an inverse relationship between calcium absorption and 25-OHD (20), similar to our findings. Those children had low usual daily calcium intakes. In Nigerian toddlers with extremely low calcium intake, we found no significant relationship between fractional calcium absorption and 25-OHD (21).
Data for adults (11) indicate an essentially linear increase in calcium absorption fraction associated with serum 25-OHD levels less than 32 ng/ml. Most authorities now consider a serum 25-OHD level of 32 ng/ml or more as optimal for adults (22). An approximate doubling of absorption fraction between levels of 12 and 32 ng/ml is reported. Therefore, our data indicate that children and adolescents adapt to a suboptimal vitamin D status more readily than adults. The difference might be due to enhanced responsiveness of absorption efficiency to 1,25(OH)2D, increased utilization of non-vitamin D-dependent calcium absorption, or increased conversion of 25-OHD to 1,25(OH)2D. The suggestion of a negative correlation between 25-OHD and calcium absorption at moderately low levels of 25-OHD supports the idea of preferential adaptation in adolescents. Vitamin D deficiency, as evidenced by low 25-OHD levels, might not be present for as long a time in children as in adults, especially in the elderly.
Based on bone mineral mass data (4, 17) and case reports of clinical rickets, it is likely that severe vitamin D deficiency (levels <12 ng/ml), especially if calcium intake is low, poses serious short- and long-term health problems for children and adolescents of all ages (10).
Our results must be viewed especially cautiously given our location in a southern climate, where few children have 25-OHD levels less than 12 ng/ml. Adaptation of calcium absorption to marginal vitamin D status might be inadequate in children and adolescents under conditions that include 1) unfavorable vitamin D receptor genotype or other genetic factors; 2) extremely low intake of calcium (e.g. <600 mg/d); 3) northern climate or extreme avoidance of skin exposure to sunlight, which also might lead to larger alterations in PTH and resultant lower rates of bone mineral mass accumulation, especially at trabecular bone sites; and 4) physiological stresses, including pregnancy or bone fractures. We did not evaluate other age groups in this study.
In summary, we found an inverse relationship between serum 25-OHD levels and PTH levels in peak pubertal adolescents in Houston, with a high incidence of suboptimal vitamin D status. However, we found no evidence that these levels impaired calcium absorption. The high levels of vitamin D supplementation probably needed to achieve serum 25-OHD levels greater than 32 ng/ml in most adolescents should be evaluated in a controlled trial before being recommended.
Acknowledgments
We acknowledge the assistance of the nursing staff of the General Clinical Research Center of Texas Children’s Hospital for caring for the study subjects; Cynthia Edwards for study recruitment; Holly Endris, Melissa Knox, Courtney Edwards, Lora Plumlee, Yana Kriseman, Rachel Wolfson, Michelle Lopez, and Anh Mai for subject assistance; Lily Liang and Bruce Ellis for laboratory assistance; Kenneth Ellis, Ph.D., and Roman Shypailo for body composition measurements; and Marlane Kayfes for editorial assistance. The inulin-type fructans was Raftilose Synergy1 provided by Orafti, N.V. (Tienen, Belgium).
Footnotes
This work is a publication of the U.S. Department of Agriculture/Agricultural Research Service Children’s Nutrition Research Center, Department of Pediatrics, Baylor College of Medicine and Texas Children’s Hospital (Houston, TX). This project has been supported in part by federal funds from the U.S. Department of Agriculture/Agricultural Research Service under Cooperative Agreement 58-6250-6-001, the National Institutes of Health, National Center for Research Resources General Clinical Research for Children Grant RR-00188, National Institutes of Health Grant AR-43740 (to S.A.A.), and Grant HD-K24-01288 (to T.O.C.). The contents of this publication do not necessarily reflect the views or policies of the U.S. Department of Agriculture, nor does mention of trade names, commercial products, or organizations imply endorsement by the U.S. government.
References
- 1.Heaney RP. Functional indices of vitamin D status and ramifications of vitamin D deficiency. Am J Clin Nutr. 2004;80(Suppl):1706S–1709S. doi: 10.1093/ajcn/80.6.1706S. [DOI] [PubMed] [Google Scholar]
- 2.Abrams SA. Nutritional rickets: an old disease returns. Nutr Rev. 2002;60:111–115. doi: 10.1301/00296640260085840. [DOI] [PubMed] [Google Scholar]
- 3.Outila TA, Karkkainen MU, Lamberg-Allardt CJ. Vitamin D status affects serum parathyroid hormone concentrations during winter in female adolescents: associations with forearm bone mineral density. Am J Clin Nutr. 2001;74:206–210. doi: 10.1093/ajcn/74.2.206. [DOI] [PubMed] [Google Scholar]
- 4.Cheng S, Tylavsky F, Kroger H, Karkkainen M, Lyytikainen A, Koistinen A, Mahonen A, Alen M, Halleen J, Vaananen K, Lamberg-Allardt C. Association of low 25-hydroxyvitamin D concentrations with elevated parathyroid hormone concentrations and low cortical bone density in early pubertal and prepubertal Finnish girls. Am J Clin Nutr. 2003;78:485–492. doi: 10.1093/ajcn/78.3.485. [DOI] [PubMed] [Google Scholar]
- 5.Abrams SA, Griffin IJ, Hawthorne KM, Chen Z, Gunn SK, Wilde M, Darlington G, Shypailo R, Ellis K. Vitamin D receptor Fok1 polymorphisms affect calcium absorption, kinetics and bone mineralization rates during puberty. J Bone Miner Res. 2005;20:945–953. doi: 10.1359/JBMR.050114. [DOI] [PubMed] [Google Scholar]
- 6.Abrams SA, Griffin IJ, Hawthorne KM, Liang L, Gunn SK, Darlington G, Ellis KJ. A combination of prebiotic short-and long-chain inulin-type fructans enhances calcium absorption and bone mineralization in young adolescents. Am J Clin Nutr. 2005;82:471–476. doi: 10.1093/ajcn.82.2.471. [DOI] [PubMed] [Google Scholar]
- 7.Gundberg CM, Nieman SD, Abrams S, Rosen H. Vitamin K status and bone health: an analysis of methods for determination of undercarboxylated osteocalcin. J Clin Endocrinol Metab. 1998;83:3258–3266. doi: 10.1210/jcem.83.9.5126. [DOI] [PubMed] [Google Scholar]
- 8.Pierce CA, Block RA, Aguinis H. Cautionary note on reporting eta-squared values from multifactor ANOVA designs. Educ Psychol Meas. 2004;64:916–924. [Google Scholar]
- 9.Gordon CM, DePeter KC, Feldman HA, Grace E, Emans SJ. Prevalence of vitamin D deficiency among healthy adolescents. Arch Pediatr Adolesc Med. 2004;158:531–537. doi: 10.1001/archpedi.158.6.531. [DOI] [PubMed] [Google Scholar]
- 10.Institute of Medicine (U.S.). Standing Committee on the Scientific Evaluation of Dietary Reference Intakes 1997 DRI, Dietary Reference Intakes: for calcium, phosphorus, magnesium, vitamin D, and fluoride. Washington DC: National Academy Press
- 11.Heaney RP, Dowell MS, Hale CA, Bendich A. Calcium absorption varies within the reference range for serum 25-hydroxyvitamin D. J Am Coll Nutr. 2003;22:142–146. doi: 10.1080/07315724.2003.10719287. [DOI] [PubMed] [Google Scholar]
- 12.Abrams SA, Copeland KC, Gunn SK, Gundberg CM, Klein KO, Ellis KJ. Calcium absorption, bone mass accumulation, and kinetics increase during early pubertal development in girls. J Clin Endocrinol Metab. 2000;85:1805–1809. doi: 10.1210/jcem.85.5.6508. [DOI] [PubMed] [Google Scholar]
- 13.Abrams SA, O’Brien KO, Liang LK, Stuff JE. Differences in calcium absorption and kinetics between black and white girls age 5–16 years. J Bone Miner Res. 1995;10:829–833. doi: 10.1002/jbmr.5650100521. [DOI] [PubMed] [Google Scholar]
- 14.Bronner F, Abrams SA. Development and regulation of calcium metabolism in healthy girls. J Nutr. 1998;128:1474–1480. doi: 10.1093/jn/128.9.1474. [DOI] [PubMed] [Google Scholar]
- 15.Abrams SA, Copeland KC, Gunn SK, Stuff JE, Clarke LL, Ellis KJ. Calcium absorption and kinetics are similar in 7- and 8-year-old Mexican-American and Caucasian girls despite hormonal differences. J Nutr. 1999;129:666–671. doi: 10.1093/jn/129.3.666. [DOI] [PubMed] [Google Scholar]
- 16.Abrams SA. Normal acquisition and loss of bone mass. Horm Res. 2003;60(Suppl 3):71–76. doi: 10.1159/000074505. [DOI] [PubMed] [Google Scholar]
- 17.Szulc P, Seeman E, Delmas PD. Biochemical measurements of bone turnover in children and adolescents. Osteoporos Int. 2000;11:281–294. doi: 10.1007/s001980070116. [DOI] [PubMed] [Google Scholar]
- 18.Lehtonen-Veromaa MKM, Mottonen TT, Nuotio IO, Irjala KMA, Leino AE, Viikari JSA. Vitamin D and attainment of peak bone mass among peripubertal Finnish girls: a 3-y prospective study. Am J Clin Nutr. 2002;76:1446–1453. doi: 10.1093/ajcn/76.6.1446. [DOI] [PubMed] [Google Scholar]
- 19.Chapuy MC, Preziosi P, Maamer M, Arnaud S, Galan P, Hercberg S, Meunier PJ. Prevalence of vitamin D insufficiency in an adult normal population. Osteop Int. 1997;7:439–443. doi: 10.1007/s001980050030. [DOI] [PubMed] [Google Scholar]
- 20.Lee WT, Cheng JC, Jiang J, Hu P, Hu X, Roberts DC. Calcium absorption measured by stable calcium isotopes (42Ca, 44Ca) among northern Chinese adolescents with low vitamin D status. J Orthop Surg. 2002;10:61–66. doi: 10.1177/230949900201000111. [DOI] [PubMed] [Google Scholar]
- 21.Graff M, Thacher TD, Fischer PR, Stadler D, Pam SD, Pettifor JM, Isichei CO, Abrams SA. Calcium absorption in Nigerian children with rickets. Am J Clin Nutr. 2004;80:1415–1421. doi: 10.1093/ajcn/80.5.1415. [DOI] [PubMed] [Google Scholar]
- 22.Hollis BW. Circulating 25-hydroxyvitamin D levels indicative of vitamin D sufficiency: implications for establishing a new effective dietary intake recommendation for vitamin D. J Nutr. 2005;135:317–322. doi: 10.1093/jn/135.2.317. [DOI] [PubMed] [Google Scholar]