Abstract
We report a new molecular contrast optical coherence tomography (MCOCT) implementation that profiles the contrast agent distribution in a sample by measuring the agent’s spectral differential absorption. The method, spectra triangulation MCOCT, can effectively suppress contributions from spectrally dependent scatterings from the sample without a priori knowledge of the scattering properties. We demonstrate molecular imaging with this new MCOCT modality by mapping the distribution of indocyanine green, a FDA-approved infrared red dye, within a stage 54 Xenopus laevis.
A hybrid imaging modality that can combine the contrast-agent specificity of fluorescence microscopy1 techniques with the higher spatial resolution and depth penetration of optical coherence tomography2,3 (OCT) will dramatically enhance the capability of clinicians and biomedical researchers to track chemical changes within patients and experimental subjects. The recognition of this fact has prompted several research groups to implement various modified OCT schemes that have the capability to detect specific contrast agents (chemical4 and otherwise5).
In this Letter we present what is believed to be the first molecular contrast optical coherence tomography (MCOCT) implementation, spectral triangulation MCOCT, that is capable of profiling the distribution of a FDA-approved dye, indocyanine green (ICG), within a target sample. Our method opens up the possibility of performing contrast-based imaging through whole small animals and potentially extends the imaging capability of existing clinical procedures that involve the use of ICG.6
Spectroscopic OCT methods7,8 that yield spectrally resolved images represent the first attempts at extracting the distribution of absorptive chemical–biochemical species. However, the lack of compensation for turbidity variation within the samples can lead to significant artifacts in rendering contrast distribution images for biological samples. Our method, spectral triangulation MCOCT, is a significant enhancement of spectroscopic OCT in that it corrects for any significant spectral variation of the sample’s turbidity up to the first order without a priori knowledge of the variation.
The spectral triangulation MCOCT method is based on acquiring three consecutive OCT pixels, A-scans, or B-scans at evenly spaced wavelength intervals. One of the scans is collected at a mean wavelength that closely matches the absorption maximum wavelength of the target contrast agent, while the other two scans are taken at wavelengths above and below this absorption maximum. By analyzing the three scans with a triangulation algorithm, we extract an OCT signal that resolves the depth of the differential absorption profile of the sample that corresponds to the cumulative distribution of the contrast agent within the sample.
Mathematically, the detected OCT signal for a specific sample depth and center wavelength is given by
| (1) |
where PRo is the collected reference-arm power, PSo is the collected signal-arm power if the sample is fully reflective, R(λ, z) is the sample reflectivity at depth z, and lc is the OCT coherence length. The additional exponential term accounts for the loss of collected light due to absorption [modeled by the absorption coefficient μa(λ, z′)] and scattering [modeled by the scattering coefficient μs(λ, z′)]. We simplify the expression by restricting our analysis of the OCT images to a spatial resolution that is no less than the coherence length.
We next define a new parameter S(z) based on three OCT scans at different wavelengths ((λ1, λ2, λ3):
| (2) |
where Δμa(z′) = ½ μa(λ1, z′) + ½ μa(λ3, z′) − μa(λ2, z′). The approximation is derived by making the reasonable assumptions that only the zeroth-order and the linear terms of the Taylor series spectral expansions of μs(λ, z′) and R(λ, z) are significant. If the wavelength range is chosen to appropriately span a spectral absorption maximum, we can maximize the detected contrast, Δμa(z′), in the sample. The ability of this method to eliminate the first-order spectral variation contribution of the surrounding turbidity is particularly important, as the contribution is not negligible and was previously shown to skew spectroscopic OCT images.7,8
We can further process the image to unwrap the integration in Eq. (2) and obtain the depth-resolved (rather than depth-integrated) location of the differential absorption change:
| (3) |
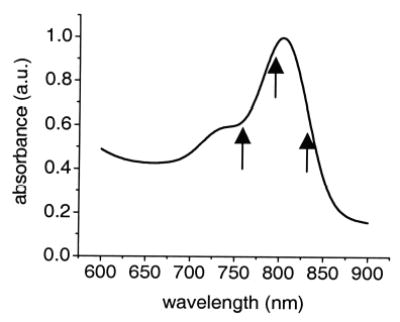
In a proof-of-principle demonstration, we chose ICG, a dye commonly used in clinical hepatic function tracking9 and fluorescence angiography,6 as our targeted contrast agent. This dye has a well-characterized absorption spectrum that peaks at ~790 nm and a FHWM of 60 nm (see Fig. 1).
Fig. 1.

Absorption spectrum of ICG. The arrows indicate the center wavelengths at which we acquired our MCOCT images.
The imaging setup employed was a standard Michelson interferometer system. A tunable Ti:sapphire laser with a FHWM linewidth of 11 nm (calculated coherence length of 25 μm) serves as the OCT light source. The light was split at a beam splitter. One part at power PRo was retroref lected by a corner cube mounted on a scanning galvanometer scanner and served as a reference light beam. The scanner created a Doppler frequency upshift of 40 kHz on the ref lected reference beam. The remainder of the light, PSo, (~100 μW) was focused (Newport M-20X objective) onto a target sample, and the backscattered light (signal) was recoupled back into the interferometer. The FWHM of the focal spot on the sample was 6.9 μm, and the depth of focus was 124 μm. The combined ref lected reference and backscattered light was detected, processed by a lock-in amplifier, and acquired by a computer. The system acquired 2-mm optical path length A-scans at a rate of approximately 5 Hz. The Ti:sapphire was tuned between each OCT image acquisition to generate the three OCT image sets at regular wavelength intervals: 760, 795, and 830 nm.
The sample was a 1-mm-thick capillary filled with 200-μM concentration of ICG in a scattering medium (0.25% volume concentration suspension of 0.1-μm microspheres) inserted within a glass cuvette that contained only the scattering medium. The highly dispersive medium had a wavelength-dependent scattering coefficient ranging from 0.68 to 1.01 mm−1 for the imaging wavelength range.
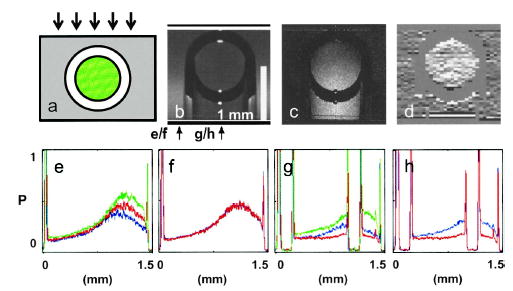
Figure 2e shows the averaged A-scans at the three wavelengths extracted at the location indicated by the arrow labeled e/f in Fig. 2b. The contrast agent is not present in the scan region [μa(λ, xs) = 0]; the difference in the three A-scans is due to the spectral difference in μs(λ, xs). The good match of the two curves in Fig. 2f, which correspond to the numerator and the denominator of Eq. (2), demonstrates the strength of the algorithm to correct for most of the spectral variation in scattering. Figure 2g shows the corresponding averaged A-scans from a location that matches the capillary’s position (see the location indicated by the arrow labeled g/h in Fig. 2b). The difference in the processed signal in Fig. 2h can be completely attributed to the absorptive contribution of the contrast agent. Figure 2c shows the processed B-scan plotting the value of S(z). The presence of the contrast agent within the capillary and its shadowing effect on light transmitted through the capillary is clearly evident. By performing the additional unwrapping processing, we can further localize the contrast agent’s presence to within the capillary (see Fig. 2d). The measured μa was 0.19 mm−1. The calculated ICG concentration was 70 μM, whereas the actual ICG concentration used was 200 μM. The discrepancy can be attributed to the possible adherence of dye molecules to the microspheres and the subsequent catalytic formation of multimers, which have different absorption spectra.
Fig. 2.

a, Cross section of the target sample; the arrows indicate probe light direction, green represents the location of the ICG and the scattering medium, and the surrounding gray region represents the scattering medium. b, OCT image at 795 nm (average of 300 scans); the arrows locate line traces for Figs. 1(e)–1(h). The imaging focal plane is near the bottom of the capillary tube. c, Contrast image created by using the image processing method described in Eq. (2). d, Unwrapped contrast image based on processing described in Eq. (3). e and g, OCT A-scans at different wavelengths (green, 760 nm; red, 795 nm; blue, 830 nm). f and g, Processed scans corresponding to the numerator (blue) and the denominator (red) of Eq. (2). The vertical scales for e–h are normalized to unity.
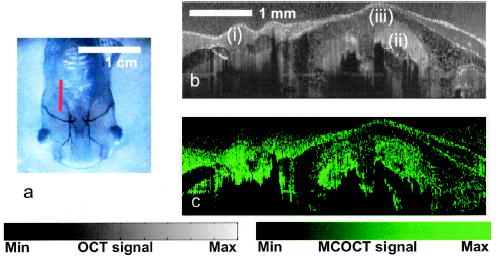
To demonstrate contrast-agent detection capability in an animal model, we injected a mixture of 400-μM ICG and 0.25% volume concentration 0.1-μm latex microspheres into the gill arch cavities and the peribranchial cavity of a euthanized stage 54 Xenopus laevis tadpole. B-scans of the animal were acquired sequentially at three wavelengths (760, 795, and 830 nm) from the location depicted by a red line in Fig. 3a. A sample size of 30 repeats was acquired over 1.5 h. The data set was processed, and the distribution of S(z) is shown in Fig. 3b. The localization of ICG within the gill arches and peribranchial cavity is clearly evident in the derived cumulative ICG distribution image. The expected absence of ICG from within the gill tissues and beyond the opercular fold agrees well with the lack of signal in the associated regions.
Fig. 3.

a, Ventral view of a stage 54 Xenopus laevis tadpole; the red line indicates the location where images are acquired. b, OCT image of the illuminated regions: (i) parabranchial cavity, (ii) gill arches, (iii) opercular field. (c) Spectral triangulation MCOCT contrast image of the same region.
The MCOCT image in Fig. 3b is notable for its penetration depth (~2 mm) and resolution (25 μm axial and 9 μm lateral). It represents what is to our knowledge the first demonstration of an OCT-based scheme to localize and map the distribution of a FDA-approved dye within a biological target. Further, the light intensity used was well within the ANSI safety limit for both ocular and skin exposure.10
The intrinsic absorption of the biological sample is ignored in our analysis. This is because of the wavelength of the scans chosen to optimize the contrast sensitivity of our technique to the applied dye; although it is plausible, it is unlikely in reality that the spectral variation of the intrinsic tissue absorption will have a substantial second-order variation that coincides with that of the introduced dye within the chosen wavelength range.
The compact algorithm described represents an efficient approach for extracting absorptive contrast distribution from the target. A limitation of this technique is the long imaging times needed to average away time variations in the tissue speckle pattern. This can be overcome by using Fourier-domain OCT techniques,11,12 which can permit the rapid and simultaneous acquisition of OCT scans at three different center wavelengths. The elimination of speckle artifacts and the dramatic signal-to-noise improvement of Fourier-domain OCT over conventional OCT by more than 20 dB is predicted to lead to a much shorter acquisition time of ~2 s (Ref. 13) and to greater contrast sensitivity.
Acknowledgments
We thank several colleagues for suggesting the use of ICG as a MCOCT contrast agent, most notably Hubert van den Bergh. This research was supported by National Institutes of Health grant EB000243. C. Yang’s e-mail address is chyang@caltech.edu.
References
- 1.Denk W, Strickler JH, Webb WW. Science. 1990;248:73. doi: 10.1126/science.2321027. [DOI] [PubMed] [Google Scholar]
- 2.Fercher AF. J Biomed Opt. 1996;1:157. doi: 10.1117/12.231361. [DOI] [PubMed] [Google Scholar]
- 3.Schmitt JM. IEEE J Sel Topics Quantum Electron. 1999;5:1205. [Google Scholar]
- 4.Rao KD, Choma MA, Yazdanfar S, Rollins AM, Izatt JA. Opt Lett. 2003;28:340. doi: 10.1364/ol.28.000340. [DOI] [PubMed] [Google Scholar]
- 5.Lee TM, Oldenburg AL, Sitafalwalla S, Marks DL, Luo W, Toublan FJJ, Suslick KS, Boppart SA. Opt Lett. 2003;28:1546. doi: 10.1364/ol.28.001546. [DOI] [PubMed] [Google Scholar]
- 6.Stanga PE, Lim JI, Hamilton P. Ophthalmology. 2003;110:15. doi: 10.1016/s0161-6420(02)01563-4. [DOI] [PubMed] [Google Scholar]
- 7.Morgner U, Drexler W, Kartner FX, Li XD, Pitris C, Ippen EP, Fujimoto JG. Opt Lett. 2000;25:111. doi: 10.1364/ol.25.000111. [DOI] [PubMed] [Google Scholar]
- 8.Faber DJ, Mik EG, Aalders MCG, van Leeuwen TG. Opt Lett. 2003;28:1436. doi: 10.1364/ol.28.001436. [DOI] [PubMed] [Google Scholar]
- 9.Zipprich A, Steudel N, Behrmann C, Meiss F, Sziegoleit U, Fleig WE, Kleber G. Hepatology. 2003;37:385. doi: 10.1053/jhep.2003.50065. [DOI] [PubMed] [Google Scholar]
- 10.American National Standards Institute, ANSI Z 136 (Laser Institute of America, Orlando, Fla., 2000).
- 11.Fercher AF, Hitzenberger CK, Kamp G, Elzaiat SY. Opt Commun. 1995;117:43. [Google Scholar]
- 12.Wojtkowski M, Leitgeb R, Kowalczyk A, Bajraszewski T, Fercher AF. J Biomed Opt. 2002;7:457. doi: 10.1117/1.1482379. [DOI] [PubMed] [Google Scholar]
- 13.Choma MA, Sarunic M, Yang C, Izatt JA. Opt Express. 2003;11:2183. doi: 10.1364/oe.11.002183. http://www.opticsexpress.org. [DOI] [PubMed] [Google Scholar]


