Abstract
Near-simultaneous measurements of electrical and mechanical activation over the entire ventricular surface are now possible using magnetic resonance imaging tagging and a multielectrode epicardial sock. This new electromechanical mapping technique is demonstrated in the ventricularly paced canine heart. A 128-electrode epicardial sock and pacing electrodes were placed on the hearts of four anesthetized dogs. In the magnetic resonance scanner, tagged cine images (8–15 ms/frame) and sock electrode recordings (1000 Hz) were acquired under right-ventricular pacing and temporally referenced to the pacing stimulus. Electrical recordings were obtained during intermittent breaks in image acquisition, so that both data sets represented the same physiologic state. Since the electrodes were not visible in the images, electrode recordings and cine images were spatially registered with Gd-DTPA markers attached to the sock. Circumferential strain was calculated at locations corresponding to electrodes. For each electrode location, electrical and mechanical activation times were calculated and relationships between the two activation patterns were demonstrated. This method holds promise for improving understanding of the relationships between the patterns of electrical activation and contraction in the heart.
Keywords: Electrical activation, Mechanical activation, Asynchrony, Heart, MRI, Tagging, Mapping
INTRODUCTION
The relationship between the spatiotemporal pattern of ventricular electrical activation and the pattern and degree of mechanical response is important in evaluating the function of paced and diseased hearts. Ventricular pacing in the normal heart adversely affects function by decreasing stroke volume, contractility, end-diastolic volume, and synchrony of contraction.8,30 In disease states, such as dilated cardiomyopathy or infarction, structural changes in the myocardium may cause an inhomogeneous spread of electrical activation, affecting the synchrony and strength of contraction. By optimizing the sequence of electrical activation, function can be significantly improved in the diseased heart.7,9,21,22,26,35 Additionally, the pattern and timing of myocyte contraction and stretch affect the electrical properties of the tissue.13,40,41 To date, attempts to study these complex relationships in vivo have been limited to low spatial resolution measurements,4 studies over a limited region of the left-ventricular (LV) freewall,12 or techniques that involve data individually sampled with a catheter.23
Several techniques have been applied to map the mechanics of the canine or human heart. Many canine studies utilize markers sewn onto the ventricular epicardium. The motion of the markers is then tracked either using video on the exposed or isolated heart or using fluoroscopy.2,18 While providing data that are generally of high temporal resolution, marker-based techniques are limited in coverage of the ventricular wall. More recently, an electromechanical mapping system has been introduced which utilizes a single, locatable catheter to map the mechanical deformation as well as the electrical activity point by point.23 While this technique has broad clinical applications, it is limited by its inability to collect data from multiple locations at once.
Tagged magnetic resonance imaging (MRI) provides the ability to noninvasively quantify the complete three-dimensional (3D) strain tensor at reasonable temporal resolution by producing a sequence of images in which a pattern of fiducial markers have been fixed to the tissue.24 The markers are created with an electrocardiogram (ECG) or pacing triggered radiofrequency pulse that produces a saturation pattern in the myocardium. The saturation pattern is apparent as a set of initially straight, dark stripes in the images, the deformation of which can then be tracked over the next ~500 ms of the cardiac cycle. By tagging the myocardium in three orthogonal directions and tracking the tag motion through the cardiac cycle, local 3D strain curves at points throughout the entire ventricular myocardium may be generated.11,28,29 This method is used to quantify the magnitude and temporal synchrony of contraction in canine and human studies and to evaluate the efficacy of various interventions.3,25,34,43
In this study, tagged MRI was used to evaluate the time of local mechanical activation at distinct points in the ventricular subepicardium of the paced heart. The sequence of images of each slice of the heart was produced with a “segmented k-space” acquisition technique.24 In this technique, the raw data for each image frame was broken into 64 or 128 segments and the data for each of these segments was acquired over 64 or 128 consecutive heartbeats, respectively. The temporal width of each image frame was dependent on the time required to obtain each segment.
Accurate electrical mapping of the ventricular epicardium requires that electrodes be placed directly on the myocardium. Many canine studies have focused on mapping a portion of the ventricular surface using a plaque or brush of electrodes.10,27,33 An electrode sock, however, is more feasible for simultaneously mapping of the entire ventricular epicardium. Cardiac electrode socks have been used to map the electrical activation in normal and failing canine hearts,14,16,32,42 but these studies have not included analysis of the local mechanical activation.
In our study, we have merged two existing techniques for mechanical and electrical mapping to create a new method for in vivo electromechanical mapping in the canine model. Using tagged MRI, myocardial strain can be calculated throughout the heart over the cardiac cycle. We have developed a method to obtain electrical signals over the entire ventricular epicardium in vivo using a multielectrode cardiac sock while the animal is in the magnetic resonance (MR) scanner. Techniques have been developed to spatially and temporally register these two data sets so that local and global relationships between the electrical and mechanical activation patterns may be evaluated. This method is demonstrated by relating the pattern of epicardial electrical activation to the pattern of sub-epicardial strain under right-ventricular (RV) pacing. This study focused on RV pacing rather than right atrial (RA) pacing or normal sinus rhythm both because it is clinically relevant and because the asynchronous nature of electrical activation under ventricular pacing produces a broad range of electrical and mechanical activation times, better facilitating electromechanical correlation.
MATERIALS AND METHODS
All aspects of this study were conducted in accordance with the guidelines of the Animal Care and Use Committee of the National Heart, Lung, and Blood Institute.
Surgery
Four adult male mongrel dogs weighing 19–31 kg were used in this study. Anesthesia was induced with an initial intravenous injection of thiopental (25 mg/ml at 0.5 ml/kg) and maintained after endotracheal intubation with isoflurane (0.8%–2%, Siemens ventilator, 900D). A median sternotomy was performed, and a pericardial cradle was fashioned. A multi-electrode epicardial sock consisting of a nylon mesh and 128 copper electrodes attached in an ordered fashion was then placed over the ventricular epicardium. The sock was placed in a consistent and predetermined orientation for all experiments and secured with several sutures. Six to eight glass beads (18 μL) filled with an aqueous solution of Gd-DTPA (~ 5 mM) were attached to the sock as localization markers. An MR-compatible pressure catheter (Millar, SPC-350, 5F) was inserted via the right or left carotid artery into the LV chamber. Bipolar epicardial twisted-pair pacing electrodes were sewn onto the RA in all four dogs. Similar electrodes were sewn onto the RV free wall of two dogs; in the other two dogs, RV pacing was accomplished using two sock electrodes. A ground reference electrode was sewn onto the fat pad at the root of the aorta. All sock and pacing wires were run directly out of the chest and the animal was transported to the MR scanner.
Experimental Layout
Inside the scan room, the sock was connected via four disconnect boxes (Black Box, SWL350A-FFF) to 37-pin rf filters (Amphenol, FCC17 series, low pass, 3 dB point at 1 MHz) at the scanner penetration panel (Fig. 1). Outside the scan room, the corresponding outputs were connected, via a customized connection box, to two 64-channel analog to digital converter (A/D) boards (Hewlett-Packard, now Agilent, E1413C). The pressure catheter signal was preamplified at the scanner (Millar, TCB-500) and connected to a third A/D board. The RA and RV pacing leads were connected via photoelectric stimulus isolation units (Grass Instrument Co., PSIU6) to stimulators time synced to each other (Grass Instrument Co., S11 and S88). Pressure and pacing wires were rf filtered at the scanner penetration panel (Mini-Circuits, BLP-1.9, low pass, 3 dB point at 1.9 MHz). All pacing and mapping electrodes were electrically isolated from the penetration panel before reaching the animal to avoid ground loops. The monitor output from one stimulator was connected directly to all three of the A/D boards to be used as a timing reference and as a verification of synchrony of the three boards. A third stimulator output, with an adjustable delay relative to pacing, was connected to the external trigger control for the MR scanner. All A/D boards were connected via FireWire (IEEE 1394) to a computer (Windows NT, 4.0) running data acquisition software (Hewlett-Packard, VEE 5.0).
FIGURE 1.
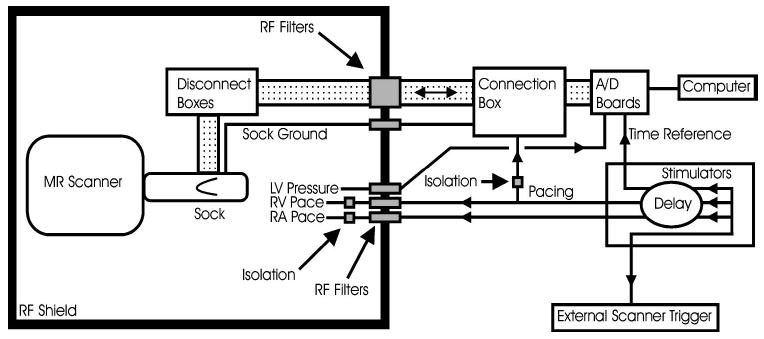
Diagram of experimental layout.
Data Acquisition
RV pacing capture was established at a pacing rate (110–125 bpm) approximately 10%–20% above the intrinsic rate. Pacing current was set to approximately 20% above that needed for capture. Intrinsic electrical activation was suppressed by simultaneously pacing the RA. Tagged cine images were obtained during RV pacing (Fig. 2). Between image acquisitions, unipolar epicardial electrical recordings were obtained.
FIGURE 2.
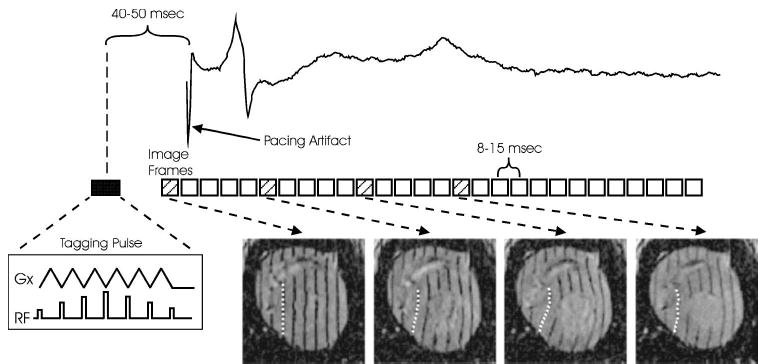
Generalized timing diagram for data acquisition with an example electrogram from an electrode near the RV pacing site. Note that the timing of the first image precedes pacing the heart. A segment of raw data is acquired in each heartbeat, and a full movie sequence of images is assembled after 64–128 beats. Images are acquired with tags in three orthogonal directions; one orientation is shown here. The dashed line in each image represents the tracking of the deformation of one tag through the cardiac cycle.
All scanning was performed on a General Electric Signa CV/i 1.5 T scanner running a modified version of the FastCard pulse sequence. Modifications made to the sequence enabled gating from an external trigger and improved the precision of image time calculations. Parallel-line tagged images were acquired in three orthogonal directions.24 Imaging parameters included time resolution of 8–15 ms, 20 × 20 cm or 24 × 24 cm field of view, 7 mm slice thickness, 7 pixel tag spacing, 1–2 views/segment (VPS), and 256 samples in the frequency direction, which was perpendicular to the tag planes. In the two short axis orientations, 8–9 parallel slices were acquired. In the long axis, nine slices were acquired, radially separated by 20°. All k-space image data were acquired in top-down order and, for 2 VPS acquisitions, were segmented into upper and lower halves. Two of the postsurgery animals were ventilated using high-frequency ventilation at 15 Hz, with images acquired without breathholds. In the other two postsurgery scans, ventilator-induced respiratory motion of the heart necessitated breath holding during image acquisition. In order to view the onset of systole, the scanner trigger was delivered 40–50 ms prior to the pacing signal, initiating imaging in late diastole.
Electrical recordings were obtained at a minimum acquisition rate of 1000 Hz for a duration of approximately 10 s immediately prior to and following the MR scans.5 These recordings were obtained with the animal in the MR scanner. Unipolar signals were electrically referenced to the aortic ground electrode. Pressure and pacing signals were acquired simultaneously with epicardial recordings.
After all in vivo image data and electrical recordings were obtained, the animal was heparinized (5000 U) and then euthanized with a bolus of potassium chloride (4 mEq/kg) while still under general anesthesia. Without moving the animal, the heart was then scanned with T1-weighted two-dimensional (2D) imaging (1.5–5 mm/slice, 20 × 20 or 24 × 24 cm field of view) in three orthogonal directions in order to locate the Gd-DTPA filled localization markers in the tagged image coordinate system (scanner coordinates) (Fig. 3). After imaging, the heart was excised with the sock still in place. The coronary arteries were then perfused from the aorta with isotonic saline at 50–60 mm Hg to induce tissue turgor, and the heart was submerged in an isotonic saline bath to reduce body force deformation. With the excised heart therefore in an approximate end-diastolic configuration, saline in the LV and RV was displaced with vinyl polysiloxane (3M Express) injected through the corresponding atria and atrioventricular valves to fix the shape. The atrioventricular valves did not seal and served as pressure relief during the injection to prevent distension of the ventricles. After approximately 10 min, the vinyl polysiloxane solidified. Using a 3D digitizer (Micro-Scribe, 3DLX), the sock electrodes and localization markers were localized (digitizer coordinates). Additionally, locations of anatomical landmarks such as interventricular sulcus, apex, and aortic root were recorded.
FIGURE 3.

Marker localization. Each Gd-DTPA marker is localized using three orthogonal image projections. The short axis figure (far left) shows two markers, one of which is located in orthogonal planes labeled A and B.
Spatial Registration
Spatial registration between the electrode locations in digitizer coordinates and points on the myocardium in scanner coordinates is critical. Registration was achieved using localization markers attached to the sock as previously described with locations recorded in both scanner and digitizer coordinates.
Electrode locations in digitizer coordinates were transformed to scanner coordinates using a rigid-body rotation and translation
where ED is an 3 × N matrix of digitizer coordinates for the N electrodes, ES is the resulting 3 × N matrix of scanner coordinates, R is a 3 × 3 orthogonal rotation matrix, and T is 3 × 1 translation vector. Using the localization markers, an error matrix (ɛ) between the two coordinate systems may be expressed as
where M D is a 3 × M matrix of M markers in digitizer coordinates, and MS is a 3 × M matrix of the markers in scanner coordinates. The rotation matrix R and translation vector T are found analytically by minimizing the Frobenius norm of ɛ.1,15,20
Spatial Registration Error
The primary source of error between the digitized marker coordinates, MD , and the marker locations in MRI, MS , was the change in shape between the post-mortem scan and the ex vivo fixation. A data set consisting of eight markers was used to estimate this error. Each marker, in turn, was used as a test point, and a rigid-body transformation was calculated from the remaining seven markers and applied to the digitizer coordinates of the test point. An error vector was found by subtracting the transformed digitizer coordinates from the known scanner coordinates as follows:
where MS,t and MD,t are scanner and digitizer coordinates, respectively, for the marker used as the test point, and Rt′ and Tt′ are the rotation matrix and translation vector calculated without the test point. The test point was cycled through all marker locations. Precision of marker localization in scanner and digitizer coordinates was determined by repeated measurements of nine points and quantified as the root-square sum of the standard deviations in x, y, and z.
The spatial registration error will lead to a temporal error in the electrical activation time at the strain evaluation point or a temporal error in the mechanical activation time at the electrical recording point. Assuming the mechanical activation time of a particular point is known, and using an estimated conduction velocity of 0.5–1 m/s,6,19,36 the spatial registration error was converted to a temporal error in the electrical activation time at the strain evaluation point.
Data Analysis
For analysis of electrical activation, epicardial readings from each electrode were averaged over approximately 20 heartbeats. The five-point finite-difference estimate of the derivative of the recorded voltage, ν, as a function of time, t, was calculated using the following formula:
Electrical activation times, referenced to the pacing stimulus, were chosen as the point of the most negative derivative, indicating the time of local depolarization.38 Due to pacing artifact, the first 10 ms after pacing were not used for the detection of activation times.
For mechanical analysis, the short and long axis tagged image sets were segmented to isolate the myocardium using custom segmentation software.37 Tag locations through time were digitized from the segmented images using semiautomated tag-tracking software.17 An example of one tag tracked through time is shown in Fig. 2. The displacement field throughout the cardiac cycle was modeled using a four-dimensional (4D) B-spline tensor field with 7 × 7 × 7 control points in space and 20–30 control points in time.29 For each epicardial electrode, a corresponding point for strain evaluation was located by projecting a normal onto a subepicardial surface defined by contours from the short-axis images. Circumferential strain (Ecc) was evaluated at each projection point. The result was a curve of subepicardial Ecc as a function of time for each epicardial electrode. Since the subepicardial surface extended only from the most apical to the most basal short-axis image planes, some basal and apical electrodes beyond these planes did not project onto the surface and were not used.
Local mechanical activation time for each electrode was chosen as the point of maximum Ecc prior to a sustained decrease in Ecc greater than 30 ms, indicating the time at which the stretched myocardium begins to contract.43 This time was interpolated by fitting a third-order polynomial to five data points centered about the data point of maximum strain. In cases in which no distinct maxima were evident, the data point was excluded from analysis.
RESULTS
Local electrical activity over the entire ventricular surface was related temporally and spatially to local subepicardial Ecc in four RV-paced dogs. Figure 4 shows a 1-cm-thick slab of electrodes projected onto a long axis image, demonstrating that the transformed electrode locations are well matched to the ventricular epicardium.
FIGURE 4.
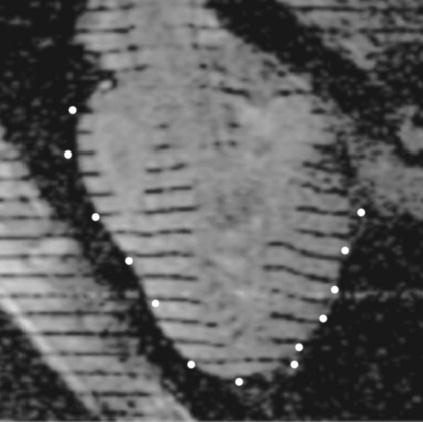
Electrodes localized in image coordinates. Example locations of electrodes transformed into image coordinates (~1-cm-thick slab of electrodes projected onto the image) demonstrate a reasonable fit between data surfaces.
Patterns of contraction may be studied by plotting local Ecc curves at points distributed around the subepicardium. Figure 5 shows a grid of such plots where a positive Ecc slope represents stretching in the circumferential direction and a negative slope represents contraction. During RV pacing, the RV contracts early, prior to the closing of the mitral valve denoted by the dashed vertical line. Points on the lateral LV, distant from the pacing site, are stretched prior to local contraction (pre-stretched) during the RV contraction and then begin to contract concomitant with mitral valve closure. During the LV contraction, a corresponding stretch is observed on the RV, highlighting the asynchronous pattern of contraction.
FIGURE 5.
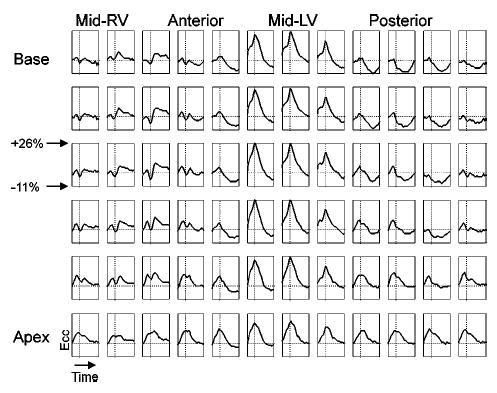
Local circumferential strain (Ecc) over the subepicardial surface of the RV-paced heart. The vertical dashed line represents the timing of the closing of the mitral valve; the horizontal dashed line represents Ecc = 0.
The effect that anatomical location and proximity to the pacing site have on the temporal and morphological properties of local depolarization and contraction may be studied qualitatively by displaying pairs of epicardial electrode recordings and Ecc evaluated at the corresponding subepicardial points. Figure 6 shows four such representative electrical–mechanical pairs related temporally to the pacing stimulus and the LV pressure waveform for one dog under right ventricular pacing. The arrows represent measured electrical and mechanical activation times. Point A, near the RV pacing site, shows early electrical activation followed by a corresponding local contraction. Point D, on the LV freewall, shows electrical and mechanical activation approximately 80 ms later. Points B and C, on the LV near the anterior and posterior septum, respectively, show electrical activation that is temporally between points A and D, correlating with the expected pattern of propagation. The Ecc curve at point C, however, has an indistinct peak, making it difficult to define the time of mechanical activation.
FIGURE 6.
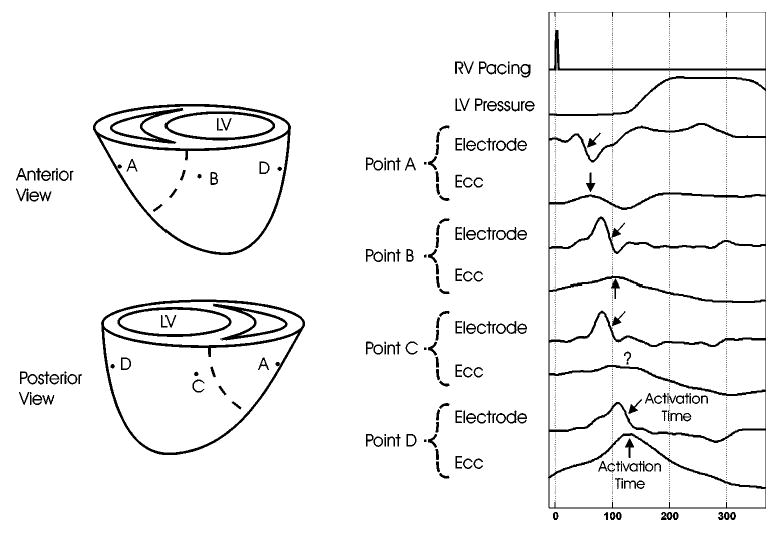
Representative electrical–mechanical pairs. Local and global relationships are represented by four electrodes spatially and temporally registered to subepicardial circumferential strain (Ecc) and temporally synced with RV pacing and LV pressure signals. The arrows denote electrical and mechanical activation times.
Global patterns of electrical and mechanical activation may be studied by plotting sequential frames of electrical activation maps spatially and temporally registered to contraction patterns as demonstrated in Fig. 7. In the upper panels, regions of electrically activated tissue are denoted in blue and a spread of activation from the RV to the LV free wall is observed from earlier to later time frames. Corresponding strain rate images are plotted in the lower panels where blue represents myocardial regions undergoing shortening (dEcc /dt < − 0.1%/ms) and yellow represents regions undergoing stretching (dEcc /dt > + 0.1%/ms). By 60 ms after the pacing stimulus, the RV has been entirely electrically activated, but has not yet started to contract. By 90 ms, the RV has begun to contract, stretching the LV free wall, while electrical activation has spread to the anterior and posterior walls. By 120 ms, contraction has spread to the anterior and posterior walls and electrical activation has reached the lateral wall of the LV. At 150 ms, electrical activation is complete and the lateral wall of the LV is contracting, stretching the RV.
FIGURE 7.

Electrical activation wave-front maps, temporally and spatially registered to strain rate maps, shown for selected time points referenced to the pacing stimulus. The leading edge of the electrical activation wavefront is determined by the local activation time; the trailing edge is depicted as 25 ms later for clarity.
Global comparisons between electrical and mechanical activation patterns can be summarized by constructing activation time maps, as shown in Fig. 8. These maps display the activation times calculated for each electrode-strain pair, as previously described. Both maps are temporally referenced to the pacing stimulus. Electrical and mechanical activation maps for the RV-paced heart show similar global patterns of propagation with a temporal offset of ~20–40 ms.
FIGURE 8.
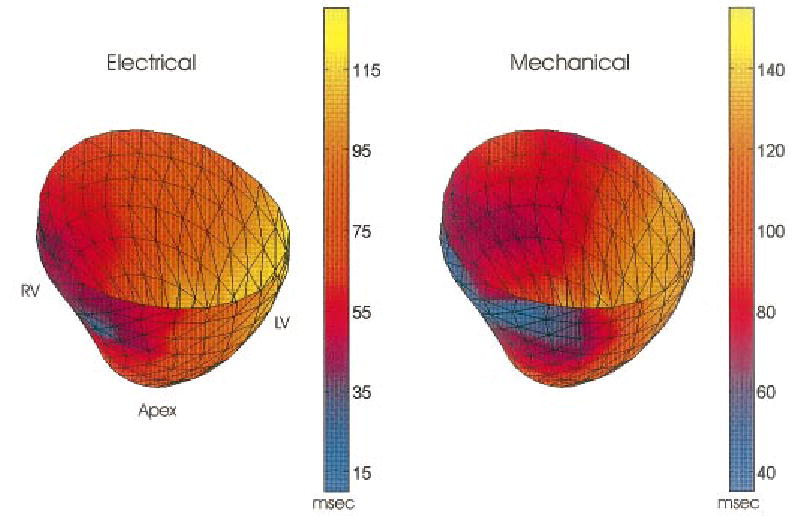
Representative electrical and mechanical activation time maps temporally referenced to pacing stimulus. Maps show early activation near the RV pacing site with a smooth progression toward the late activated LV free wall. Patterns of electrical and mechanical activation are nearly identical with a temporal offset of ~25 ms.
The relationship between the local electrical and mechanical activation times may be studied analytically by plotting each electrode-strain pair on a grid with electrical activation time on the x axis and mechanical activation time on the y axis. A slope of 1 would indicate a constant electromechanical delay given by the y intercept. Figure 9 shows this relation for all experiments. Slopes of the linear fit ranged from 0.87 to 1.05 with y intercepts ranging from 19.4 to 37.1 ms.
FIGURE 9.
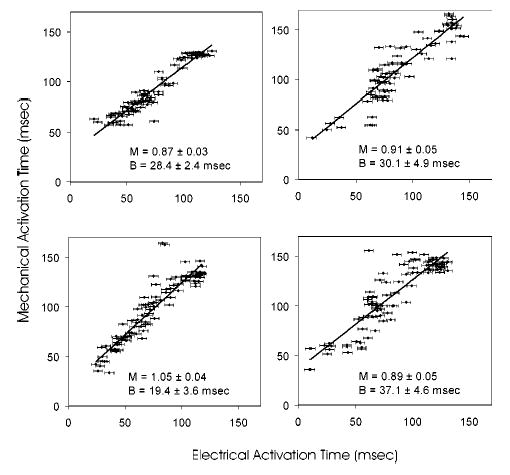
Electrical and mechanical activation time correlation plots. Linear fit lines are defined by slope M and intercept B.
The spatial registration error, as described previously, averaged 2.1 mm, with a precision of marker localization in the images and on the excised heart of 1.0 and 0.7 mm, respectively. Using an estimated conduction velocity of 0.5–1 m/s,6,19,36 consistent with the data from these experiments, the spatial registration error implies a 2–4 ms temporal error in the electrical activation time at the strain evaluation point. Distinct minima in the first derivative of electrode recordings, representing electrical activation times, could be calculated to within approximately one sample point (~ 1 ms). The standard error of the interpolated mechanical activation time was calculated from the errors of the fit parameters and averaged 1.6 ms.
DISCUSSION
We have developed a method for obtaining electrical and mechanical activation information over the entire canine ventricular surface in vivo in the MR scanner. Because both electrical data and MR images are acquired within a few minutes, and no animal intervention occurs in between the two acquisitions, the electromechanical relationship can be studied at the local and whole-heart levels for numerous physiologic states. This technique is demonstrated here in the RV-paced heart.
Similar patterns of electrical and mechanical activation are observed over the ventricular epicardium under RV pacing. Electrical activation maps demonstrate a smooth propagation from early to late-activated regions. Mechanical activation patterns typically show a global delay from electrical activation of approximately 25 ms.
Two unique goals were achieved in the development of this technique. The first was the acquisition of electrical signals over the entire ventricular epicardium in the environment of the MR scanner without degrading image quality during scanning. The second was the spatiotemporal registration of electrode signals to local myocardial strain calculated from MR images.
MR imaging is highly sensitive to rf noise and ferromagnetic artifact. rf noise detected by the MR receiver coils can degrade image quality. For this reason, the scanner room wall is constructed with copper shielding to form a Faraday cage, protecting the scanner from outside rf noise. This study requires that several connections be made between the animal in the scanner room and devices outside the room for electrical mapping as well as pacing and pressure recording. In order to minimize artifact, all connections that penetrated the Faraday cage were rf filtered at the penetration panel. Materials in the magnetic field that are strongly ferromagnetic change the local magnetic field causing image susceptibility artifacts. For this reason, all electrodes used were comprised of MR-compatible copper wiring. No image artifacts were observed due to noise or eddy currents involving the electrodes.
Though the spatial resolution of the tags in the MR images was comparable to the electrode spacing, for the experiments described here, the imaging temporal resolution was considerably lower than that of the electro-gram recordings. In this experiment, either one or two “echoes” (k-space lines) were obtained per heartbeat, with the entire raw data set for a single slice completed over 128 or 64 consecutive beats, respectively. This resulted in a time resolution of 8–15 ms. The requirement for reproducible motion over many heartbeats is a current limitation of this technique. In order to study transient electromechanical events, methods for single heartbeat tagging in a single slice are being developed; however, the temporal resolution of these images will be on the order of 20 ms. Concurrent measurement of cardiac electrograms and MR image data collection is possible with the appropriate filters on the recording electrodes.39
Because the sock electrodes are MR compatible, they were not visible in the images, and therefore, did not interfere with image quality or tag tracking. A novel registration technique was required, however, in order to spatially register electrical data to myocardial strain calculated from the images. As described, Gd-DTPA filled markers were localized relative to both the images as well the electrodes on the excised heart, allowing electrode locations to be transformed to scanner coordinates. One limitation to this technique, however, is the requirement that heart be undeformed between the in situ and excised states. The fact that the heart is somewhat deformed between the two states introduces a lack-of-fit error in the spatiotemporal registration of electrical and mechanical activation times that could not be reduced by incorporation of an isotropic scale factor in the coordinate transformation. Despite this, Fig. 4 demonstrates that the transformed electrode locations are well matched to the ventricular epicardium and the temporal precision in relating electrical and mechanical activation times is 2–4 ms.
The accuracy and precision of the 4D B-spline technique used to calculate circumferential strain are higher in the subepicardium than at the epicardium since the former region has greater support from the tagging data in the myocardium, while the latter is at the margin of the tagging data. Therefore, for each epicardial electrode, a corresponding location was projected onto the subepicardial surface for local strain evaluation. While this technique neglects the effects of transmural gradients in the deformation field, it minimizes errors related to interpolation of the data.
One limitation of this study is that the definition of mechanical activation is based upon observed local shortening rather than local force development. Tissue that has been electrically activated develops tension after a brief latency, but when or whether this tension results in measurable shortening depends on loads imposed by the adjacent tissue. In some cases, there may be little observed shortening (physiologically, an isometric contraction), while in other cases there may even be elongation during the development of tension (physiologically, an eccentric contraction). In addition, the level of tension developed increases with the length of the tissue prior to electrical activation as described by the Frank–Starling relationship.31 Consequently, tissue that has been prestretched will develop greater tension. The extent to which these phenomena influence the pattern of measurable shortening depends upon factors such as the degree of electrical asynchrony, pacing rate, contractility, and ventricular volume.
In this study, while an electromechanical correlation was clearly demonstrated, the range of mechanical activation times observed for a specific electrical activation value was quite large. Figure 9 demonstrates that this is most evident for the middle range of electrical activation times (50–90 ms, corresponding to points B and C of Fig. 6), while early and late activated regions have a more uniform electromechanical delay. One possible explanation for this is that ventricular pacing creates distinct regions of early and late-activated myocardium. The early activated region near the RV pacing site (point A, Fig. 6) contracts against a passive load, since the remainder of the heart is relaxed, and can, therefore, contract quickly in response to the electrical stimulus. The late-activated region on the lateral wall of the LV (point D) is substantially prestretched by the contraction of the early activated region and may, therefore, be able to develop the additional force necessary to contract quickly in response to the electrical stimulus, even against a higher load imposed by the adjacent active myocardium. The regions of myocardium that are between the early and late activated regions (points B and C), however, have been only slightly prestretched and yet are mechanically activated against the load of adjacent contracting tissue. This likely results in greater variation in the delay between electrical activation and observable shortening.
Due to MR compatibility issues, the electrical mapping in this study is limited to the epicardium. At present, commercially available basket catheters contain ferromagnetic material and would severely degrade image quality. While MR-compatible plunge electrodes could be incorporated into this protocol, we did not do so here.
The applicability of this technique to the study of normal cardiac function may be limited by surgical intervention, mechanical restriction from the sock, and pacing protocol. Due to the mechanical properties of the sock we anticipate that its mechanical restriction on the heart was minimal, though we have not yet quantified this effect. This preliminary study focused on RV pacing rather than RA pacing or normal sinus rhythm in order to produce a broader range of electrical and mechanical activation times and facilitate electromechanical correlation. Simultaneous pacing of the RA and RV above the intrinsic rate suppressed normal sinus activation but may have compromised ventricular filling and global function. Future studies will include an atrioventricular pacing delay, to better simulate clinical pacing as well as ablation of the sinoatrial node to allow for lower pacing rates.
CONCLUSIONS
A method has been described for obtaining unipolar epicardial potentials from the in vivo canine heart while the dog is in the MR scanner. Using tagged MRI, spatially and temporally registered electrical and mechanical activation maps were obtained in the ventricularly paced canine heart. Both local and global comparisons of electrical and mechanical activation patterns are possible. We estimate the temporal precision in spatially matching electrical and mechanical activation times to be 2–4 ms. This method holds promise for the study of many physiologic conditions in which the electromechanical relationship varies from normal. New methods for improving the evaluation of local mechanical activation are currently under investigation.
Acknowledgments
The authors would like to thank Jayne Davis for construction of the cardiac sock. The authors are also indebted to Robert Lux and Robert MacLeod for their guidance in conducting mapping studies.
References
- 1.Arun KS, Huang TS, Blostein SD. Least-squares fitting of two 3D point sets. IEEE Trans Pattern Anal Mach Intell. 1987;9:698–700. doi: 10.1109/tpami.1987.4767965. [DOI] [PubMed] [Google Scholar]
- 2.Augustijn CH, Arts T, Prinzen FW, Reneman RS. Mapping the sequence of contraction of the canine left ventricle. Pfluegers Arch. 1991;419:529–533. doi: 10.1007/BF00370800. [DOI] [PubMed] [Google Scholar]
- 3.Azhari H, Weiss JL, Rogers WJ, Siu CO, Zerhouni EA, Shapiro EP. Noninvasive quantification of principal strains in normal canine hearts using tagged MRI images in 3D. Am J Physiol. 1993;264:H205–H216. doi: 10.1152/ajpheart.1993.264.1.H205. [DOI] [PubMed] [Google Scholar]
- 4.Badke FR, Boinay P, Covell JW. Effects of ventricular pacing on regional left ventricular performance in the dog. Am J Physiol. 1980;238:H858–H867. doi: 10.1152/ajpheart.1980.238.6.H858. [DOI] [PubMed] [Google Scholar]
- 5.Barr RC, Spach MS. Sampling rates required for digital recording of intracellular and extracellular cardiac potentials. Circulation. 1977;55:40–48. doi: 10.1161/01.cir.55.1.40. [DOI] [PubMed] [Google Scholar]
- 6.Berne, R. M., and M. N. Levy. Cardiovascular Physiology. St. Louis: Mosby, 1986, 19 pp.
- 7.Blanc JJ, Etienne Y, Gilard M, Mansourati J, Munier S, Boschat J, Benditt DG, Lurie KG. Evaluation of different ventricular pacing sites in patients with severe heart failure: Results of an acute hemodynamic study. Circulation. 1997;96:3273–3277. doi: 10.1161/01.cir.96.10.3273. [DOI] [PubMed] [Google Scholar]
- 8.Burkhoff D, Oikawa RY, Sagawa K. Influence of pacing site on canine left ventricular contraction. Am J Physiol. 1986;251:H428–H435. doi: 10.1152/ajpheart.1986.251.2.H428. [DOI] [PubMed] [Google Scholar]
- 9.Cazeau S, Leclercq C, Lavergne T, Walker S, Varma C, Linde C, Garrigue S, Kappenberger L, Haywood GA, Santini M, Bailleul C, Daubert JC. Effects of multisite biventricular pacing in patients with heart failure and intra-ventricular conduction delay. N Engl J Med. 2001;344:873–880. doi: 10.1056/NEJM200103223441202. [DOI] [PubMed] [Google Scholar]
- 10.Chen PS. Ventricular fibrillation is not an anodally induced phenomenon in open-chest dogs. Am J Physiol. 1992;262:H365–H373. doi: 10.1152/ajpheart.1992.262.2.H365. [DOI] [PubMed] [Google Scholar]
- 11.Declerck J, Denney TS, Ozturk C, O’Dell W, McVeigh ER. Left ventricular motion reconstruction from planar tagged MR images: A comparison. Phys Med Biol. 2000;45:1611–1632. doi: 10.1088/0031-9155/45/6/315. [DOI] [PMC free article] [PubMed] [Google Scholar]
- 12.Delhaas T, Arts T, Prinzen FW, Reneman RS. Relation between regional electrical activation time and subepicardial fiber strain in the canine left ventricle. Pfluegers Arch. 1993;423:78–87. doi: 10.1007/BF00374964. [DOI] [PubMed] [Google Scholar]
- 13.Dick DJ, Lab MJ. Mechanical modulation of stretch-induced premature ventricular beats: Induction of mechano-electric adaptation period. Cardiovasc Res. 1998;38:181–191. doi: 10.1016/s0008-6363(97)00314-3. [DOI] [PubMed] [Google Scholar]
- 14.Fotuhi PC, Chattipakorn N, Rollins DL, Bicknell JL, Sreenan CM, Killingsworth CR, Walcott GP, Ideker RE. Effect of altering the left ventricular pressure on epicardial activation time in dogs with and without pacing-induced heart failure. J Interv Card Electrophysiol. 2000;4:561–568. doi: 10.1023/a:1026549112331. [DOI] [PubMed] [Google Scholar]
- 15.Golub, G. H., and van Loan, C. F. Matrix Computations. Baltimore: Johns Hopkins, 1989, 582 pp.
- 16.Green LS, Taccardi B, Ershler PR, Lux RL. Epicardial potential mapping. Effects of conducting media on isopotential and isochrone distributions. Circulation. 1991;84:2513–2521. doi: 10.1161/01.cir.84.6.2513. [DOI] [PubMed] [Google Scholar]
- 17.Guttman MA, Prince JL, McVeigh ER. Tag and contour-detection in tagged MR images of the left ventricle. IEEE Trans Med Imaging. 1994;13:74 –88. doi: 10.1109/42.276146. [DOI] [PubMed] [Google Scholar]
- 18.Hashima AR, Young AA, McCulloch AD, Waldman LK. Nonhomogeneous analysis of epicardial strain distributions during acute myocardial ischemia in the dog. J Biomech. 1993;26:19–35. doi: 10.1016/0021-9290(93)90610-q. [DOI] [PubMed] [Google Scholar]
- 19.Hoffman, B. F., and Cranefield, P. F. Electrophysiology of the Heart. New York: McGraw-Hill, 1960, 79 pp.
- 20.Horn BKP, Hilden HM, Negahdaripour S. Closed-form solution of absolute orientation using orthonormal matrices. J Opt Soc Am. 1988;5:1127–1135. [Google Scholar]
- 21.Kass DA, Chen CH, Curry C, Talbot M, Berger R, Fetics B, Nevo E. Improved left ventricular mechanics from acute VDD pacing in patients with dilated cardiomyopathy and ventricular conduction delay. Circulation. 1999;99:1567–1573. doi: 10.1161/01.cir.99.12.1567. [DOI] [PubMed] [Google Scholar]
- 22.Leclercq C, Cazeau S, Le Breton H, Ritter P, Mabo P, Gras D, Pavin D, Lazarus A, Daubert JC. Acute hemodynamic effects of biventricular DDD pacing in patients with end-stage heart failure. J Am Coll Cardiol. 1998;32:1825–1831. doi: 10.1016/s0735-1097(98)00492-6. [DOI] [PubMed] [Google Scholar]
- 23.Lessick J, Smeets JL, Reisner SA, Ben Haim SA. Electromechanical mapping of regional left ventricular function in humans: Comparison with echocardiography. Cathet Cardiovasc Interv. 2000;50:10–18. doi: 10.1002/(sici)1522-726x(200005)50:1<10::aid-ccd3>3.0.co;2-a. [DOI] [PubMed] [Google Scholar]
- 24.McVeigh ER, Atalar E. Cardiac tagging with breath-hold cine MRI. Magn Reson Med. 1992;28:318–327. doi: 10.1002/mrm.1910280214. [DOI] [PMC free article] [PubMed] [Google Scholar]
- 25.McVeigh ER, Prinzen FW, Wyman BT, Tsitlik JE, Halperin HR, Hunter WC. Imaging asynchronous mechanical activation of the paced heart with tagged MRI. Magn Reson Med. 1998;39:507–513. doi: 10.1002/mrm.1910390402. [DOI] [PMC free article] [PubMed] [Google Scholar]
- 26.Nelson GS, Berger RD, Fetics BJ, Talbot M, Spinelli JC, Hare JM, Kass DA. Left-ventricular or biventricular pacing improves cardiac function at diminished energy cost in patients with dilated cardiomyopathy and left bundle-branch block. Circulation. 2000;102:3053–3059. doi: 10.1161/01.cir.102.25.3053. [DOI] [PubMed] [Google Scholar]
- 27.Newton JC, Huang J, Rogers JM, Rollins DL, Walcott GP, Smith WS, Ideker RE. Pacing during ventricular fibrillation: Factors influencing the ability to capture. J Cardiovasc Electrophysiol. 2001;12:76–84. doi: 10.1046/j.1540-8167.2001.00076.x. [DOI] [PubMed] [Google Scholar]
- 28.O’Dell WG, Moore CC, Hunter WC, Zerhouni EA, McVeigh ER. Three-dimensional myocardial deformations: Calculation with displacement field fitting to tagged MR images. Radiology. 1995;195:829–835. doi: 10.1148/radiology.195.3.7754016. [DOI] [PMC free article] [PubMed] [Google Scholar]
- 29.Ozturk C, McVeigh ER. Four-dimensional B-spline-based motion analysis of tagged MR images: Introduction and in vivo validation. Phys Med Biol. 2000;45:1683–1702. doi: 10.1088/0031-9155/45/6/319. [DOI] [PMC free article] [PubMed] [Google Scholar]
- 30.Park RC, Little WC, O’Rourke RA. Effect of alteration of left-ventricular activation sequence on the left ventricular end-systolic pressure–volume relation in closed-chest dogs. Circ Res. 1985;57:706–717. doi: 10.1161/01.res.57.5.706. [DOI] [PubMed] [Google Scholar]
- 31.Patterson SW, Piper H, Starling EH. The regulation of the heart beat. J Physiol (London) 1914;48:465–513. doi: 10.1113/jphysiol.1914.sp001676. [DOI] [PMC free article] [PubMed] [Google Scholar]
- 32.Paul T, Moak JP, Morris C, Garson A., Jr Epicardial mapping: How to measure local activation? Pacing Clin Electrophysiol. 1990;13:285–292. doi: 10.1111/j.1540-8159.1990.tb02042.x. [DOI] [PubMed] [Google Scholar]
- 33.Prinzen FW, Augustijn CH, Allessie MA, Arts T, Delhaas T, Reneman RS. The time sequence of electrical and mechanical activation during spontaneous beating and ectopic stimulation. Eur Heart J. 1992;13:535–543. doi: 10.1093/oxfordjournals.eurheartj.a060210. [DOI] [PubMed] [Google Scholar]
- 34.Prinzen FW, Hunter WC, Wyman BT, McVeigh ER. Mapping of regional myocardial strain and work during ventricular pacing: Experimental study using magnetic resonance imaging tagging. J Am Coll Cardiol. 1999;33:1735–1742. doi: 10.1016/s0735-1097(99)00068-6. [DOI] [PMC free article] [PubMed] [Google Scholar]
- 35.Saxon LA, Kerwin WF, Cahalan MK, Kalman JM, Olgin JE, Foster E, Schiller NB, Shinbane JS, Lesh MD, Merrick SH. Acute effects of intraoperative multisite ventricular pacing on left ventricular function and activation/contraction sequence in patients with depressed ventricular function. J Cardiovasc Electrophysiol. 1998;9:13–21. doi: 10.1111/j.1540-8167.1998.tb00862.x. [DOI] [PubMed] [Google Scholar]
- 36.Scher, A. M., and M. S. Spach. Cardiac Depolarization and Repolarization and the Electrocardiogram. Bethesda: American Physiological Society, 1979, 365 pp.
- 37.Shechter G, Ozturk C, McVeigh ER. Interactive four-dimensional segmentation of multiple image sets. Proc SPIE. 2000;3976:165–173. [Google Scholar]
- 38.Steinhaus BM. Estimating cardiac transmembrane activation and recovery times from unipolar and bipolar extracellular electrograms: A simulation study. Circ Res. 1989;64:449–462. doi: 10.1161/01.res.64.3.449. [DOI] [PubMed] [Google Scholar]
- 39.Susil RC, Yeung CJ, Halperin HR, Lardo AC, Atalar E. Multifunctional interventional devices for MRI: A combined electrophysiology/MRI catheter. Magn Reson Med. 2002;47:594 –600. doi: 10.1002/mrm.10088. [DOI] [PubMed] [Google Scholar]
- 40.Taggart P, Sutton P, John R, Lab M, Swanton H. Monophasic action potential recordings during acute changes in ventricular loading induced by the Valsalva manoeuvre. Br Heart J. 1992;67:221–229. doi: 10.1136/hrt.67.3.221. [DOI] [PMC free article] [PubMed] [Google Scholar]
- 41.Taggart P, Sutton P, Lab M, Runnalls M, O’Brien W, Treasure T. Effect of abrupt changes in ventricular loading on repolarization induced by transient aortic occlusion in humans. Am J Physiol. 1992;263:H816–H823. doi: 10.1152/ajpheart.1992.263.3.H816. [DOI] [PubMed] [Google Scholar]
- 42.Worley SJ, Ideker RE, Mastrototaro J, Smith WM, Vidaillet H, Jr, Chen PS, Lowe JE. A new sock electrode for recording epicardial activation from the human heart: One size fits all. Pacing Clin Electrophysiol. 1987;10:21–31. doi: 10.1111/j.1540-8159.1987.tb05921.x. [DOI] [PubMed] [Google Scholar]
- 43.Wyman BT, Hunter WC, Prinzen FW, McVeigh ER. Mapping propagation of mechanical activation in the paced heart with MRI tagging. Am J Physiol. 1999;276:H881–H891. doi: 10.1152/ajpheart.1999.276.3.H881. [DOI] [PubMed] [Google Scholar]


