Abstract
Recent optical trap experiments have applied resisting, assisting, and sideways loads to conventional kinesin moving on microtubules at fixed [ATP]. To gain insight into intermediate motions when the motor protein takes its 8.2-nm steps, the velocity and randomness data have been analyzed by using discrete-state stochastic models with a three-dimensional “energy landscape.” The bead size and tether angle play a crucial role. The analysis implies that on binding ATP the motor “crouches,” the point of attachment of the tether at the necklinker junction moving downward toward the microtubule by 0.5–0.7 nm, while inching forward by only 0.1–0.2 nm, before completing the step from a transition state by a unitary “sprint” of ∼7.8 nm. These inferences accord with high-resolution observations that exclude a previously predicted substep of 1.8–2.1 nm. Assisting and leftward loads are opposed in that the perpendicular component of the tension in the tether is enhanced by ∼2 pN, which reduces the velocity, but sideways lurching is not supported.
Keywords: motor protein, three-dimensional landscape, vectorial loading
Conventional kinesin is a processive motor protein that walks along a microtubule (MT) toward the plus end, taking hundreds of d = 8.2-nm steps while hydrolyzing one molecule of ATP per step (at least under loads not too high) before finally dissociating from the MT (1). In vivo kinesin plays an important role by transporting vesicles and organelles. In vitro it has been studied with the aid of optical traps that exert a measured force on a bead attached to the motor's tether while it walks on an MT fixed on a flat microscope stage (1–4) (see Fig. 1). Understanding the mechanochemical processes and intermediate motions that a motor undergoes in taking a single step has posed serious challenges to experiment and theory. Observations of force-velocity-[ATP] relations offer a potential route to gaining insight.
Fig. 1.
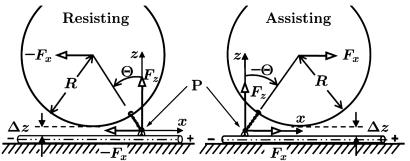
Diagram of an MT-kinesin-bead complex in the (x, z) plane with a bead of radius, R, a tether, of length l0 and inclination angle Θ, which transmits the total vectorial load F = (Fx, Fy = 0, Fz) to the point of attachment, P, on the motor, for a resisting load, Fx < 0, Θ> 0(Left) and an assisting load, Fx > 0, Θ< 0(Right). The offset Δz represents the rms perpendicular thermal fluctuation of the bead as limited by collisions with the MT (2).
The vectorial character of the load† F = (Fx, Fy, Fz) transmitted by the tether to its point of attachment, P, on the body of the motor, where the two necklinkers join, has been appreciated for some time (refs. 1 and 5 and references therein). In the original bead assays (1–4) only a resistive load component Fx < 0 was accessible. Nevertheless, a decade ago Howard and coworkers (6) implemented an ingenious MT buckling experiment designed to measure, Fz, the “vertical” or perpendicular component of the force vector F (but still with Fx < 0); this study will be revisited (5) briefly below.
More recently, however, Lang et al. (7) developed a “two-dimensional optical force clamp” that can exert controlled assisting, i.e., Fx > 0, loads as well as resisting and sideways loads (Fy ≠ 0). Using this clamp, Block et al. (8) monitored the position, x(t), of kinesin motors as a function of time t when they moved along the MT, recording over a wide range of conditions the mean velocity, V (F, [ATP]) ≈ 〈x(t) 〉/t, and the randomness, r(F, [ATP]) ≈ 〈[Δx(t)]2 〉/d 〈x(t) 〉 ≈ D/Vd, with D the positional dispersion (see refs. 4 and 9–11).
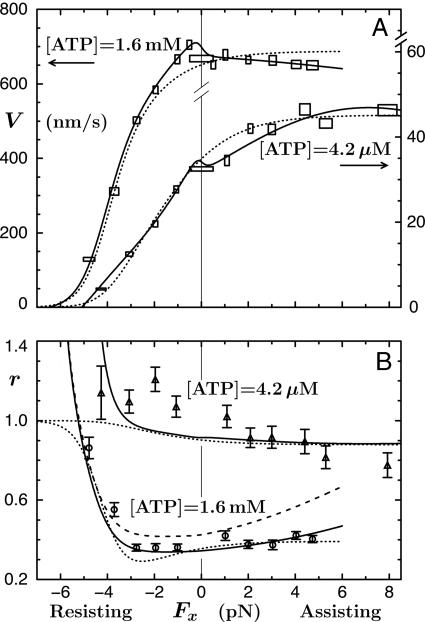
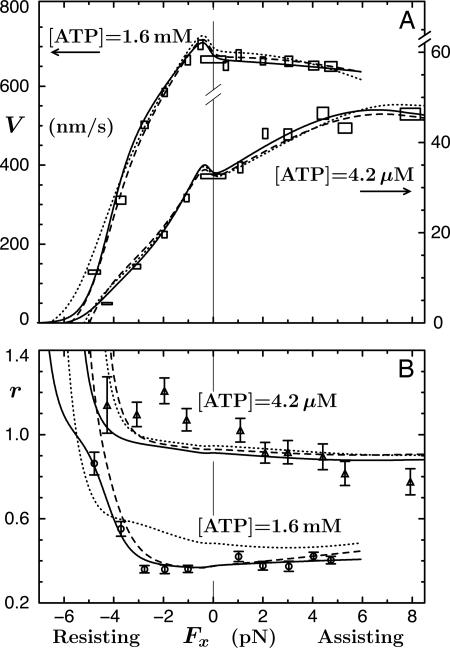
A crucial observation, using 0.5-μm diameter beads, was that V(Fx) at high [ATP] decreased under assisting loads! See Fig. 2A that also shows that whereas V(Fx) increases with Fx when [ATP] = 4.2 μM, it rises only to ∼1.3 V(0). These findings contrast with the previous, rather noisy (and otherwise intrinsically troubling) data of Coppin et al. (12) with 1-μm beads that indicated significant acceleration ratios, up to V(Fx = 5 pN)/V(0) ≃ 2.9 for [ATP] = 5 μM. At first sight, these increases seemed to smoothly continue fits to resisting, Fx < 0, data merely by switching the sign of Fx (11). Block et al. (8), however, express serious concerns regarding these experiments, noting a lack of force clamping and a lower spatiotemporal resolution that may have failed to discount forward-jumping detachment-reattachment events. Furthermore, subsequent observations by Carter and Cross (13) (using 0.50- and 0.56-μm beads) reach assisting loads of 15 pN at [ATP] = 1 mM and 10 μM and, although somewhat disperse, fully confirm the conclusions of Block and coworkers (8) for Fx > 0. Accordingly, we believe the Block data (8) warrant further analysis.
Fig. 2.
The data of Block and coworkers (8), and their fits using an (N = 5)-state model, for the velocity (A) and randomness (B) of kinesin as functions of Fx (with Fy = 0) at fixed [ATP]. The solid curves are the present N = 2 fits, and the dashed plot in B illustrates the imposition of a previous mechanicity value (11) (see text).
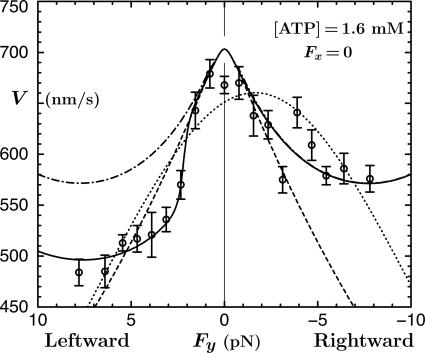
Under sideways loads, up to Fy = ±8 pN, the velocity of kinesin was observed (8) to decrease asymmetrically by 15–30% (see Figs. 8 and 9). In discussing their findings, Block et al. (8) examined various four- and five-state kinetic models: however, they invoked smooth rate dependence only on Fx and Fy and neglected two or more reverse rates. From the fitted parameters of an (N = 5)-state model judged acceptable they concluded that the motor (better, say, the point of attachment at the necklinker junction) swings systematically from side to side by ∼0.5 nm while taking a step, perhaps a surprising inference. In addition, a dominant transition state was located at  nm along the MT from the strongly bound state. The corresponding fits (8) to velocity and randomness are the dotted curves in Fig. 2. Although these fits are not unreasonable, they fail entirely to capture the clear decrease of the velocity under assisting loads at high ATP, appear to rise too rapidly under assisting loads at low ATP, and miss the increase of the randomness above unity at low ATP.
Fig. 8.
Lateral (Fx = 0) force-velocity data and fit (dotted line) from Block et al. (8). The solid curve for the present N = 2 model represents Eq. 10. The dashed and dot-dashed plots depict preliminary fits; see text.
Fig. 9.
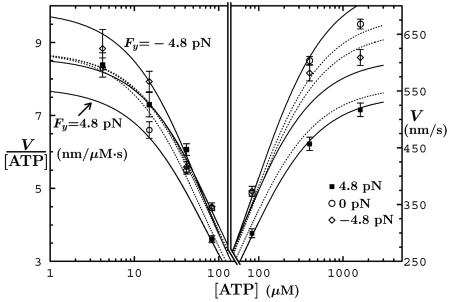
Velocity data and fits as a function of [ATP] (8) under fixed transverse loads, Fy = 0, ± 4.8 pN. The solid plots are the present N = 2 fits; the dotted lines are from ref. 8.
Our first aim here is to allow explicitly for the manifest vectorial character of the load F, which, as evident from Fig. 1, cannot be adequately described when switching from a resisting to an assisting configuration merely by changing the sign of Fx. Thus, we go beyond previous simple, but initially adequate, “one-dimensional” stochastic landscape models for kinesin and myosin V (11, 14). Second, we hope to achieve a qualitatively better description and hence draw more reliable conclusions regarding intermediate motions and substeps.
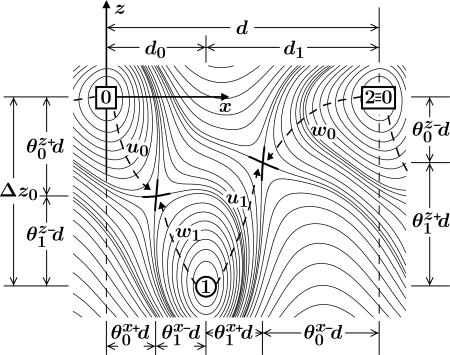
To this end we have implemented a three-dimensional free-energy landscape treatment (5) as illustrated in Fig. 3. This approach recognizes that the tension in the bead-tether-kinesin-body linkage acquires a perpendicular or vertical component, Fz, determined by the tether angle Θ, when a longitudinal-cum-transverse load, (Fx, Fy), is imposed by a trap (see Fig. 1). The resulting fits, the solid curves in Fig. 2, show that a two-state kinetic model [supplemented with mechanicity parameters (10, 11, 15)] is fully adequate.
Fig. 3.
Schematic contour map of an overall free energy landscape in the (x, z) plane for an (N = 2)-state model of the motion of the point of attachment, P ≡ r = (x, y, z), of the tether to the motor body. Locally stable states correspond to valleys or potential wells; cols, passes, or saddle points on paths connecting adjacent wells describe transition states (5). Here, two successive ATP-free states, labeled 0 and 2 ≡ 0, are shown with a single (N – 1 = 1) intermediate mechanochemical state, 1, and the two corresponding (N = 2) transition states (thick crosses). Substeps d0 and d1 are determined by the load distribution factors 
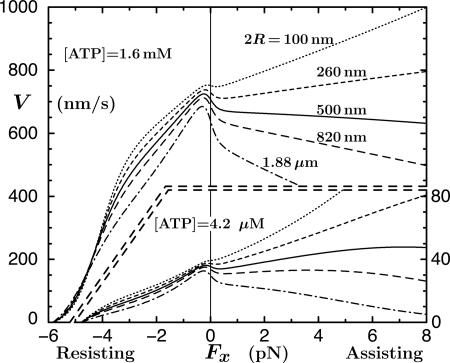
Detailed implications are discussed below, but, significantly, the analysis resolves a serious discrepancy between the original prediction (11) of a ∼2-nm substep and high-resolution observations of single forward steps by Higuchi and coworkers (16) that rule out this conclusion, as do measurements of both forward and backward steps by Carter and Cross (13).‡ Furthermore, sideways motions are not implied although the motor “crouches” on binding ATP and specifically resists assisting and leftward loads. It is predicted (see Fig. 6) that increasing the bead size should markedly reduce the velocity under assisting loads and vice versa.
Fig. 6.
Predictions for the velocity vs. Fx for bead diameters 2R = 100 nm-1.88 μm [following from 4 but neglecting changes in Δz (9)].
Theoretical Approach
We suppose that a kinesin motor, when it takes a forward step of length d = 8.2 nm from one MT binding site l to the next site l + 1, undergoes N intermediate biochemical transitions from state j = 0l to 1l to... to (N – 1)l to Nl ≡ 0l+1 (5, 10, 11, 14). Kinetic rates uj and wj describe the transitions (jl → (j + 1)l) and (jl → (j – 1)l), respectively. To implement an overall free-energy landscape picture one then assumes that the underlying reaction coordinate may be identified with the point of attachment of the tether to the motor at r = (x, y, z), which is represented by P in Fig. 1.
The corresponding free-energy potential, Φ(r), is periodic in the absence of a load (F = 0) as illustrated for the simplest N = 2 case by the contour plots in Fig. 3. Minima in the potential represent mechanochemical states, jl, with typical lifetimes of milliseconds (or longer). More than one distinct biochemical state may be associated with a given potential well simply because the associated displacements in r are negligibly small.§ Transition states between two mechanochemical states jl and jl+1 are realized as cols or saddle points in the free-energy landscape. Also shown in Fig. 3 are dimensionless load distribution factors  , and
, and  , although in general one needs three-component load distribution vectors,
  . These provide crucial fitting parameters in describing experimental data since they serve to specify substeps and lateral and vertical displacements by
  , etc. (5).
Within the kinetic model explicit expression for the velocity and the randomness are known for general N (10, 11) even when, to allow for diffusive transitions or multiple biochemical states within a single mechanochemical state j, one allows for waiting time distributions,  , that may be parameterized effectively by mechanicities
  (15).
(15).
To account for an external load, F = (Fx, Fy, Fz), the energy landscape Φ(r) is tilted by the addition of a term –F · r. Then, by relating the transition rates to the free-energy barrier heights, one finds that the forward and reverse rates under zero load,  and
and  , become
 |
[1] |
 |
[2] |
Analysis of Longitudinal Force Data
To describe data taken under a longitudinal load Fx (with Fy = 0), it is necessary, before Eqs. 1 and 2 can be used, to know the perpendicular component Fz. This must be a function of Fx, say  . On considering the geometry of the bead-tether-motor-track in Fig. 1, the simplest ansatz is
 |
[3] |
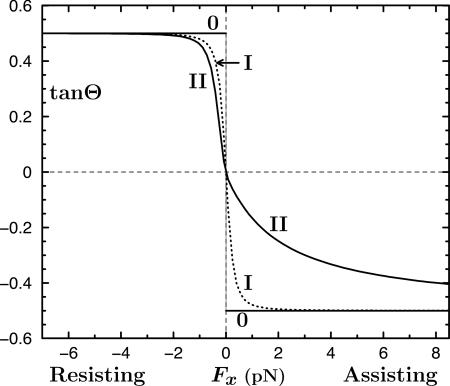
This expression merely asserts that the inclination angle Θ remains constant under resisting loads but switches sign when the load becomes assisting as embodied in Fig. 4. The constant c∥ = |cotΘ| follows from the general relation
 |
[4] |
which reflects the geometry of Fig. 1. For typical beads of diameter 2R = 0.50 μm one may accept a fluctuation Δz = 5 nm (2). However, the tether length of kinesin is not well established. Examination of photomicrographs [e.g., figure 12.3E of ref. 1] suggests l0 = 58–60 nm. However, 70 nm seems possible and, conversely, shorter lengths may arise experimentally if some section of the tether adjacent to the tail adheres to the bead. Furthermore, there are structural aspects of the coiled-coil, a bend and a kink, that may play a role. Accordingly, it is reasonable to adopt l0 = 60 nm, which leads to Θ ≃ 35° and c∥ ≃ 1.45; but values from 1.30 to 1.60 are not implausible.
Fig. 4.
Plots of tanΘ vs. Fx for Models 0, I and II, where Θ is the inclination angle of the bead-kinesin linkage; see text.
As seen in Fig. 4, Model 0 implies an unrealistic discontinuity in  at zero load, which then leads to a cusp-like variation of the velocity. In reality, however, thermal fluctuations dominate at low loads and amplify measurement uncertainties. To recognize this a more plausible ansatz is
 |
[5] |
in which F0 represents force fluctuations that typically have a magnitude 0.3 pN (7, 8) (see dotted plot in Fig. 4).
Now both Models 0 and I imply a symmetric variation of Θ(Fx) when Fx changes sign and likewise for  . However, in view of MT polarity and the directionality of kinesin, it should be no surprise that the data of Block et al. (8) reveal a strong asymmetry in the underlying
  relation. One may represent such an asymmetry in various ways: but (i) the geometric limit Fz = c∥Fx should still apply for large Fx (>0) and (ii) a smooth variation with Fx is required physically. Consequently, a simple approach is to add to cotΘ in Eq. 3 a step function, say,
  . After smoothing with the thermal fluctuation
  , this yields
 |
[6] |
The amplitude F1 is a new parameter to be determined by fitting. In fact, F1 = 2.0 pN works well. The implications of this model are shown in Fig. 4.
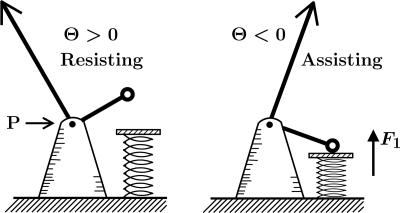
At first sight the step function in Eq. 6 seems artificial; but, as depicted schematically in Fig. 5, it has a simple mechanical interpretation. When the load switches to assisting, strain in the motor, or torque at the tether-necklinker junction, etc., comes into play and the “spring” in Fig. 5 exerts an additional vertical force that one might take as F1 ≈ K1 |sinΘ| with K1 ≃ 3.5 pN: this force component, in turn, increases the tension F in the tether. Note that the asymmetry recognized here has been seen by Uemura and Ishiwata (18) in measurements of unbinding force distributions for kinesin. Specifically, they observed that the required external force became smaller when applied as an assisting load.
Fig. 5.
A schematic mechanism representing Model II. The arrow F1 corresponds to the second term in Eq. 6.
Velocity-Force-[ATP] Data
Having established in Model II an adequate  relation, we may analyze the longitudinal force data of Block et al. (8) along the lines (11) used for the previous resisting-load data (4, 19). Thus for the initial rate u0, which represents ATP binding, we take u0 = k0[ATP]; subsequent rates, uj and wj, for j ≠ 0 must be independent of [ATP]. The final reverse rate, w0, is of significance only near stall, Fx = –|FS|, which is not of primary concern here. Accordingly, we follow ref. 11 and adopt the phenomenogical relation
  ; the square root, in which c0 describes the ATP regeneration process (4, 19), plays only a small role.¶
On this basis an N = 2 model provides a good description of the V(Fx, [ATP]) data (8) with the rates
 |
[7] |
while the load distribution vectors (with the factor c∥ = 1.45 incorporated in the z components) are
 |
[8] |
As in ref. 11, the (somewhat correlated) fitting uncertainties amount to a few digits in the last place quoted.
Apart from the larger value of  , the parameters 7 are comparable to those based on fits (11) to the data of Visccher and colleagues (4, 19). Note also that only six independent load distribution parameters enter the fitting, since, owing to periodicity (5),
  . The quality of the fits can be judged from the solid curves in Fig. 2 A. Note how well the variation under assisting loads is captured for low and high [ATP].
The load distribution vectors 8 imply a very small forward substep on binding ATP of only d0 = 0.1–0.2 nm. This substep differs markedly from the value d0 = 1.8–2.1 nm found previously (11) by using a one-dimensional landscape formulation and data only for Fx < 0 (4, 19). That conclusion, when advanced, was in accord with evidence regarding structural changes associated with nucleotide binding. However, as mentioned, it cannot be maintained in light of single-step measurements by Higuchi and coworkers (16) and Carter and Cross (13) that exclude substeps ≳ 0.8 nm and associated states with lifetimes exceeding tens of microseconds. The new, small value for d0 is fully in accord with these studies.
Furthermore, the transition state after ATP binding (and possibly further steps of hydrolysis and product release) is located at  nm. This finding implies a single, rapid unitary movement of ≈7.8 nm to complete a full 8.2-nm step, presumably while the rear kinesin head moves, hand over hand, to become the new forward head (20), again in accord with the high-resolution observations (13, 16).
On the other hand, the z-components in 8 indicate that on binding ATP the point of attachment experiences a relatively large downward movement, Δz0 =–0.5–0.7 nm. In this sense the kinesin motor appears to crouch before “sprinting.”
This crouching move may well be related to the suggestion of Rice et al. (21). In their model, the binding of ATP to the attached head of kinesin is supposed to induce the random coil of the necklinker to fold down onto the catalytic core of the motor domain. That will bring the attachment point P downward, closer toward the MT surface (and thereby facilitate binding of the leading head).
To understand crouching intuitively and see why it follows from the observed decrease of V(Fx) under assisting loads at high [ATP], consider Model 0 (with N = 2). Then u1(Fx) dominates the velocity and varies as
 |
[9] |
Thus V(Fx) falls toward stall under resisting loads, Fx = –|Fx|, provided  ; but under assisting loads V(Fx) will rise exponentially fast unless
  is more negative than
  (as is verified by the fits 8). And, negative values of
  imply crouching. Similar arguments apply at low [ATP].
Note, however, the dependence on c∥, which, in turn, depends on the geometry of the bead-tether-motor linkage and, hence, on the diameter, 2R, of the beads used. In particular, bigger beads lead, by Eq. 4, to larger values of c∥ and thence to more rapidly falling velocities under assisting loads and vice versa for smaller beads. As illustrated in Fig. 6, the effects, while small for resisting loads, are quite dramatic for Fx > 0 and so provide a route for testing the overall theory.
Clearly, changes in the tether length l0 also change Θ and c∥. Thus, by engineering a longer tether, c∥ is decreased so that at fixed Fx (not too close to zero) the Fz component of the tether tension is reduced and the velocity will generally rise.
The fits 7 and 8 provide a general expression for V(Fx, 0, Fz; [ATP]), which, at fixed [ATP], is readily appreciated via contour plots in the (Fx, Fz) plane. Such a plot is presented in figure 5 of ref. 5. Increasing Fz at fixed Fx ≳ –4 pN decreases V contrary to the MT-buckling experiments of Howard and coworkers (6). Likewise, their observations of velocities significantly in excess of zero-load values are not supported. Indeed, we find V(Fx, 0, Fz) > V(F = 0) only for assisting loads with Fx ≳ Fz. If the buckling experiments are validated the velocity enhancement might be a consequence of distortions in the curved MTs (5).
Randomness
Because the randomness at high [ATP] lies below r = 0.45 for Fx ≳ –3.5 pN (see Fig. 2B), no purely kinetic two-state model can fit the data (2, 11, 19, 22). Four transitions are expected biochemically: (0 → 1) ATP binding; (1 → 2) hydrolysis; (2 → 3) release of Pi or, from the forward head (20, 23), ADP; (3 → 4 ≡ 0) release of ADP, or Pi from the original rear head. Indeed, we find good fits for V and r by using four-state models (see Fig. 7).∥ Thus on imposing the same small step d0 = 0.15 nm as from the N = 2 model together with  ; the solid line in Fig. 7 plots the result. The fit to V is as good as for N = 2, whereas the fits for r at [ATP] = 1.6 mM are rather better. The load distribution assignment implies that the biochemical states 1, 2, and 3 are “colocalized,” i.e., mechanically indistinguishable. Consequently, the dominant substep, d – d0 ≃ 8.0 nm (or “power stroke”), corresponds to second-product release (3 → 4 ≡ 0). The fitted values of
  and
and  imply Δz0 ≃ –0.45 nm so that the motor crouches; the final transition state is located at
  nm.
nm.
Fig. 7.
Velocity (A) and randomness (B) data (8) fitted∥ by (N = 4)-state models with d0 = 0.15 imposed and biochemical states 1, 2 and 3 colocalized (solid curves), and d0 = 0.6 nm with states 1 and 2 and, separately, 3 and 4 colocalized (dashed lines) and states 2, 3, and 4 colocalized (dotted lines); see text.
Although we regard this four-state fit as close to optimal, the data (8) cannot distinguish definitively among other alternatives** provided one allows d0 to be as large as 0.6 nm (still consistent with refs. 13 and 16). Then one may suppose that the main substep, now d1 ≃ 7.6 nm, is switched to (2 → 3), describing first-product release, or to (1 → 2), simple hydrolysis; in both cases the motor is predicted to crouch, by 0.81 and 0.90 nm, respectively. Evidently (see the dashed and dotted plots in Fig. 7) the quality of these fits is distinctly lower especially in the second case. Nevertheless, the data appear not to exclude an identification of the power stroke with the first step of product release (especially, if d0 is set as high as 0.8 nm). Note this alternative implies that a motor will appear to have completed its mechanical step while still needing some 3 ms to complete full product release.
In the absence of further experimental evidence, we return to the N = 2 model and, to fit the randomness, introduce mechanicities  (10, 11, 15).†† The previous kinesin data (4, 19) for Fx ≤ 0 and [ATP] ≳ 0.3 mM (11) were well fit with
  ; and that remains roughly true (see the dashed plot in Fig. 2B). Under assisting loads, however, the discrepancies grow excessively. This defect can be repaired, nevertheless, by increasing
  to 0.65 and setting
  . Such a large value indicates that the mechanochemical state j = 1 encompasses at least two biochemical states, indicating, again, that hydrolysis cannot reasonably be associated with the ∼8.0-nm substep. Although this fit and the N = 4 fits are satisfactory for high [ATP], the data at low [ATP] suggest an additional source of randomness in the range 2 pN ≤ Fx ≤ –4 pN, which was also seen previously (11).
Lateral Force-Velocity Data
Fig. 8 presents data (8) for velocity under sideways (Fx = 0) loading: these data exhibit nonlinear and asymmetric behavior that is rather poorly represented by the close-to-parabolic dotted fit (8). As above, the first need is to relate Fz to Fy. The analog of Model I is simply  , where, to estimate c⊥, one should recall the tether geometry, as in Eq. 4, but allow for collisions of the bead with the planar substrate and thus for the 25-nm diameter of the MT. The value
  emerges. On average, however, a kinesin motor under a lateral load will likely bind at some angle, say ψ, tilted away from the top of the MT: this process leads to the modified value
  .
.
A mean tilt angle ψ = 5° gives c⊥ ≃ 0.85 c∥ (and Θ ≃ 37°). If this value is used with the two-state parameters 7 and 8‡‡ the dashed rounded wedge in Fig. 8 is obtained. The agreement for |Fy| ≤ 2 pN is satisfying and one should note that, contrary to the five-state model of ref. 8, no sideways motions of the motor are implied. Rather, one may suppose that all relevant transition states lie in the (x, z) or y = 0 plane.
For larger values of Fy we invoke, following Eq. 1, a quadratic force dependence for u1(Fy) by introducing a factor  . Taking the compliance matrix element as g1 = 0.015 nm/pN yields the dot-dashed plot in Fig. 8 (which coincides for Fy ≤ 0 with the solid curve). This fit provides a good representation of the (fairly noisy) rightward (Fy < 0) data but fails for Fy > 2 pN. However, the surprisingly strong asymmetry may be described, adapting Model II, by
 |
[10] |
in which an offset ΔF ≃ 2.2 pN is also required. The spring mechanism in Fig. 4 then predicts  pN, which, in fact, works well! However, the 5% larger value
  pN yields a slightly better overall fit (the solid line in Fig. 8). This fact suggests, indeed, that the same molecular mechanism in kinesin that opposes assisting loads, likewise acts under leftward loads exceeding ∼2 pN. It could well be that the mechanism results from the asymmetry in structure of the proximal coiled-coil relative to the MT axis.
Finally, Fig. 9 presents velocity data vs. [ATP] under vanishing and purely lateral loads. Our fits (Fig. 9, solid curves) are excellent for Fy > 0 at high [ATP] but lie below the observations for Fy = –4.8 pN; in view of the noisy data seen in Fig. 8, however, the discrepancy seems not significant. At low [ATP] our fits are good for Fy = 0 and –4.8 pN but are some 15–20% low for [ATP] ≤ 50 μM when Fy > 0. This observation might indicate a left-right asymmetry in the (0 → 1) transition state since introducing an  term for w1 improves the fit.
Summary
We have used an extended stochastic model embodying a three-dimensional energy landscape to analyze the recent experimental data of Block and coworkers (8) for kinesin. Consideration of the vertical load component, Fz, arising from the geometry of the kinesin tether and bead yields successful fits to the velocity and randomness data under resisting, assisting, and sideways loads and suggests a molecular mechanism opposing assisting and leftward forces. Although a simple two-state kinetic model supplemented by mechanicities suffices, acceptable four-state models associate either ADP or Pi release with the main substep of 7–8 nm. The analysis implies, that on binding ATP, the junction of the tether with the necklinkers moves forward by only 0.1–0.2 nm (consistent with direct single-step observations) while, at the same time, crouching down by 0.5–0.7 nm before executing a rapid sprint to complete the 8.2-nm step. A readily testable prediction is that assisting loads applied with smaller (≤400-nm diameter) beads will yield increasing velocities at high [ATP]. The full vectorial load dependence of the velocity V(F; [ATP]) does not confirm an early suggestion (6) of strongly enhanced velocities induced by increasing Fz; but experiments to probe this issue further would be valuable.
Supplementary Material
Acknowledgments
We are grateful to Steven Block for providing experimental data for kinesin. Interactions with him, Jonathon Howard, Anatoly Kolomeisky, and Matthew Lang and valuable comments on a draft by Edwin Taylor and Sebastian Doniach have been much appreciated. This work was supported by National Science Foundation Grant CHE 03-01101.
Author contributions: M.E.F. and Y.C.K. designed research, performed research, contributed new reagents/analytic tools, analyzed data, and wrote the paper.
Abbreviation: MT, microtubule.
Footnotes
We use right-handed coordinates with, as in Fig. 1, the x axis parallel to the MT and directed toward the plus end, while the z axis is normal to the (x, y) plane on which the MT is fastened (5).
In discussing backward steps under superstall loads, Carter and Cross (13) refer to ref. 11 and argue that back steps are unlikely to result in ATP synthesis. However, their assertions rest on a misconception of the significance of dwell times before forward and backward steps: unlike the relative frequencies of + and – steps, the mean dwell times will always be equal and must rise (or fall) together with changes in [ATP], etc. (see ref. 17).
Or, in principle, because the biochemical transitions in the “full chemical space” have vanishing projection onto the subspace specified by r.
Detachments of the motor from the MT could be included explicitly following refs. 11 and 15 but serve only to renormalize the fitted rates slightly (15).
The fitted parameters for the four-state models in Fig. 7 are presented in Supporting Text, which is published as supporting information on the PNAS web site.
An equivalent ambiguity emerged in ref. 11.
The mechanicity,  , measures the rms widths Δt± of the corresponding waiting-time distributions,
  , for departing from state j in the + or – sense. Note that a convolution of ν successive ordinary “chemical” or Poisson processes with equal rates yields
  and thence
  ; hence
  describes a fully mechanical or clockwork process with
  .
.
Note that Eq. 8 implies that all of the transverse load distribution factors,  , vanish. The fit of the dashed-line plot in Fig. 8 for |Fy| ≤ 2 pN confirms the adequacy of this conclusion and the absence of sideways lurching under parallel (Fy ≡ 0) loads.
References
- 1.Howard, J. (2001) Mechanics of Motor Proteins and the Cytoskeleton (Sinauer, Sunderland, MA).
- 2.Svoboda, K. & Block, S. M. (1994) Cell 77, 773–784. [DOI] [PubMed] [Google Scholar]
- 3.Kojima, H., Muto, E., Higuchi, H. & Yanagida, T. (1997) Biophys. J. 73, 2012–2022. [DOI] [PMC free article] [PubMed] [Google Scholar]
- 4.Visscher, K., Schnitzer, M. J. & Block, S. M. (1999) Nature 400, 184–189. [DOI] [PubMed] [Google Scholar]
- 5.Kim, Y. C. & Fisher, M. E. (2005) J. Phys. Condens. Matter, in press (e-Print Archive, www.arxiv.org/cond-mat/0506185).
- 6.Gittes, F., Meyhöfer, E., Baek, S. & Howard, J. (1996) Biophys. J. 70, 418–429. [DOI] [PMC free article] [PubMed] [Google Scholar]
- 7.Lang, M. J., Asbury, C. L., Shaevitz, J. W. & Block, S. M. (2002) Biophys. J. 83, 491–501. [DOI] [PMC free article] [PubMed] [Google Scholar]
- 8.Block, S. M., Asbury, C. L., Shaevitz, J. W. & Lang, M. J. (2003) Proc. Natl. Acad. Sci. USA 100, 2351–2356. [DOI] [PMC free article] [PubMed] [Google Scholar]
- 9.Svoboda, K., Mitra, P. P. & Block, S. M. (1994) Proc. Natl. Acad. Sci. USA 91, 11782–11786. [DOI] [PMC free article] [PubMed] [Google Scholar]
- 10.Fisher, M. E. & Kolomeisky, A. B. (1999) Proc. Natl. Acad. Sci. USA 96, 6597–6602. [DOI] [PMC free article] [PubMed] [Google Scholar]
- 11.Fisher, M. E. & Kolomeisky, A. B. (2001) Proc. Natl. Acad. Sci. USA 98, 7748–7753. [DOI] [PMC free article] [PubMed] [Google Scholar]
- 12.Coppin, C. M., Pierce, D. W., Hsu, L. & Vale, R. D. (1997) Proc. Natl. Acad. Sci. USA 94, 8539–8544. [DOI] [PMC free article] [PubMed] [Google Scholar]
- 13.Carter, N. J. & Cross, R. A. (2005) Nature 435, 308–312. [DOI] [PubMed] [Google Scholar]
- 14.Kolomeisky, A. B. & Fisher, M. E. (2003) Biophys. J. 84, 1642–1650. [DOI] [PMC free article] [PubMed] [Google Scholar]
- 15.Kolomeisky, A. B. & Fisher, M. E. (2000) J. Chem. Phys. 113, 10867–10877. [Google Scholar]
- 16.Nishiyama, M., Muto, E., Inoue, Y., Yanagida, T. & Higuchi, H. (2001) Nat. Cell Biol. 3, 425–428. [DOI] [PubMed] [Google Scholar]
- 17.Kolomeisky, A. B., Stukalin, E. B. & Popov, A. A. (2005) Phys. Rev. E 71, 31902. [DOI] [PubMed] [Google Scholar]
- 18.Uemura, S. & Ishiwata, S. (2003) Nat. Struct. Biol. 10, 308–311. [DOI] [PubMed] [Google Scholar]
- 19.Schnitzer, M. J., Visscher, K. & Block, S. M. (2000) Nat. Cell Biol. 2, 718–723. [DOI] [PubMed] [Google Scholar]
- 20.Yildiz, A., Tomishige, M., Vale, R. D. & Selvin, P. R. (2004) Science 303, 676–678. [DOI] [PubMed] [Google Scholar]
- 21.Rice, S., Lin, A. W., Safer, D., Hart, C. L., Naber, N., Carragher, B. O., Cain, S. M., Pechatnikova, E., Wilson-Kubalek, E. M., Whittaker, M., et al. (1999) Nature 402, 778–784. [DOI] [PubMed] [Google Scholar]
- 22.Koza, Z. (1999) J. Phys. A 32, 7637–7651. [Google Scholar]
- 23.Schief, W. R., Clark, R. H., Crevenna, A. H. & Howard, J. (2004) Proc. Natl. Acad. Sci. USA 101, 1183–1188. [DOI] [PMC free article] [PubMed] [Google Scholar]
Associated Data
This section collects any data citations, data availability statements, or supplementary materials included in this article.


