Abstract
Bees, like humans, can continue to see a surface from its color even when the scene's global illuminant changes (which is a phenomenon called color constancy). It is not known, however, whether they can also generate color-constant behavior in more natural complex scenes that are lit by multiple lights simultaneously, conditions in which most computational models of color constancy fail. To test whether they can indeed solve this more complex problem, bumblebees were raised in a highly controlled, yet ecological relevant environment consisting of a matrix of 64 artificial flowers under four spatially distinct lights. As in nature, the bees had no direct access to spectral information about the illuminants or flowers. Furthermore, the background of all of the flowers in the matrix was black, independent of illumination. The stimulus information presented to the bee was, therefore, far more constrained than that normally experienced in nature. And yet, bees learned to identify the rewarded flowers in each differently illuminated region of the matrix, even when the illumination of one of the regions was switched with one the bees had not previously experienced. These results suggest that bees can generate color-constant behavior by encoding empirically significant contrast relationships between statistically dependent, but visually distinct, stimulus elements of scenes.
Keywords: color, vision, color constancy, context learning, insect vision
The spectral quality of the light that falls on the eye is determined by surface reflectance and illumination: If the illuminant is changed, the light reaching the eye from the surface will also change. Any spectral element of a stimulus is therefore ambiguous vis-à-vis its underlying source, because its spectral quality could represent many different combinations of reflectance and illumination. Understanding how natural systems create a sense that different spectral returns represent the same surface (called color constancy) or that the same stimulus represents different surfaces (called color contrast) in the face of indeterminate spectral information remains a principal challenge for vision research.
Like humans, bees are trichromatic and are known to experience color constancy in the sense that they exhibit color-constant behavior (1-7). Thus, when trained to find a flower (placed on a larger uniformly chromatic background surface) under one global light, they can continue to find the same flower (based on its reflectance) under a new global illuminant. However, despite the fact that the stimulus arising from the floral target is different in both of these conditions of illumination, the problem is fairly straightforward to solve. The reason is that the stimulus ratio from the flower and its immediate surroundings will remain unchanged no matter the quality of their shared illuminant. As such, passively adapting the receptors to the spectral average of each scene [sometimes called von Kries adaptation (8)] or encoding the absolute contrast arising from a flower and its background will effectively discount the uncertain contribution of the illuminant to the stimulus. It is, therefore, commonly thought that both mechanisms are used by relatively simple organisms, such as insects, to overcome the inherent ambiguity of the absolute physical quality of a spectral stimulus. A more natural and challenging problem, however, is to generate color-constant behavior when multiple surfaces within the same scene are simultaneously under different lights (“dappled illumination” across a woodland floor is a particularly pertinent example for bees). Here, we test whether the visual system of the bumblebee, Bombus terrestris, can solve this more complex challenge.
Methods
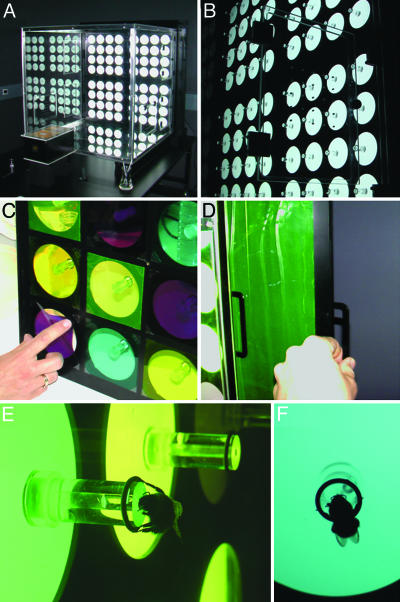
A Plexiglas flight arena measuring 1 m3 was centrally located within a black-walled room to eliminate uncontrolled, indirect illumination (Fig. 1). No natural daylight was admitted into the space. The Plexiglas floral array was lit from behind by six fluorescent Reptistar 5.0 tubes (Pet Safari, U.K.) located ≈15 cm behind the array. The tubes were housed within an anodized aluminum light-box. Light from the tubes was diffused by a single sheet of UV-transmitting white diffusion screen (no. 216; Rosco, Munich) to provide an even, homogenous illumination. Spectral irradiance of stimuli arising from each gel filter (Rosco) was measured with an Ocean Optics S2000 (Ocean Optics, Dunedin, FL) spectrometer relative to a calibrated deuterium/halogen radiation source DH 2000-CAL (Ocean Optics). Measurements are in μW per cm2 per nm and had to be converted into quantum-based spectra. The relative amount of light absorbed by each photoreceptor type was determined as described in refs. 9 and 10. Note that the distance between the color loci in the color hexagon is correlated with the degree to which two stimuli are perceived as differently colored, with the background color lying at the center of the hexagon. Thus, distance from the center to any of the hexagon's corners is unity. Therefore, the maximum distance between two opposite corners of the hexagon is a value of 2. Only the relevant subregion of this space is shown in the figures described below.
Fig. 1.
The floral matrix. Light from the matrix light-box arose from six Reptistar 5.0 fluorescent tubes placed behind a sheet of Plexiglas and a UV-transmitting diffuser (Rosco no. 216). The flowers were cylindrical in shape, measuring 20 mm in height, and were decorated with Plexiglas discs measuring 80 mm in diameter. See text for further description.
Results
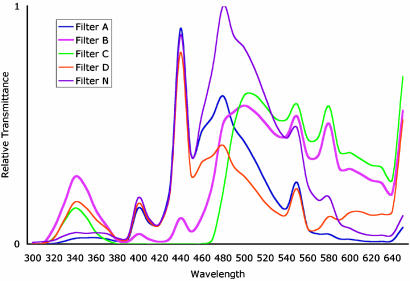
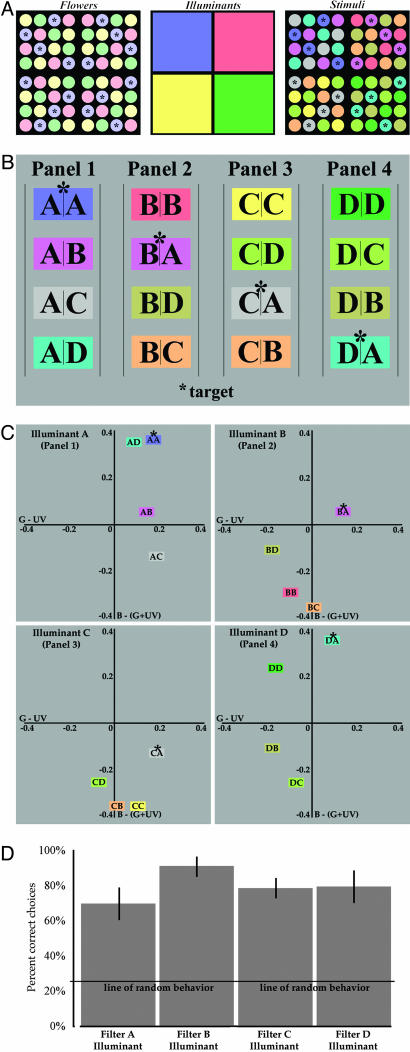
The Environment. Visually naïve bumblebees (B. terrestris) foraged from 64 Plexiglas flowers that were transilluminated by wave-lengths that span the visual spectrum of the bees (see Fig. 2). As shown in Fig. 1 A and B and schematically in Fig. 3A, the flower matrix was visually separated into four panels of 16 flowers each. The spectral quality of each flower was independently controlled with gel filters, as shown in Fig. 1C (see also Fig. 3A Left). Four filters were used (which, for simplicity, are referred to as A, B, C, and D); their spectral transmittances are given in Fig. 2. As shown schematically in Fig. 3A, each flower was repeated four times within each panel, but only the filter A flowers were rewarded (referred to subsequently as “targets”). Thus, across the array of 64 filtered flowers, 16 were targets (4 in each panel), and 48 were nontargets (12 in each panel).
Fig. 2.
Spectral transmittance of the five filters used in the two described experiments. See text for description.
Fig. 3.
Training paradigm, resulting empirical relationships between stimuli within each panel, and foraging results. (A) Schematic representation of the flower matrix. Bees experienced the configuration shown in Right, which were created by placing the floral matrix (Left) under one of four different illuminants (Center). (B) The 16 different combinations of flower color and illumination color generated in the matrix are shown schematically. The letter on the left of each column represents the illuminant filter, and the letter on the right represents the flower filter. An asterisk indicates the target under each illuminant. (C) Location of each of the 16 stimuli in bee color opponent space, plotted assuming perfect von Kries adaptation to the global spectral average of the scene (note that a subsection of the full opponent space is presented). An asterisk indicates the location of the target stimuli in each panel. (D) The average percentage of correct (± standard error) under each simultaneously presented illuminant.
Flowers were illuminated by one of four different lights by placing a second, larger filter behind each of the four panels (shown in Fig. 1D and schematically in Fig. 3A Center). The spectral quality of the “illuminant” filters was identical to those used to “color” the flowers (i.e., illuminant filters were also filter A, filter B, filter C, and filter D, the significance of which is described in Discussion). In short, the spectral quality of each stimulus (S) arising from the flower matrix was determined by the transmittance of two filters: the flower's filter (F1) and the illuminant's filter (F2), or S = F1 · F2 (see Fig. 3A Right). As in nature, then, the floral scene in which the bees were raised was under multiple, spatially distributed lights, and each stimulus element arising from the scene was ambiguous with respect to its underlying source. It is also important to stress that the space between the flowers was opaque, which means that the stimulus arising from the region immediate to the flowers did not vary with illumination.
Raising and Testing. The bees were raised in the above-described conditions for 5 h per day over a period of 5 days (the total lifespan of a nonqueen bumblebee is 2-3 weeks; the actual age of each bee used was unknown). All foragers were marked with number tags glued onto the dorsal side of their thorax. After each 30-min training session, the location of the flower filters and illuminant filters were randomized (to eliminate spatial information), and the Plexiglas flowers washed (to eliminate olfactory information). After training, marked foragers were individually tested in the arena for 6-12 min. Visits during testing were recorded by hand only when a bee landed on a flower and extended its proboscis into its empty, central chamber (see Fig. 1 E and F). Using this criterion is advantageous for three reasons: (i) it demonstrates behavioral commitment; (ii) it is consistent with the learned behavior of the bees for obtaining nectar during their ontogeny; and (iii) it eliminates more ambiguous behavioral responses such as “approaches” and/or “landings” from the data set.
In the first experiment, the arena was identical to the training conditions with two exceptions: the locations of the flowers and illumination were randomized, and all flowers were unrewarded. Only the results of bees that visited flowers in all four panels were considered (which, in this case, were all six foragers). Their responses were pooled, after first confirming behavioral homogeneity of the population within each panel by using the Brandt and Snedecor χ2 formula. During testing, there were 147 visits to flowers across the matrix: 42 to flowers under filter A illuminant, 23 to filter B illuminant, 40 to filter C illuminant, and 42 to filter D illuminant. No illuminant filter was therefore preferred or avoided. Of the 147 visits, 114 were to target flowers (i.e., flowers that were colored with filter A independent of illumination). Thus, the proportion of correct responses (k) across all four illuminants was 0.78, which is significantly greater than a k of 0.25 predicted from random behavior (d = -6.852; P <0.001 by using a normal approximation to a binomial distribution). Within each panel, the average number of visits to the target flowers was 69% under the filter A illuminant, 91% under the filter B illuminant, 78% under the filter C illuminant, and 79% under the filter D illuminant (Fig. 3D). When these data are subjected to a 4 × 2 contingency test, in which the columns represent the four conditions of illumination, there was no significant deviation, demonstrating a homogenous response under each condition (χ2 = 4.3 with 3 degrees of freedom). Thus, bees learned to generate color-constant behavior within each of the four regions of illumination, suggesting that bees can perform simultaneous color constancy, much like humans (11-14). It is also important to note that bees were as proficient at selecting targets at the edges of panels, i.e., between regions of illumination, as they were at selecting nonboundary targets..
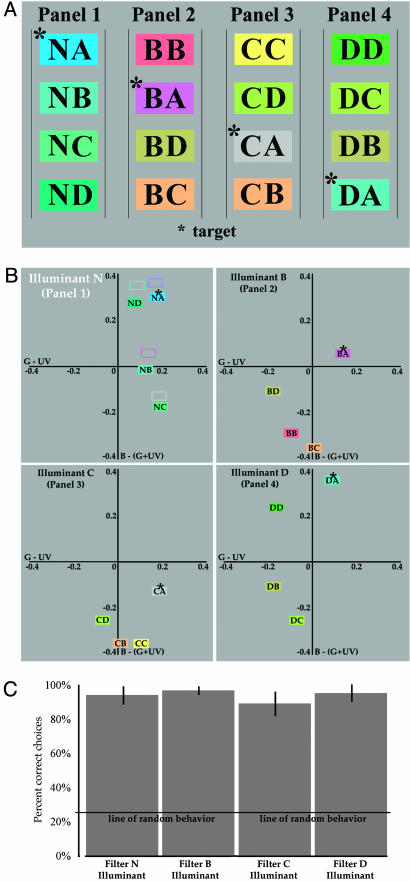
To test for their ability to generalize behavior to a novel illuminant, a new set of foragers (raised under the same conditions as above) were presented with only three of the training illuminants (filters B, C, or D) and one novel (untrained) illuminant (filter N; shown schematically in Fig. 4A). The location of the stimuli in bee color opponent space generated by the novel illuminant (N) are shown in Fig. 4B (the spectral transmittance of this filter is shown in Fig. 2.) As in the first experiment, only the results from bees that visited all four panels were considered. In this case there were 14 foragers, 12 of which visited more than one panel: 3 bees visited two panels, 9 bees visited three panels, and 6 bees visited all four panels). Responses were pooled after first confirming behavioral homogeneity of the population (n = 6) within each panel by using the Brandt and Snedecor χ2 formula.
Fig. 4.
Resulting empirical relationships between the stimuli within each panel and the foraging results. (A) The 16 different combinations of flowers and illuminants presented to bees in the second test (see text for description). Flowers in panel 1 are under novel illuminant N, whereas the flowers in panels 2-4 are under trained conditions of illumination. As in Fig. 3, the letter on the left in each column represents the illuminant filter; the letter on the right represents the flower filter; and the asterisk indicates the target under each illuminant. (B) Location of each of the 16 stimuli in bee color opponent space plotted according to perfect von Kries adaptation to the global spectral average of the scene (note that a subsection of the full opponent space is presented). Asterisks show the location of the target stimuli in each panel. The unfilled boxes in panel 1 show the location of the trained targets in Fig. 3C. (C) The average percentage of correct (± standard error) under each simultaneously presented illuminant.
There were 93 visits to flowers across the matrix in this second test, which was again evenly distributed across all four panels: 20 to filter N illuminant, 28 to filter B illuminant, 17 to filter C illuminant, and 28 to filter D illuminant. Bees therefore visited flowers under the novel illuminant as often as they did flowers under the training illuminants. The total number of visits to the target flower (filter A) across the entire floral array was 86, making the proportion of correct responses (k) 0.92, which is significantly greater than random behavior (d = -5.346; P <0.001 by using a normal approximation to a binomial distribution). Within each panel, the average number of visits to the target flowers was 95% under the novel filter N illuminant, 96% under the filter B illuminant, 82% under the filter C illuminant, and 92% under the filter D illuminant (Fig. 4C). When subjected to a 4 × 2 contingency test, there was no significant difference between these panels (χ2 = 3.3 with 3 degrees of freedom). These data show that bees can generate color-constant behavior under the conditions described here when confronted with illuminants not previously experienced.
Discussion
Previous research has shown that bees can generate color-constant behavior toward scenes composed of multiple flowers on uniform backgrounds (usually green) under different global illuminants (1-7). The most parsimonious explanation of those earlier results is that bees adapt their visual receptors to the scene's spectral average (4, 6, 7) because this strategy would effectively “discount” the uncertain effects of illumination from the stimulus. A more recent study, however, casts doubt on this sort of explanation because bumblebees can in fact use information about the illuminant itself as a contextual cue for differentiating between colored flowers (15), suggesting that information about the illuminant is not in any real sense discounted at all. In the present study, we show that bees can also parse scenes into its different regions of simultaneous illumination while, within each region, generating color-constant behavior.
In rationalizing how bees generated color-constant behavior under the conditions used in this study, it is necessary to consider the actual information they experienced during their foraging lives. Remembering that the spectral quality of each stimulus in the array is determined by both the flower's filter and illuminant's filter, each stimulus can be represented symbolically, as in Figs. 3B and 4A, in terms of its underlying source: the illuminant filter is represented by the letter on the left side of each column, and its underlying flower filter is represented by the letter on the right side of the same column. For instance, AB in panel 1 represents flower B under illuminant A; each such flower/illuminant combination is repeated four times in each panel, but this superfluous information is not shown here. Close examination of this diagram reveals three important facts about the physical nature of the stimulus matrix. First, whereas 16 different flower/illuminant combinations were generated across the matrix (as shown schematically by the color of the blocks in Fig. 3B), only 4 of these combinations generated unique stimuli, and only 1 of these 4 was from a rewarded flower. As such, most spectral stimuli were shared between panels. For example, the stimulus generated by filter A flowers under filter B illumination (BA in panel 2 of Fig. 3B) was physically identical to the stimulus generated by filter B flowers under filter A illumination (AB in panel 1 of Fig. 3B), given that BA = AB. Other examples of shared stimuli are found between panels 1 and 3 (AC and CA, respectively), and in panels 1 and 4 (AD and DA, respectively). Thus, no panel was unique in the actual stimuli it generated. More importantly, it also means that stimuli generated by rewarded flowers under illuminants B-D (shown in panels 2-4) were physically identical to the stimuli generated by the unrewarded flowers (B-D) under illuminant A (AB, AC, and AD) in panel 1 (where the target is AA).
Given these facts about the flower matrix, the bees could not have used any of the following strategies to resolve the behavioral ambiguity of the stimuli they experienced: (i) they could not have simply memorized the absolute quality of rewarded stimuli, given that stimuli from rewarded flowers in some panels were identical to stimuli from unrewarded flowers in others, as noted above; (ii) they could not have relied on adapting to the global spectral average of the matrix, because doing so would continue to map identical stimuli from rewarded and unrewarded flowers to the same locations in bee color space (as shown in Fig. 3C); and/or (iii) they could not have encoded the spectral contrast between a flower and its background. Because the black background did not vary with illumination, such contrast information is isomorphic with the absolute spectral quality of the flower's stimulus. As with ii, then, applying this third strategy would also have been an ineffective way to differentiate between identical stimuli arising from rewarded and unrewarded flowers.
Rather, the only way the bees could have identified the rewarded flowers in each panel would have been to use relational information, not between a flower and its background, but between the flowers themselves. The merits of this hypothesis can be directly considered by analyzing the constellation of stimulus elements arising from the flowers in each panel plotted in bee opponent color space (e.g., Fig. 3C). Notice that in each case the color locus of the rewarded flower, relative to the unrewarded flowers, is always described by the same vector, one pointing toward the upper right of the space, corresponding to an increased activation of the blue and green receptors. Simply stated, the behaviorally relevant stimulus, although varying in absolute terms, was always the bluest-green stimulus within each panel. As such, for this relational strategy to be effective, the bees had to constrain their contextual processing to flowers under the same light.
Thus, one mechanism for generating color-constant behavior could have been to encode or adapt to the spectral differences between neighboring flowers independent of their location across the matrix; in other words, to simply broaden the window of contextual processing beyond a flower's immediate (black) background to include flowers in its more distant surround. The problem with this strategy, however, is that it would lead to an increase in the number of foraging errors at the internal edges of each panel, where the “local” flower population spans multiple illuminants (especially at the four central positions of the matrix where all four illuminants converge). However, spatial analysis of the foraging data revealed that the bees were just as adept, if not better, at finding the target flowers at the boundaries between illuminants as they were when the rewarded flowers were in the middle of a panel, suggesting that this strategy was not used. A more likely strategy, therefore, is that the bees used a hierarchical approach of encoding low spatial frequency contrast information across the floral matrix (as this information was highly correlated with the boundaries between lights), which was then used to constrain their processing of higher spatial frequency relational information from the individual flowers within each spatially demarcated region. Menzel and Kien (16) found single cells in honeybee brain with some of the necessary opponent characteristics that are consistent with this hypothesis.
Together, these data demonstrate that relatively simple organisms, such as the bee, can generate color-constant behavior within far more complex and natural environments than had previously been tested. The data also suggests that color-constant behavior is not necessarily generated by adapting to the local or global spectral average of stimuli, but represents an active process of encoding behaviorally relevant contrast relationships at different spatial frequencies according to the success and/or failure of recent experience (17), which enables the bee to adapt its color behavior and underlying physiology according to the ecological statistics of novel environments.
Acknowledgments
We thank Pete Bex, Steven Dakin, Gary Rubin, and Adam Sillito for their contribution to this study at its various stages and Lars Chittka for his help in the spectral measurements and for many useful discussions. This work was supported by the Wellcome Trust and Fight for Sight.
Author contributions: R.B.L. designed research; and R.B.L. and M.W. performed research, analyzed data, and wrote the paper.
Conflict of interest statement: No conflicts declared.
This paper was submitted directly (Track II) to the PNAS office.
References
- 1.Neumeyer, C. (1981) J. Comp. Physiol. 144, 543-553. [Google Scholar]
- 2.Werner, A., Menzel, R. & Wehrhahn, C. (1988) J. Neurosci. 8, 156-159. [DOI] [PMC free article] [PubMed] [Google Scholar]
- 3.Finlayson, G. D., Drew, M. S. & Funt, B. V. (1994) J. Opt. Soc. Am. A 11, 3011-3019. [DOI] [PubMed] [Google Scholar]
- 4.Dyer, A. G. (1999) J. Comp. Physiol. A 185, 445-453. [Google Scholar]
- 5.Vorobyev, M., Marshall, J., Osorio, D., Hempel de Ibarra, N. & Menzel, R. (2001) Color Res. Appl. 26, 214-217. [Google Scholar]
- 6.Dyer, A. G. & Chittka, L. (2004) J. Comp. Physiol. A 190, 105-114. [DOI] [PubMed] [Google Scholar]
- 7.Chittka, L. & Harrington, W. (2004) Complex Worlds from Simpler Nervous Systems, ed. Prete, F. R. (MIT Press, Cambridge, MA).
- 8.von Kries, J. (1905) in Handbuch der Physiologie des Menschen, ed. Nagel, W. (Vieweg, Braunschweig, Germany), pp. 109-282.
- 9.Chittka, L. (1992) J. Comp. Physiol. A 170, 533-543. [Google Scholar]
- 10.Chittka, L. (1996) J. Theor. Biol. 181, 179-196. [Google Scholar]
- 11.Foster, D. H., Nascimento, S. M. C., Craven, B. J., Linnell, K. J., Cornelissen, F. W. & Brenner, E. (1996) Vision Res. 37, 1341-1345. [DOI] [PubMed] [Google Scholar]
- 12.Lotto, R. B. & Purves, D. (1999) Nat. Neurosci. 2, 1010-1014. [DOI] [PubMed] [Google Scholar]
- 13.Lotto, R. B. & Purves, D. (2000) Proc. Natl. Acad. Sci. USA 97, 12834-12839. [DOI] [PMC free article] [PubMed] [Google Scholar]
- 14.Lotto, R. B. & Purves, D. (2001) J. Cognit. Neurosci. 13, 547-555. [DOI] [PubMed] [Google Scholar]
- 15.Lotto, R. B. & Chittka, L. (2005) Proc. Natl. Acad. Sci. USA 102, 3852-3856. [DOI] [PMC free article] [PubMed] [Google Scholar]
- 16.Kien, J. & Menzel, R. (1977) J. Comp. Physiol. A. 113, 35-53. [Google Scholar]
- 17.Lotto, R. B. (2005) Curr. Biol. 14, R619-R621. [Google Scholar]


