

Abstract
Equilibrium Fourier transform infrared (FTIR) and temperature-jump (T-jump) IR spectroscopic techniques were used to study the thermodynamics and kinetics of the unfolding and folding of the villin headpiece helical subdomain (HP36), a small three-helix protein. A double phenylalanine mutant (HP36 F47L, F51L) that destabilizes the hydrophobic core of this protein also was studied. The double mutant is less stable than wild type (WT) and has been shown to contain less residual secondary structure and tertiary contacts in its unfolded state. The relaxation kinetics after a T-jump perturbation were studied for both HP36 and HP36 F47L, F51L. Both proteins exhibited biphasic relaxation kinetics in response to a T-jump. The folding times for the WT (3.23 μs at 60.2°C) and double phenylalanine mutant (3.01 μs at 49.9°C) at the approximate midpoints of their thermal unfolding transitions were found to be similar. The folding time for the WT was determined to be 3.34 μs at 49.9°C, similar to the folding time of the double phenylalanine mutant at that temperature. The double phenylalanine mutant, however, unfolds faster with an unfolding time of 3.01 μs compared with 6.97 μs for the WT at 49.9°C.
Keywords: protein folding, Fourier transform IR, temperature jump, diffusion collision
The mechanism by which an unfolded polypeptide chain folds into its final native structure is still not fully understood, despite the obvious importance of the protein folding problem. In recent years there has been considerable interest in small single-domain proteins that fold quickly. These proteins provide attractive systems for computational and theoretical studies, and they are useful experimental models of the early steps in the assembly of more complicated folds. The helical subdomain derived from the villin headpiece, HP36, is a small three-helix structure found in the extreme C terminus of villin (Fig. 1). Its modest size and helical structure suggest that it should fold rapidly, and this hypothesis has been independently confirmed by fluorescence-detected temperature-jump (T-jump) studies and NMR lineshape analysis (1–3). The helical subdomain is probably the smallest occurring natural sequence that has been shown to fold cooperatively. Its small size and very rapid folding have made it the focus of a large number of theoretical and computational studies (4–18).
Fig. 1.

Structure of the WT villin headpiece helical subdomain (HP36) (Protein Data Bank ID code 1VII) illustrating the Phe residues (F47, F51, and F58) present in the hydrophobic core.
Residual structure and interactions in the unfolded state may play an important role in determining the rate of protein folding. Unfolded state structure might contribute to rapid folding by constraining and limiting the initial conformational search in the unfolded basin. Some models of folding postulate an important role for residual unfolded state structure. The diffusion collision model, for example, has been applied to rapidly folding helical proteins, and a key parameter in the model is the intrinsic stability of the individual microdomains (11, 19, 20). Although there have been a number of experimental studies of fast folding proteins, surprisingly little work has been reported that analyzes the effects of unfolded state structure. HP36 is a very good model system for such studies. The unfolded state of wild-type (WT) HP36 has been shown to contain residual secondary structure and tertiary contacts, stabilized in part by interactions involving a set of phenylalanine (Phe) residues. A peptide model comprised of the first two short α-helices of HP36 contained considerable helical structure and significant tertiary interactions. NMR studies demonstrated that similar structure is found in the thermally unfolded state of the intact domain (21). Replacement of F47 and F51 by leucine (Leu) in the peptide reduced significantly the degree of helical structure, demonstrating that the structure is stabilized by interactions involving the two Phes. The direct implication is that the double mutation F47L, F51L (HP-36 F47L, F51L) reduces unfolded state structure in the intact domain. McKnight and coworkers (22) have shown that the double mutant is still folded although significantly destabilized. Comparison of the WT headpiece helical subdomain with the F47L, F51L double mutant thus offers the opportunity to analyze the effects of modulating residual unfolded state structure on an ultrafast folding reaction. Here, we report the use of infrared (IR) detected T-jump methods to investigate the folding kinetics of WT HP36 and the double Phe → Leu mutant. Nanosecond T-jump methods are well suited for studies of rapid folding reactions and have been applied to a range of systems (23–28). The use of IR detection also provides an additional probe of the folding of HP36. Previous studies of the WT subdomain have relied on fluorescence detection (1, 3) or NMR lineshape analysis (2). The IR measurements report on the global development of secondary structure and are thus complementary to previous studies.
Materials and Methods
Sample Preparation. The WT villin headpiece subdomain (HP36) and double mutant (HP36 F47L, F51L) were chemically synthesized by using standard 9-flourenylmethyloxycarbonyl protocols and purified through reverse-phase HPLC. The identity of the purified products was confirmed by mass spectrometry. The C termini of both proteins are amidated. The amidated C terminus does not alter the structure, although it slightly reduces the melting temperature. The proteins were lyophilized from D2O (Cambridge Isotope Laboratories, Cambridge, MA) to allow deuterium–hydrogen exchange of the amide protons to occur. The proteins were dissolved in a buffer containing 10 mM sodium phosphate and 150 mM sodium chloride at a pH* of 5.3 in D2O. [pH* refers to the uncorrected (for D2O) pH-meter reading at 25°C.] The protein solutions were filtered to remove any aggregates present and used without any further purification. The protein solutions for the IR experiments had a concentration of 1–2 mM.
Equilibrium Fourier Transform IR (FTIR) Temperature-Dependent Measurements. Equilibrium FTIR temperature-dependent spectra were recorded on a Bio-Rad FTS-40A FTIR spectrometer equipped with a liquid nitrogen-cooled mercury–cadmium–telluride detector. The spectra were the result of either 256 or 512 scans recorded at a resolution of 2 cm–1. The proteins were dissolved in D2O (instead of H2O) to remove solvent interference in the Amide I′ region [the prime (′) indicates that D2O is the solvent]. A split IR cell composed of CaF2 windows was used with a path length of 100 μm to record the spectrum of both the reference (buffer in D2O) and the sample (protein in the buffer in D2O) side of the IR transmission cell under identical conditions at each temperature. The temperature of the IR cell was controlled by a water bath, and the sample temperature was measured by a thermocouple attached to the cell. The absorbance spectra of the proteins were determined from the negative logarithm of the ratio of the single-beam spectrum of the sample to the reference side of the IR split cell at each temperature. The absorbance spectra for HP36 F47L, F51L were baseline corrected using a single point at 1,750 cm–1 by subtracting the absorbance at this wavenumber from the rest of the absorbance values at each temperature. The equilibrium thermal unfolding of the proteins was found to be reversible (absence of aggregation).
Time-Resolved T-Jump IR Kinetic Measurements. The time-resolved T-jump apparatus used to measure the protein relaxation kinetics in this work is described in ref. 28. The method is a pump–probe experiment where 1.91-μm radiation is the pump beam that initiates a rapid T-jump in the sample, thereby perturbing the folding equilibrium. An IR diode is used to probe structural changes in the sample as the system relaxes to a new equilibrium at the final temperature after the T-jump. The 1.91-μm (10-ns full width at half-maximum Gaussian pulse width, ≈23 mJ per pulse) pump radiation was obtained from a H2-filled Raman shifter (1 stokes shift) pumped by a 10-ns pulsed 10-Hz repetition rate Q-switched DCR-4 neodymium:yttrium–aluminum–garnet laser (Spectra-Physics) and was absorbed by weak combination bands in the D2O solution. This pump radiation was chosen because of its transmission properties (87% pump radiation transmitted through 100-μm path length sample cell) that allows for nearly uniform heating in the pump–probe overlap region and because most peptides and proteins do not absorb at this wavelength. The same split cell used for the equilibrium FTIR experiments was used for the kinetic measurements. The reference D2O compartment serves as an internal thermometer in these experiments to determine the magnitude of the T-jump.
The probe is a continuous-wave lead salt IR diode laser (Laser Components Instrument Group, Wilmington, MA) that is tunable in the 1,600- to 1,700-cm–1 region. A fast (50 MHz) photovoltaic mercury–cadmium–telluride detector (Kolmar Technologies, Newburyport, MA) measured the changes in transmission of the IR probe beam, and a digitizer (Tektronix 7612D) was used to digitize the signal. The probe beam was focused to 50 μm at the center of the heated volume to ensure uniform temperature distribution in the probe volume to eliminate effects from the temperature gradients produced by the wings of the Gaussian pump beam (1 mm beam diameter). The T-jump apparatus has a response time of ≈23 ns that was limited by the detector rise time because thermal equilibration in D2O occurs in the subnanosecond time scale. The transient kinetic traces in response to a T-jump of both the sample and reference sides were recorded under identical conditions and were the average of 2,000 laser perturbations. The initial temperature (before the T-jump) was controlled and measured in the same way used for the equilibrium FTIR measurements. The resulting T-jumps ranged in magnitude from 5 to 15°C. The relaxation kinetics of the protein were extracted from the kinetic traces by subtracting the change in absorbance of the reference (D2O buffer) from the sample (protein in D2O buffer). The transient kinetic traces were recorded from the nanosecond to tens of milliseconds time regime with the thermal energy diffusing from the pump–probe interaction volume in ≈20 ms.
The protein relaxation kinetic traces were fit to a biexponential function given as
 |
[1] |
where A0 is an offset, A1 and A2 are preexponential factors, k1 and k2 are the rates, and t is the time. The relaxation time (τ) is determined from the inverse of the rate (τ = 1/k). The change in absorbance of D2O (ΔA) as a function of temperature was determined by static (equilibrium) IR measurements using
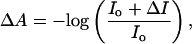 |
[2] |
where Io is the IR intensity at the lowest temperature and ΔI is the change in IR intensity at a given temperature relative to Io. These data formed the calibration curve that was used to determine the magnitude of the T-jumps by monitoring the transient change in absorbance of D2O after the laser pulse. The data analysis was performed in igor pro (WaveMetrics, Lake Oswego, OR).
Pulse-Field Gradient NMR Diffusion Measurements. Pulse-field gradient NMR experiments were used to measure the diffusion coefficients of HP36 and HP36 F47L, F51L in D2O at pH* 5.2. Protein sample was dissolved in 100% D2O, and 1,4-dioxane was added as an internal standard. WT was examined at 1.2 mM protein concentration (by weight), and the double mutant was examined at 1.2, 1.5, and 3 mM concentration (weight). Susceptibility plugs were used to fix the sample height within the probe coil. Data were acquired on a Varian 600-MHz NMR spectrometer at 25.0°C as described by Li et al. (29) A series of 1D NMR spectra were taken with increasing pulse-field gradient strength. Diffusion coefficients were converted to radii of hydration (Rh) by using dioxane as an internal standard following the method of Smith and coworkers (30). Details of the data analysis are described by Li et al. (29).
Results and Discussion
Structure of the Villin Headpiece Subdomain and Choice of Mutations. The structure of the WT chicken villin headpiece helical subdomain (HP36) is shown in Fig. 1. HP36 is at the C terminus of the actin-bundling protein villin and is the C-terminal subdomain of the villin headpiece. The structure of the subdomain is essentially identical to the same region in the intact headpiece (31–33). The sequence of the protein is MLSDEDFKAVFGMTRSAFANLPLWKQQNLKKEKGLF. The numbering system used here corresponds to that used in other publications. The first residue of our HP36 construct is a Met, included because prior studies of recombinant versions of the headpiece helical subdomain included an additional N-terminal Met. This Met is not found in the intact headpiece. The second residue is designated Leu-42, and the C terminus is Phe-76. Our construct has an amidated C terminus. This feature does not affect the structure, although it slightly decreases the melting temperature (2). HP36 is made up of three helices. Two short helices are defined in the NMR structure consisting of residues Asp-44 to Lys-48 and Arg-55 to Phe-58. A longer helix is located in the C-terminal region of the subdomain (Leu-63–Lys-72) (33). The three helices pack together to form the hydrophobic core (Fig. 1). Three key Phe residues (47, 51, and 58) that help stabilize the hydrophobic core are shown in Fig. 1. F47 and F51 were replaced by Leu to form the HP36 F47L, F51L double mutant. McKnight and coworkers (22) used NMR and near- and far-UV CD to show that the domain can tolerate this double mutation and still fold, although it is significantly less stable than WT. In that study, gel filtration was used to demonstrate that the double mutant was monomeric at concentrations in the 100-μM range. IR measurements are normally conducted at higher protein concentration; thus, pulsed field gradient NMR diffusion measurements were performed to test for self-association at higher concentrations. The WT is known to be monomeric and the radius of hydration (Rh) measured using pulsed field gradient NMR was found to be 12.6 Å at 1.5 mM protein, in good agreement with the value of 13.4 Å calculated from empirical correlations of protein size with Rh (30). For comparison, the value of Rh expected for a folded protein of twice the size of HP36 is 16.4 Å (30). The measured Rh of the mutant was slightly larger than for WT, at 13.5 Å at 1.2 and 1.5 mM. This result is consistent with the presence of a small fraction of unfolded molecules and is in good agreement with the earlier gel-filtration studies (22). The value of Rh of the mutant increases at 3 mM, perhaps because of some self-association at this higher concentration. Consequently, the IR measurements were made at 1.4–1.5 mM.
Equilibrium Unfolding of HP36 and HP36 F47L, F51L. IR spectroscopy in the Amide I′ region was used to study the equilibrium stability of HP36 and HP36 F47L, F51L as a function of temperature. The Amide I′ band is composed primarily of carbonyl (C O) stretching of the peptide backbone. The energy of this vibration is sensitive to the secondary and tertiary structure of the protein. The Amide I′ band is complex because of contributions from multiple carbonyl groups in different local environments and hydrogen-bonding configurations. However, to identify subcomponents of this band, difference FTIR spectra can be formed by subtracting the absorbance spectrum at the lowest temperature from the rest of the absorbance spectra at higher temperatures.
The Amide I′ absorbance band for HP36 is centered at 1,645 cm–1 at 4.5°C. This frequency corresponds to an α-helical protein consistent with the known structure of HP36 (data not shown). The equilibrium difference FTIR absorbance spectra of HP36 are shown in Fig. 2A in the 1,550–1,750 cm–1 region as a function of temperature from 4.5 to 87.2°C in ≈2.5°C increments. The low-temperature spectrum was the same before and after the melt, and there were no signs of irreversible aggregation. The difference spectra were formed by subtracting the lowest-temperature absorbance spectrum from the higher-temperature absorbance spectra. The difference spectra do not show the presence of a single isosbestic point, indicating that more than one process is occurring in the melt of this protein. Fig. 2 A shows a decrease in intensity in the region ≈1,600–1,656 cm–1 and an increase in intensity in the ≈1,656–1,700 cm–1 region as the temperature is increased. The decrease in intensity is due to the loss of secondary and tertiary structure. The increase in intensity in the 1,656–1,700 cm–1 region with increasing temperature results from the formation of more disordered regions. In the 1,600–16,56 cm–1 region of the difference spectra, there are two primary components at ≈1,630 and 1,645 cm–1. The mode at 1,630 cm–1 probably arises from carbonyl groups in α-helices that are solvent exposed, whereas the mode at 1,645 cm–1 likely results from carbonyl groups in the α-helices that are less exposed to water (34, 35). Hydrogen-bonding between the carbonyl groups of the peptide backbone and the aqueous solvent in addition to hydrogen-bonding within the α-helix results in a lower energy for the carbonyl stretch. The decrease in intensity at 1,674 cm–1 could be due to the melt of a turn region upon heating. The corresponding melt curves for this protein monitored at 1,630 cm–1 (open squares) and 1,645 cm–1 (filled squares) are shown in the Fig. 2 A Inset. The melt curves plot the change in absorbance as a function of temperature for HP36 at 1,630 and 1,645 cm–1 monitoring primarily the melt of the solvated and buried helical components, respectively. The curves do not follow the pure melt of these components, however, because the bands due to the different helical environments overlap. The melt curve at 1,645 cm–1 shows a cooperative melt transition due to the global unfolding (break up of the hydrophobic core). The melt curve monitored at 1,630 cm–1 appears less cooperative, displaying a significant linear dependence on temperature before the cooperative transition. The sigmodial transition also appears broader than the transition monitored by the 1,645-cm–1 curve. The linear component could be due to changes in hydrogen-bonding between the solvent and the solvated component of the helices due to local structural changes resulting from the change in temperature. The midpoint for the cooperative unfolding transition of HP36 is ≈62°C.
Fig. 2.

Difference FTIR spectra of HP36 (A) and HP36 F47L, F51L (B) as a function of temperature in the range 4.5–87.2°C in ≈2.5°C increments and 5.4–83.2°C in ≈5°C increments, respectively, in the 1,550–1,750 cm–1 spectral region. Difference spectra were formed by subtracting the lowest temperature absorbance spectrum for each protein from the spectra at the higher temperatures. Insets show the change in absorbance as a function of temperature at 1,630 cm–1 (open squares) and 1,645 cm–1 (filled squares).
The Amide I′ absorbance band for HP36 F47L, F51L is centered at 1,645 cm–1 at 5.4°C as expected for an α-helical protein (data not shown). The temperature-dependent equilibrium difference FTIR spectra are shown in Fig. 2B. Similar to HP36, the low-temperature spectrum was the same before and after the melt, and there were no signs of irreversible aggregation. The temperature-dependent FTIR difference spectra of HP36 F47L, F51L do not show a single isosbestic point, indicating that at least two processes occur in the melt of this protein. As the temperature is increased, the intensity in the region ≈1,600–1,656 cm–1 decreased because of the loss of secondary and tertiary structure, whereas the intensity in the range of ≈1,656–1,700 cm–1 increased because of increasing amounts of disordered regions of the protein. The difference spectra of the double mutant show two primary components due to solvated and buried helix components at ≈1,630 and 1,645 cm–1, respectively. However, the 1,645-cm–1 component is not as prominent as for HP36. This observation is consistent with the hydrophobic core of HP36 F47L, F51L being destabilized relative to the WT protein, resulting in the presence of unfolded protein and a greater fraction of solvent exposed helix at the starting temperature of the melt. There is no decrease in intensity at 1,674 cm–1 as the temperature was increased. One possible explanation for this difference with WT is that the turn region in HP36 is not present in the double mutant. Fig. 2B Inset shows the melt curves for HP36 F47L, F51L monitored at 1,630 cm–1 (open squares) and 1,645 cm–1 (filled squares). The 1,630-cm–1 curve monitors primarily the solvated helix component, whereas the 1,645-cm–1 curve mainly reports on the buried helical component. Like the behavior observed for the WT protein, the melt curves do not follow the pure melt of the individual components because the bands due to the different helical environments overlap. However, the buried helical component is less prominent in the double Phe mutant, and both melt curves show a strong linear temperature dependence before the broad cooperative unfolding transition. The midpoint for the broad cooperative unfolding transition of HP36 F47L, F51L is ≈50°C.
Time Resolved T-Jump IR Spectroscopy. The relaxation kinetics of both WT and the double Phe mutant of the villin headpiece subdomain were investigated in response to a rapid perturbation (T-jump) to the system applied at various initial temperatures. The relaxation kinetics were monitored at 1,632 and 1,650 cm–1 to probe the solvated and buried helical components, respectively, as a function of temperature. The T-jumps were typically 5–15°C. Representative relaxation kinetic traces for HP36 and HP36 F47L, F51L are shown in Fig. 3 together with a biexponential fit. The relaxation times and relative amplitude percentages are given in Table 1. The kinetic traces in Fig. 3 A and B show biphasic relaxation kinetics for both protein samples in agreement with earlier T-jump fluorescent studies (1). The relative amplitudes of the two phases are protein- and probe-wavelength dependent. The slow phase has a larger relative amplitude in the 1,650-cm–1 data that follows the buried helical regions of the proteins, whereas the fast phase has a larger amplitude in the 1,632-cm–1 kinetic traces that follows the solvated helical regions of the proteins. However, the bands for the buried and solvated helical regions of the α-helices overlap, resulting in the observation of both kinetic phases at each of these probe wavelengths. The relaxation kinetics for the double Phe mutant are dominated by the fast phase unlike the WT where both the fast and slow phases have significant amplitudes. The difference might reflect disruption of the hydrophobic core in HP36 F47L, F51L relative to HP36 that leads to a significant population of the unfolded protein throughout the temperature range studied.
Fig. 3.

Relaxation kinetics and relaxation rates. (A and B) Representative kinetic traces of the relaxation kinetics of HP36 (A) and HP36 F47L, F51L (B) at 1,632 and 1,650 cm–1 (dashed curves) fit to a biexponential function (solid curves). The temperature after the T-jump (Tf) is noted on the graph with T-jumps ranging from 5 to 15°C. (C and D) Plots of the natural log of both observed relaxation rates as a function of the inverse of the temperature for HP36 (C) and HP36 F47L, F51L (D). The relaxation rates were measured at 1,632 and 1,650 cm–1.
Table 1. Representative relaxation rates, times, and amplitudes of T-jump transients.
| Fast relaxation
|
Slow relaxation
|
||||
|---|---|---|---|---|---|
| Probe wavelength, cm-1 | Tf, °C | Rate, s-1 | Time, ns (% amplitude) | Rate, s-1 | Time, μs (% amplitude) |
| HP36 | |||||
| 1,632 | 48.5 | 9.63 × 10⁶ | 104 (56) | 3.96 × 10⁵ | 2.53 (44) |
| 1,650 | 49.9 | 8.26 × 10⁶ | 121 (49) | 4.43 × 10⁵ | 2.26 (51) |
| HP36 F47L, F51L | |||||
| 1,632 | 47.6 | 1.40 × 10⁷ | 71 (81) | 6.81 × 10⁵ | 1.47 (19) |
| 1,650 | 49.9 | 1.03 × 10⁷ | 97 (79) | 6.65 × 10⁵ | 1.50 (21) |
The observed relaxation kinetics for HP36 and HP36 F47L, F51L as a function of the inverse of the temperature are plotted in Fig. 3 C and D. Both relaxation phases were found to be weakly temperature-dependent, although the slow relaxation rates exhibited a larger temperature dependence relative to the fast relaxation rates. The fast ≈100-ns relaxation time is likely indicative of the helix–coil transition, based on comparison to α-helical peptide models that show relaxation times from 100 to 300 ns (23–26). Changes in solvation around the solvated components of the helices also might contribute to the fast phase. The slow microsecond phase is likely following the formation or disruption of tertiary contacts required for the folded native structure.
The folding rates of the WT and double Phe mutant can be conveniently compared at the midpoint temperature, Tm, of each protein, assuming that the global unfolding of the proteins can be approximated by a two-state model described by the slow, microsecond relaxation phase. At Tm the folding and unfolding rates are equal, resulting in the folding rate equal to one-half of the observed relaxation rate because the equilibrium constant is one at this temperature. The folding times at the approximate Tm values were found to be 3.23 μs for HP36 at 60.2°C and 3.01 μs for HP36 F47L, F51L at 49.9°C. The measured folding time for the WT is in good agreement with fluorescence-detected T-jump studies performed on a slightly different variant of HP-36 (1). To compare the folding rates at the same temperature requires a means of estimating the relative population of the folded and unfolded states. The populations were determined from the temperature-dependent equilibrium FTIR experiments. The folding times were compared at the midpoint temperature of the mutant, 50°C, because this comparison requires that only the temperature-dependent equilibrium constants be determined for WT HP36. Thus, the estimated folding times should be more precise. Note that WT HP36 still contains significant residual unfolded state structure at this temperature (21). The folding times are 3.34 μs for HP36 and 3.01 μs for HP36 F47L, F51L at 49.9°C and are listed in Table 2. The folding times are weakly dependent on temperature so any imprecision in the determination of Tm does not alter the basic observation that the folding time of WT and the double mutant are very similar. The double Phe mutant, however, unfolds faster with an unfolding time of 3.01 μs compared with 6.97 μs for the WT at 49.9°C.
Table 2. Observed relaxation rates and derived folding and unfolding rates measured at 1,650 cm-1.

|
Relaxation
|
Folding
|
Unfolding
|
|||
|---|---|---|---|---|---|---|
| Rate, s-1 | Time, μs | Rate, s-1 | Time, μs | Rate, s-1 | Time, μs | |
| HP36 (60.2°C) | 6.20 × 10⁵ | 1.61 | 3.10 × 10⁵ | 3.23 | 3.10 × 10⁵ | 3.23 |
| HP36 F47L, F51L (49.9°C) | 6.64 × 10⁵ | 1.51 | 3.32 × 10⁵ | 3.01 | 3.32 × 10⁵ | 3.01 |
| HP36 (49.9°C) | 4.43 × 10⁵ | 2.26 | 3.00 × 10⁵ | 3.34 | 1.43 × 10⁵ | 6.97 |
U, unfolded state; F, folded state.
Conclusions
The equilibrium FTIR spectra of both HP36 and the double Phe mutant HP36 F47L, F51L show an Amide I′ band centered at 1,645 cm–1 at low temperature consistent with an α-helical protein. A comparison of the unfolding transitions of these proteins indicates that the double mutant is significantly destabilized with respect to the WT protein, consistent with earlier studies. The observed relaxation kinetics for both proteins after a T-jump measured at 1,632 and 1,650 cm–1 consists of two relaxation phases. The fast phase (≈100 ns) likely corresponds to the helix–coil transition with a possible contribution from changes in solvation of the helices. The slower (few microseconds) phase is due to the overall folding/unfolding of the protein. The biphasic relaxation kinetics are in agreement with previous experimental measurements (1), whereas the overall folding time agrees with previous theoretical studies (6). The amplitude of the slow phase relative to the fast phase is significantly less for the double Phe mutant than for the WT. The difference in relative amplitude may be due to the presence of unfolded protein throughout the entire temperature range studied for the double mutant. Alternatively, the difference in amplitude might indicate that the extent of core formation (association of the helices) is less for the double mutant compared with the WT protein. HP36 and HP36 F47L, F51L were found to have similar folding rates at their respective melt temperatures and at the melt temperature of the HP36 F47L, F51L, even though the double mutations destabilized the protein. The similar folding times show that destabilizing the protein by altering the hydrophobic core does not significantly affect the folding times. The double Phe → Leu mutant also reduced the residual unfolded state structure present in the WT. Thus, the results also demonstrate that the folding time for the villin headpiece subdomain is not critically dependent on the residual structure in the unfolded state that is present in HP36 but diminished in HP36 F47L, F51L. If the residual structure in the unfolded state were purely native-like, most folding models such as the diffusion collision model would predict that abolishing these interactions slows the folding rate. In contrast, if these interactions were purely nonnative in character, their loss would lower the folding barrier and thus increase the folding rate. Because we did not observe any significant effect on the folding rate of diminishing the unfolded state interactions, it is likely that a balance of native and nonnative interactions are present in the unfolded state of the WT protein.
Acknowledgments
This work was funded by National Institutes of Health Grants GM 53640 (to R.B.D.) and GM 54233 (to D.P.R.) and a Los Alamos National Laboratory Director's Postdoctoral Fellowship (to S.H.B.).
Author contributions: S.H.B., S.F., D.P.R., and R.B.D. designed research; S.H.B., D.M.V., Y.T., and Y.L. performed research; S.H.B., D.M.V., Y.T., Y.L., S.F., D.P.R., and R.B.D. analyzed data; and S.H.B., S.F., D.P.R., and R.B.D. wrote the paper.
Conflict of interest statement: No conflicts declared.
This paper was submitted directly (Track II) to the PNAS office.
Abbreviations: FTIR, Fourier transform IR; HP36, helical subdomain of the villin headpiece; HP36 F47L, F51L, HP36 with F47 and F51 replaced with Leu; kf, folding rate; ku, unfolding rate; Rh, radius of hydration; T-jump, temperature jump; Tf, final temperature after T-jump; Tm, midpoint of thermal unfolding transition.
References
- 1.Kubelka, J., Eaton, W. A. & Hofrichter, J. (2003) J. Mol. Biol. 329, 625–630. [DOI] [PubMed] [Google Scholar]
- 2.Wang, M. H., Tang, Y. F., Sato, S. S., Vugmeyster, L., McKnight, C. J. & Raleigh, D. P. (2003) J. Am. Chem. Soc. 125, 6032–6033. [DOI] [PubMed] [Google Scholar]
- 3.Buscaglia, M., Kubelka, J., Eaton, W. A. & Hofrichter, J. (2005) J. Mol. Biol. 347, 657–664. [DOI] [PubMed] [Google Scholar]
- 4.Duan, Y. & Kollman, P. A. (1998) Science 282, 740–744. [DOI] [PubMed] [Google Scholar]
- 5.Duan, Y., Wang, L. & Kollman, P. A. (1998) Proc. Natl. Acad. Sci. USA 95, 9897–9902. [DOI] [PMC free article] [PubMed] [Google Scholar]
- 6.Zagrovic, B., Snow, C. D., Shirts, M. R. & Pande, V. S. (2002) J. Mol. Biol. 323, 927–937. [DOI] [PubMed] [Google Scholar]
- 7.Jang, S. M., Kim, E., Shin, S. & Pak, Y. (2003) J. Am. Chem. Soc. 125, 14841–14846. [DOI] [PubMed] [Google Scholar]
- 8.Shen, M. Y. & Freed, K. F. (2002) Proteins Struct. Funct. Genet. 49, 439–445.12402354 [Google Scholar]
- 9.Sullivan, D. C. & Kuntz, I. D. (2002) J. Phys. Chem. B 106, 3255–3262. [Google Scholar]
- 10.Fernandez, A., Shen, M. Y., Colubri, A., Sosnick, T. R., Berry, R. S. & Freed, K. F. (2003) Biochemistry 42, 664–671. [DOI] [PubMed] [Google Scholar]
- 11.Islam, S. A., Karplus, M. & Weaver, D. L. (2002) J. Mol. Biol. 318, 199–215. [DOI] [PubMed] [Google Scholar]
- 12.Sullivan, D. C. & Kuntz, I. D. (2001) Proteins 42, 495–511.11170204 [Google Scholar]
- 13.Srinivas, G. & Bagchi, B. (2003) Theor. Chem. Acc. 109, 8–21. [Google Scholar]
- 14.van der Spoel, D. & Lindahl, E. (2003) J. Phys. Chem. B 107, 11178–11187. [Google Scholar]
- 15.Ripoll, D. R., Vila, J. A. & Scheraga, H. A. (2004) J. Mol. Biol. 339, 915–925. [DOI] [PubMed] [Google Scholar]
- 16.Herges, T., Schug, A. & Wenzel, W. (2004) Int. J. Quant. Chem. 99, 854–863. [Google Scholar]
- 17.Kinnear, B. S., Jarrold, M. F. & Hansmann, U. H. E. (2004) J. Mol. Graphics Modell. 22, 397–403. [DOI] [PubMed] [Google Scholar]
- 18.De Mori, G. M. S., Colombo, G. & Micheletti, C. (2005) Proteins Struct. Funct. Bioinform. 58, 459–471. [DOI] [PubMed] [Google Scholar]
- 19.Myers, J. K. & Oas, T. G. (2001) Nat. Struct. Biol. 8, 552–558. [DOI] [PubMed] [Google Scholar]
- 20.Karplus, M. & Weaver, D. L. (1994) Protein Sci. 3, 650–668. [DOI] [PMC free article] [PubMed] [Google Scholar]
- 21.Tang, Y. F., Rigotti, D. J., Fairman, R. & Raleigh, D. P. (2004) Biochemistry 43, 3264–3272. [DOI] [PubMed] [Google Scholar]
- 22.Frank, B. S., Vardar, D., Buckley, D. A. & McKnight, C. J. (2002) Protein Sci. 11, 680–687. [DOI] [PMC free article] [PubMed] [Google Scholar]
- 23.Werner, J. H., Dyer, R. B., Fesinmeyer, R. M. & Andersen, N. H. (2002) J. Phys. Chem. B 106, 487–494. [Google Scholar]
- 24.Williams, S., Causgrove, T. P., Gilmanshin, R., Fang, K. S., Callender, R. H., Woodruff, W. H. & Dyer, R. B. (1996) Biochemistry 35, 691–697. [DOI] [PubMed] [Google Scholar]
- 25.Thompson, P. A., Munoz, V., Jas, G. S., Henry, E. R., Eaton, W. A. & Hofrichter, J. (2000) J. Phys. Chem. B 104, 378–389. [Google Scholar]
- 26.Lednev, I. K., Karnoup, A. S., Sparrow, M. C. & Asher, S. A. (2001) J. Am. Chem. Soc. 123, 2388–2392. [DOI] [PubMed] [Google Scholar]
- 27.Munoz, V., Thompson, P. A., Hofrichter, J. & Eaton, W. A. (1997) Nature 390, 196–199. [DOI] [PubMed] [Google Scholar]
- 28.Maness, S. J., Franzen, S., Gibbs, A. C., Causgrove, T. P. & Dyer, R. B. (2003) Biophys. J. 84, 3874–3882. [DOI] [PMC free article] [PubMed] [Google Scholar]
- 29.Li, Y., Picart, F. & Raleigh, D. P. (2005) J. Mol. Biol. 349, 839–846. [DOI] [PubMed] [Google Scholar]
- 30.Wilkins, D. K., Grimshaw, S. B., Receveur, V., Dobson, C. M., Jones, J. A. & Smith, L. J. (1999) Biochemistry 38, 16424–16431. [DOI] [PubMed] [Google Scholar]
- 31.Chiu, T. K., Kubelka, J., Herbst-Irmer, R., Eaton, W. A., Hofrichter, J. & Davies, D. R. (2005) Proc. Natl. Acad. Sci. USA 102, 7517–7522. [DOI] [PMC free article] [PubMed] [Google Scholar]
- 32.Vardar, D., Buckley, D. A., Frank, B. S. & McKnight, C. J. (1999) J. Mol. Biol. 294, 1299–1310. [DOI] [PubMed] [Google Scholar]
- 33.McKnight, C. J., Matsudaira, P. T. & Kim, P. S. (1997) Nat. Struct. Biol. 4, 180–184. [DOI] [PubMed] [Google Scholar]
- 34.Manas, E. S., Getahun, Z., Wright, W. W., DeGrado, W. F. & Vanderkooi, J. M. (2000) J. Am. Chem. Soc. 122, 9883–9890. [Google Scholar]
- 35.Vu, D. M., Myers, J. K., Oas, T. G. & Dyer, R. B. (2004) Biochemistry 43, 3582–3589. [DOI] [PubMed] [Google Scholar]