Abstract
We report the structural characterization of a thiolate-ligated ferryl radical. Using x-ray absorption spectroscopy, we examined chloroperoxidase (CPO) compound I (CPO-I). Our results indicate that CPO-I is an authentic ferryl species with an Fe–O bond of 1.65 Å. Axial-ligand interactions result in a remarkably long 2.48-Å Fe–S bond. Analogous forms of cytochrome P450 and CPO have been shown to possess virtually identical coordination environments. Thus, it seems likely that our findings provide a good structural description of the elusive P450-I.
Keywords: cytochrome P450, EXAFS
Cytochrome P450s are hydroxylating thiolate-ligated heme proteins that play critical roles in the production of hormones and the metabolism of xenobiotics. The human enzyme CYP2B6, for example, has been implicated in the metabolism of bupropion (for the treatment of depression and attention-deficit/hyperactivity disorder), ifosfamide (for the treatment of cervical cancer), tamoxifen (for the treatment of breast cancer), selegiline (for the treatment of Parkinson's disease), and nicotine (1–3).
The generally accepted mechanism for P450 hydroxylations involves a poorly characterized iron(IV)oxo (ferryl) radical intermediate called compound I. This species is highly reactive. As a result, its characterization has been limited to that afforded by rapid-scan stopped-flow spectrophotometry. Ishimura and coworkers (4) and Sligar and coworkers (5) reported the formation of P450-I in reactions of ferric P450 with meta-chloroperoxybenzoic acid. In both cases the putative intermediates were prepared in low yield and their representative spectra were obtained by singular value decomposition. Spectral assignments for these intermediates were based on comparisons with the visible absorption spectrum of chloroperoxidase (CPO) compound I (CPO-I) (6).
CPO is a valuable model system for cytochrome P450. CPO catalyzes P450-like hydroxylations (7), and its various forms show spectroscopic signatures that are similar to their P450 counterparts (8, 9). The hydroxylating species in CPO is a thiolate-ligated ferryl radical, CPO-I. Similar to P450-I, this species is reactive. CPO-I has a half-life of ≈1 s at room temperature (10). Unlike P450-I, however, CPO-I can be prepared in high yield by using rapid freeze-quench techniques. To date, CPO-I has been characterized by Mössbauer (11), resonance Raman (10), electron paramagnetic resonance (11), and visible absorption (6) spectroscopies.
Theory suggests that thiolate-ligated ferryl radicals possess unusual electronic and geometric structures. Density functional calculations predict that the donating thiolate ligand is oxidized during compound I formation (12–14). This result (which deviates from the standard porphyrin-radical cation model) provides a satisfactory explanation for the unique electronic coupling observed in CPO-I (12). Density functional calculations also indicate that strong interactions between the thiolate and oxo ligands result in unusually long Fe–S bonds (2.44–2.69 Å) (12–14). The accuracy of these theoretical predictions and the role that these features play in the oxygen-transfer chemistry of thiolate-heme enzymes remains to be determined.
To gain insight into the workings of these reactive species, we performed x-ray absorption measurements on CPO-I. Here we present an unambiguous structural characterization of a thiolate-ligated ferryl radical (15, ‡). As such, our results provide a look at the reactive intermediate of P450 chemistry.
Materials and Methods
CPO was obtained from Caldariomyces fumago and purified according to known procedures (16). CPO-I samples were prepared by reacting 4 mM ferric CPO with 80 mM peracetic acid in a 2:1 mixture that was quenched in liquid ethane 10 ms after mixing. Both reagents were in 100 mM potassium phosphate buffer (pH 6.5). Electron paramagnetic resonance measurements revealed that all samples contained greater than ≈90% CPO-I. X-ray absorption measurements were performed at the Stanford Synchrotron Radiation Laboratory on beam line 10-2 at T ≈ 10 K. The data were collected by using a Si(220) φ = 90° double-crystal monochromator detuned 50% at 8,300 eV for harmonic rejection. Data sets were collected with a 30-element Ge detector (Canberra, Meriden, CT). All x-ray absorption spectroscopy experiments were performed in fluorescence mode. X-ray absorption spectroscopy data were analyzed with the curve-fitting program exafspak using ab initio phases and amplitudes that were generated with the program feff 8.x39 (17). To minimize the effects of photoreduction, the sample was moved in the beam so that a fresh spot was examined during each set of measurements. CPO-I data were obtained by averaging the first scan at each spot (16 scans total). Exposure time per scan was ≈30 min. Both raw and Fourier-filtered data sets were fit over the region k = 3–15 Å–1. Fits included first and second shell atoms and one multiple-scattering component. In all cases, the second shell was comprised of α- and meso-carbons and the Fe–Cα–N–Fe multiple-scattering paths (n = 8, 4, and 16, respectively). The Debye–Waller factors, σ2, of Fe–Cα–N–Fe multiple-scattering paths and the α-carbons were constrained to be in a ratio of 1.25 but were otherwise allowed to vary freely. All other Debye–Waller factors were treated as free parameters. The scale factor, S0, was set to 0.8.
Results and Discussion
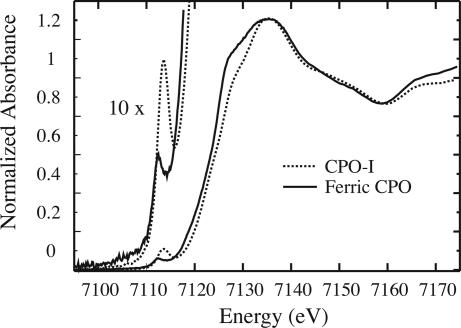
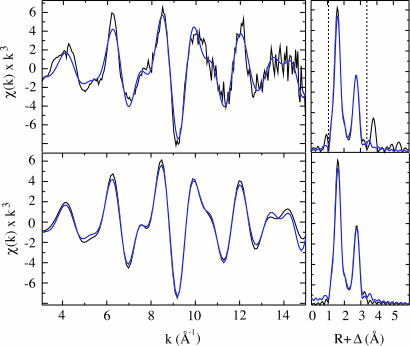
Fig. 1 shows the Fe-K x-ray absorption edges of CPO-I and ferric CPO. The absorption edge of CPO-I lies ≈1 eV higher in energy than the ferric edge, reflecting the increased binding energy of the 1s electrons in the Fe(IV) intermediate. CPO-I also exhibits a 1s → 3d pre-edge transition that is typical of ferryl species (18, 19). Table 1 lists the metal–ligand bond distances obtained by fitting the extended x-ray absorption fine structure (EXAFS) region of the CPO-I spectrum. The best fits to the raw and Fourier-filtered EXAFS data are shown in Fig. 2.
Fig. 1.
Fe-K x-ray absorption edges for ferric CPO and CPO-I.
Table 1. EXAFS fitting results for chloroperoxidase compound I.
| Fe—N
|
Fe—S
|
Fe—O
|
|||||||||
|---|---|---|---|---|---|---|---|---|---|---|---|
| N | R | σ2 | N | R | σ2 | N | R | σ2 | Eo | Error | |
| Raw | 4 | 2.000 (3) | 0.0016 (1) | 1 | 2.473 (9) | 0.0061 (9) | 1 | 1.653 (6) | 0.0039 (6) | -13.4 (12) | 0.337 |
| 4 | 1.996 (3) | 0.0016 (2) | 0 | 1 | 1.650 (6) | 0.0041 (7) | -14.8 (11) | 0.369 | |||
| 4 | 1.992 (3) | 0.0015 (2) | 1 | 2.467 (9) | 0.0054 (9) | 0 | -17.2 (10) | 0.390 | |||
| 4 | 1.990 (3) | 0.0015 (2) | 0 | 0 | -17.8 (10) | 0.416 | |||||
| Filtered | 4 | 2.007 (2) | 0.0017 (1) | 1 | 2.478 (5) | 0.0069 (6) | 1 | 1.654 (3) | 0.0031 (3) | -11.4 (6) | 0.133 |
| 4 | 2.002 (3) | 0.0017 (1) | 0 | 1 | 1.651 (4) | 0.0033 (4) | -13.0 (8) | 0.203 | |||
| 4 | 1.992 (3) | 0.0016 (2) | 1 | 2.470 (10) | 0.0060 (11) | 0 | -17.3 (12) | 0.291 | |||
| 4 | 1.991 (4) | 0.0016 (2) | 0 | 0 | -17.8 (11) | 0.324 | |||||
Raw and Fourier-filtered data were fit over the region k = 3-15 Å-1. Coordination number N, interatomic distance R (Å), mean-square deviation in R (the Debye-Waller factor), σ2 (Å2), and the threshold energy shift E0 (eV). The values in parentheses are estimated SDs obtained from the diagonal elements of the covariance matrix. Empirically, EXAFS uncertainties are ± 0.02 Å for R and ±20% for N and σ2. The fit error is defined as [Σk6(χexptl – χcalc)2/Σk6χ2exptl]1/2. Best fits are shown in boldface. Alternative fits with different coordination numbers are shown also. Coordination numbers, N, were constrained during fits.
Fig. 2.
EXAFS spectra and Fourier transforms of raw (Upper) and Fourier-filtered (Lower) data. Black lines show experimental data, and blue lines show the best fits. Dashed lines show the region used for Fourier filtering. The fits shown were obtained over the region k = 3–15 Å–1.
Our measurements indicate an Fe–O bond of 1.65 Å in CPO-I. This distance, which is typical of Fe(IV)O species, is in excellent agreement with the value (rFeO = 1.654 Å) obtained from a Badger's rule analysis of the CPO-I ferryl stretching frequency (νFeO = 790 cm–1) (20). The strength of the interaction between the oxo ligand and the axial-thiolate is reflected in the 2.48-Å Fe–S bond. This distance is unusually long for an iron–alkanethiolate bond. A search of the Cambridge Structural Database for compounds with Fe(N/O)5S1 coordination (excluding bridging sulfurs) found an average Fe–S bond of 2.34 Å (21), and a search of iron–thiolate bonds relevant to proteins yielded an Fe–S bond range of 2.21–2.40 Å and an average distance of 2.27 Å (22). The longest heme–thiolate bond reported (from EXAFS and small-molecule crystallographic studies) is 2.40 Å (23).
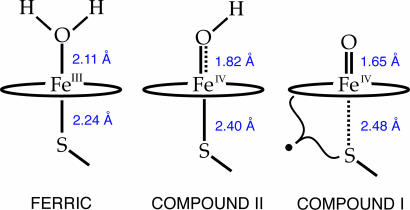
Fig. 3 shows the EXAFS-determined axial-ligand bond lengths for the ferric, compound II, and compound I forms of a thiolate-ligated heme (23). These complexes have formal iron oxidation states of III, IV, and V, respectively. Throughout this series the iron–oxygen bond displays typical coordination chemistry, shortening from 2.11 to 1.65 Å with increasing oxidation, whereas the iron–sulfur bond shows the opposite behavior, lengthening from 2.24 Å in the ferric complex to 2.48 Å in compound I. The change in iron–sulfur bond distance is driven by increasing interactions (H2O < OH– < O2–) between the donating thiolate and the distal oxygen ligand, because the number of FeO π * orbitals increases from zero to two across the series. Similar trends in the trans influence of terminal oxo and hydroxo ligands have been observed in Fe(III) and Mn(III) Tris[(N′-tert-butylureaylato)-N-ethyl]aminato (Borovik's ligand) complexes (24). The metal–nitrogen bond trans to the oxygen ligand in these compounds lengthens by ≈0.1 Å after going from the hydroxo to oxo complex.
Fig. 3.
Fe–S and Fe–O bond distances. The bond distances shown were obtained from EXAFS measurements on CPO.
Oxidation of the thiolate also may contribute to the length of the Fe–S bond. Theoretical methods predict that the proximal ligand acquires radical character during compound I formation. CPO-I is a doublet at 10 K (>99%) (11). Gas-phase calculations on the doublet ground state of a thiolate-ligated compound I yield a sulfur spin density of σS = 0.82 (12), whereas the application of mixed quantum-mechanics/molecular-mechanics (QM/MM) methods has resulted in sulfur spin densities ranging from σS = 0.24 to σS = 0.39 (13, 14, 25, §). The QM/MM calculations predict Fe–S bonds ranging from 2.44 to 2.63 Å, whereas the gas-phase calculations provide an Fe–S bond of 2.69 Å. Given that errors in theoretically determined Fe–S bonds can be >0.1 Å,¶ the range of bond lengths obtained from QM/MM methods is in reasonable agreement with our measured value. The uncertainties in calculated Fe–S bond distances and sulfur spin densities make it difficult to draw meaningful conclusions about the magnitude of sulfur oxidation from a comparison of experimental and calculated bond lengths.
Summary
EXAFS measurements indicate that CPO-I is an authentic ferryl species with an Fe–O bond of 1.65 Å. Axial interactions between the thiolate and oxo ligands result in 2.48 Å Fe–S bond. The strong trans influence exhibited in CPO-I results in part from the donating nature of the thiolate ligand. The donating ability of the axial thiolate has been suggested to play important roles in the oxygen activation and hydrogen abstraction chemistry of P450s (9, 23). Analogous forms of P450 and CPO have been shown to possess virtually identical coordination environments (23, 27). Thus, it seems likely that our findings provide the best structural description to date of the elusive P450-I. The electronic structure of the thiolate-ligated ferryl radical remains to be determined.
Acknowledgments
We thank Matthew Latimer, Allyson Aranda, Jeff Maske, Bill Butler, Serena Debeer-George, and other Stanford Synchrotron Radiation Laboratory (SSRL) staff members for assistance with x-ray absorption spectroscopy measurements and Carsten Krebs and Lee Hoffart for examining the quality of some preliminary CPO-I samples by Mössbauer spectroscopy. This work was supported by the National Science Foundation, the Petroleum Research Fund, and the Arnold and Mabel Beckman Foundation. SSRL operations are funded by the Department of Energy, Office of Basic Energy Sciences. The SSRL Structural Molecular Biology Program is supported by the National Institutes of Health, National Center for Research Resources, Biomedical Technology Program, and the National Institute of General Medical Sciences.
Author contributions: K.L.S., R.K.B., and M.T.G. performed research; K.L.S. and M.T.G. analyzed data; K.L.S. and M.T.G. wrote the paper; and M.T.G. designed research.
Conflict of interest statement: No conflicts declared.
This paper was submitted directly (Track II) to the PNAS office.
Abbreviations: CPO, chloroperoxidase; CPO-I, chloroperoxidase compound I; EXAFS, extended x-ray absorption fine structure; QM/MM, quantum mechanics/molecular mechanics.
Footnotes
In an elegant crystallographic study, Schlichting et al. (15) used cryogenic reduction and annealing techniques to examine the catalytic pathway of P450. The yield of P450-I during this process was insufficient to allow for an accurate determination of metal–ligand bond lengths.
QM/MM calculations on the quartet state of a thiolate-ligated compound I have yielded mixed results. One study obtained σS = 0.07 and rFe-S = 2.44 Å (26). This study (which did not examine the doublet state) found less sulfur spin density and a shorter Fe–S bond than the other QM/MM investigations listed (13, 14, 25), which obtained sulfur spin densities ranging from σS = 0.19 to σS = 0.37 and Fe–S bonds ranging from 2.50 to 2.60 Å for the quartet state.
Crystal structures of FeII(TTP)(SEt)(CO) and FeII(TPP)(SEt) reveal Fe–S bonds of 2.352 and 2.360 Å, whereas calculations (B3LYP/6–311G) yield Fe–S bonds of 2.502 and 2.452 Å, respectively. Errors in the other calculated metal–ligand bond lengths are ≤0.03 Å (R.K.B. and M.T.G., unpublished results).
References
- 1.Ekins, S. & Wrighton, S. A. (1999) Drug Metab. Rev. 31, 719–754. [DOI] [PubMed] [Google Scholar]
- 2.Hidestrand, M., Oscarson, M., Salonen, J. S., Nyman, L., Pelkonen, O., Turpeinen, M. & Ingelman-Sundberg, M. (2001) Drug Metab. Dispos. 29, 1480–1484. [PubMed] [Google Scholar]
- 3.Tredger, J. M. & Stoll, S. (2002) Hosp. Pharm. 9, 167–173. [Google Scholar]
- 4.Egawa, T., Shimada, H. & Ishimura, Y. (1994) Biochem. Biophys. Res. Commun. 201, 1464–1469. [DOI] [PubMed] [Google Scholar]
- 5.Kellner, D. G., Hung, S.-C., Weiss, K. E. & Sligar, S. G. (2002) J. Biol. Chem. 277, 9641–9644. [DOI] [PubMed] [Google Scholar]
- 6.Palcic, M. M., Rutter, R., Araiso, T., Hager, L. P. & Dunford, H. B. (1980) Biochem. Biophys. Res. Commun. 94, 1123–1127. [DOI] [PubMed] [Google Scholar]
- 7.van Rantwijk, F. & Sheldon, R. A. (2000) Curr. Opin. Biotech. 11, 554–564. [DOI] [PubMed] [Google Scholar]
- 8.Hollenberg, P. F. & Hager, L. P. (1973) J. Biol. Chem. 248, 2630–2633. [PubMed] [Google Scholar]
- 9.Dawson, J. H. (1988) Science 240, 433–439. [DOI] [PubMed] [Google Scholar]
- 10.Egawa, T., Proshlyakov, D. A., Miki, H., Makino, R., Ogura, T., Kitagawa, T. & Ishimura, Y. (2001) J. Biol. Inorg. Chem. 6, 46–54. [DOI] [PubMed] [Google Scholar]
- 11.Rutter, R., Hager, L. P., Dhonau, H., Hendrich, M., Valentine, M. & Debrunner, P. (1984) Biochemistry 23, 6809–6816. [DOI] [PubMed] [Google Scholar]
- 12.Green, M. T. (1999) J. Am. Chem. Soc. 121, 7939–7940. [Google Scholar]
- 13.Schöneboom, J. C., Lin, H., Reuter, N., Theil, W., Cohen, S., Ogliaro, F. & Shaik, S. (2002) J. Am. Chem. Soc. 124, 8142–8151. [DOI] [PubMed] [Google Scholar]
- 14.Bathelt, C. M., Zurek, J., Mulholland, A. J. & Harvey, J. N. (2005) J. Am. Chem. Soc. 127, 12900–12908. [DOI] [PubMed] [Google Scholar]
- 15.Schlichting, I., Berendzen, J., Chu, K., Stock, A. M., Maves, S. A., Benson, D. E., Sweet, R. M., Ringe, D., Petsko, G. A. & Sligar, S. G. (2000) Science 287, 1615–6122. [DOI] [PubMed] [Google Scholar]
- 16.Hashimoto, A. & Pickard, M. A. (1984) J. Gen. Microbiol. 130, 2051–2058. [Google Scholar]
- 17.Ankudinov, A. L., Ravel, B., Rehr, J. J. & Conradson, S. D. (1998) Phys. Rev. B 58, 7565–7576. [Google Scholar]
- 18.Penner-Hahn, J. E. & Hodgson, K. O. (1989) in Iron Porphyrins, eds. Lever, A. B. P. & Gray, H. B. (VCH, New York), Vol. III, pp. 237–304. [Google Scholar]
- 19.Rohde, J.-E., Torelli, S., Shan, X., Lim, M. H., Klinker, E. J., Kaizer, J., Chen, K., Nam, W. & Que, L. (2004) J. Am. Chem. Soc. 126, 16750–16761. [DOI] [PubMed] [Google Scholar]
- 20.Green, M. T. (2005) J. Am. Chem. Soc., in press.
- 21.Clay, M. D., Jenney, F. E., Hagedoorn, P. L., George, G. N., Adams, M. W. W. & Johnson, M. K. (2001) J. Am. Chem. Soc. 124, 788–805. [DOI] [PubMed] [Google Scholar]
- 22.Harding, M. M. (1999) Acta Crystallogr. D. 55, 1432–1443. [DOI] [PubMed] [Google Scholar]
- 23.Green, M. T., Dawson, J. H. & Gray, H. B. (2004) Science 304, 1653–1656. [DOI] [PubMed] [Google Scholar]
- 24.MacBeth, C. E., Gupta, R., Mitchell-Koch, K. R., Young, V. G., Lushington, G. H., Thompson, W. H., Hendrich, M. P. & Borovik, A. S. (2004) J. Am. Chem. Soc. 126, 2556–2567. [DOI] [PubMed] [Google Scholar]
- 25.Schöneboom, J. C., Cohen, S., Lin, H., Shaik, S. & Thiel, W. (2004) J. Am. Chem. Soc. 126, 4017–4034. [DOI] [PubMed] [Google Scholar]
- 26.Guallar, V., Baik, M.-H., Lippard, S. J. & Friesner, R. A. (2003) Proc. Natl. Acad. Sci. USA 100, 6998–7002. [DOI] [PMC free article] [PubMed] [Google Scholar]
- 27.Dawson, J. H., Kau, L.-S., Penner-Hahn, J. E., Sono, M., Eble, K. S., Bruce, G. S., Hager, L. P. & Hodgson, K. O. (1986) J. Am. Chem. Soc. 108, 8114–8116. [Google Scholar]


