Abstract
Activation of inflammatory pathways may contribute to the beginning and the progression of both atherosclerosis and type 2 diabetes. Here we report a novel interaction between insulin action and control of inflammation, resulting in glucose intolerance and vascular inflammation and amenable to therapeutic modulation. In insulin receptor heterozygous (Insr+/–) mice, we identified the deficiency of tissue inhibitor of metalloproteinase 3 (Timp3, an inhibitor of both TNF-α–converting enzyme [TACE] and MMPs) as a common bond between glucose intolerance and vascular inflammation. Among Insr+/– mice, those that develop diabetes have reduced Timp3 and increased TACE activity. Unchecked TACE activity causes an increase in levels of soluble TNF-α, which subsequently promotes diabetes and vascular inflammation. Double heterozygous Insr+/–Timp3+/– mice develop mild hyperglycemia and hyperinsulinemia at 3 months and overt glucose intolerance and hyperinsulinemia at 6 months. A therapeutic role for Timp3/TACE modulation is supported by the observation that pharmacological inhibition of TACE led to marked reduction of hyperglycemia and vascular inflammation in Insr+/– diabetic mice, as well as by the observation of increased insulin sensitivity in Tace+/– mice compared with WT mice. Our results suggest that an interplay between reduced insulin action and unchecked TACE activity promotes diabetes and vascular inflammation.
Introduction
Insulin resistance has been hypothesized to act as a common pathogenic defect for type 2 diabetes and coronary artery disease, although the molecular mechanisms explaining its effects are still unclear (1–3). Insulin resistance can bring about the development of the inflammatory state, leading to atherosclerosis by altering lipid metabolism and adiposity (4). Conversely, activation of the innate immune system may be linked to insulin resistance, as observed in epidemiological studies reporting subclinical inflammation in insulin-resistant states (5, 6). Another, yet unexplored, possibility is that interaction between 2 or more genes can simultaneously induce insulin resistance and inflammatory state in both insulin target tissues (muscle, fat, liver) and in vasculature.
Heterozygosity for a null insulin receptor (Insr+/–) allele is associated with a variable pattern of insulin resistance in mice (7–9). The variability of the metabolic phenotypes due to the Insr mutation results partly from environmental factors and partly from genetic modifiers that have been primarily mapped (8–11). Insr+/– mice have been helpful in the study of different aspects of type 2 diabetes pathogenesis. In fact, interaction of Insr haploinsufficiency with insulin receptor substrate 1 (Irs1) ablation or loss of Foxo1 function recapitulates the role of pancreatic β cell, skeletal muscle, and liver function in controlling glucose homeostasis (9–11). However, the interaction between these genes has not hitherto offered insights into the links between diabetes and atherosclerosis.
Here, we show that Insr+/– mice that are diabetic have a defect in tissue inhibitor of metalloproteinase 3 (Timp3) expression. Timp3 is unique compared with the other members of the TIMP family in its ability to block activation of both TNF-α convertase and classical metalloproteinases such as MMP-2 and MMP-9 (12, 13). We show in vivo that reduced Timp3 expression results in uncontrolled TNF-α–converting enzyme (TACE) protease activity, therefore increasing the levels of circulating soluble TNF-α. The unchecked inflammatory state caused by Timp3 deficiency interacts with Insr haploinsufficiency, leading to glucose intolerance as well as vascular inflammation.
Furthermore, our study points out that diabetes and atherosclerosis could be determined by common pathways, which are amenable to therapeutic modulation.
Results
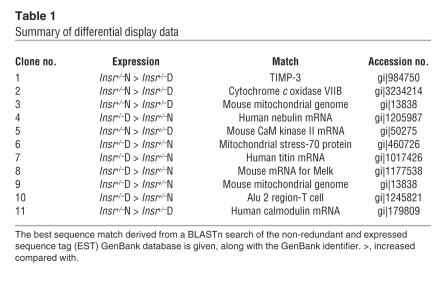
To complement a previous study showing a genetic basis for diabetes in Insr+/– mice (8), we used the same type of mice to perform a differential display on mRNA extracted from skeletal muscle. We identified 11 gene products differentially expressed in Insr+/– diabetic compared with Insr+/– normoglycemic mice (Table 1). In Insr+/– diabetic mice, we found a marked decrease in the expression of Timp3, an endogenous and selective inhibitor of MMPs and sheddases such as ADAM-17/TACE (12, 13). Although we were unable to identify a primary defect in the Timp3 gene that might explain its reduced expression, we reasoned that its deficiency may contribute to impairing glucose homeostasis in Insr+/– mice, given Timp3’s pivotal role in controlling activation of the innate immune system (14).
Table 1.
Summary of differential display data
Identification of Timp3 as a common element for glucose intolerance and vascular inflammation.
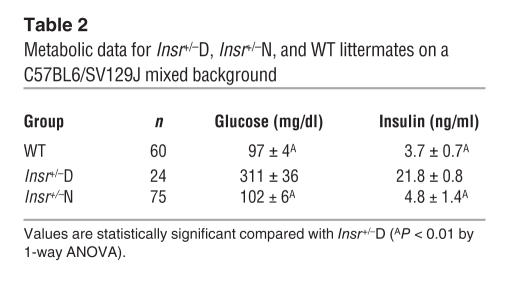
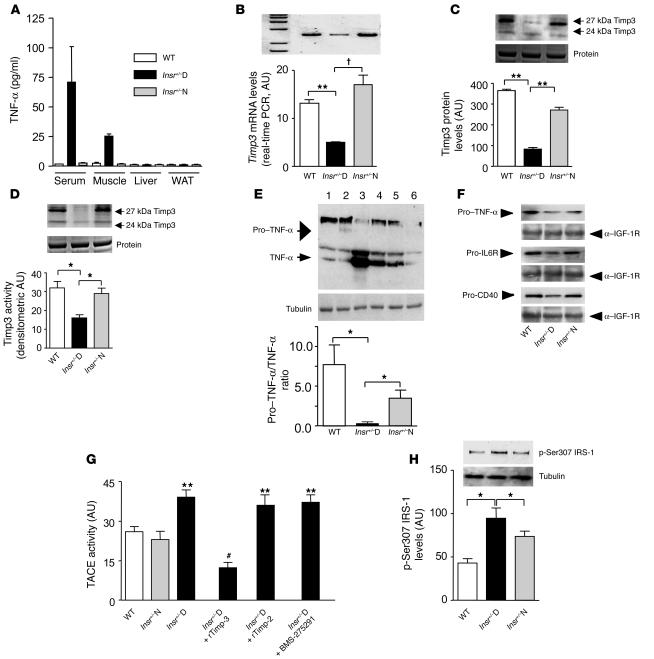
To establish the role of Timp3 in diabetes, we used male Insr+/– and their male WT littermates on a mixed C57BL6/SV129J background. Thus, we divided Insr+/– mice into normoglycemic (Insr+/–N) and diabetic (Insr+/–D, markedly hyperglycemic and hyperinsulinemic) groups (Table 2). Since Timp3 deficiency may result in increased levels of circulating and tissue soluble TNF-α, we analyzed TNF-α levels in serum and relevant tissues for insulin action. Results showed that TNF-α is detectable only in serum and skeletal muscle of Insr+/–D mice and not in WT and Insr+/–N mice (Figure 1A).
Table 2.
Metabolic data for Insr+/–D, Insr+/–N, and WT littermates on a C57BL6/SV129J mixed background
Figure 1.
Timp3 expression and activity in skeletal muscle of Insr+/–mice. (A) Quantification of TNF-α in Insr+/–D, Insr+/–N, and WT littermates. (B) Real-time RT-PCR analysis of Timp3 mRNA expression in Insr+/–D, Insr+/–N, and WT mice. **P < 0.01; †P < 0.001 by 1-way ANOVA. (C) Western blot analysis of Timp3 protein expression in Insr+/–D, Insr+/–N, and WT mice (equal loading was confirmed by silver staining). **P < 0.01 by 1-way ANOVA. (D) Comparison of Timp3 activity, measured by reverse zymography in Insr+/–D, Insr+/–N, and WT mice (equal loading was confirmed by silver staining). *P < 0.05 by 1-way ANOVA. (E) Pro–TNF-α to TNF-α conversion in Insr+/–D (lanes 3 and 4), Insr+/–N (lanes 5 and 6), and WT (lanes 1 and 2) mice. *P < 0.05 by 1-way ANOVA. (F) Shedding of ProTNF-α, pro–IL-6R, and pro-CD40 in Insr+/–D, Insr+/–N, and WT mice. Gel loading was normalized by anti–IGF-1R. (G) TACE activity measured by a fluorimetric assay in Insr+/–D, Insr+/–N, and WT mice in the presence or absence of recombinant Timp3 (rTimp-3) (100 mM), recombinant Timp2 (rTimp-2) (100 mM), and specific MMP inhibitor BMS-275291 (1 μM). **P < 0.01 versus WT; #P < 0.01 versus Insr+/–D by 1-way ANOVA. (H) IRS-1 phosphorylation on Ser307 in Insr+/–D, Insr+/–N, and WT. *P < 0.05 by 1-way ANOVA. Data from 3 separate experiments are summarized in the bar graphs and expressed as mean ± SD.
We then sought to confirm whether a defect in Timp3 expression and activity in the skeletal muscle of these mice is associated with diabetes. Quantitative real-time PCR, Western blot, and reverse zymography assays confirmed a significant reduction in Timp3 mRNA (65% and 75%), protein (78% and 70%), and activity (50% and 45%) in skeletal muscle of Insr+/–D mice compared with WT and Insr+/–N littermates, respectively (Figure 1, B–D). Reduction of Timp3 expression and activity also correlated with a significant decrease in the pro–TNF-α form and significant increase in soluble TNF-α in skeletal muscle homogenates from Insr+/–D mice (Figure 1E). We hypothesized that decreased proTNF-α in Insr+/–D mice was due to increased TACE activity. To verify specificity of TACE shedding, we measured levels of proTNF-α, pro–IL-6R, and pro-CD40 in isolated muscle membranes (15, 16). All membrane-bound TACE substrates were decreased in Insr+/–D mice (Figure 1F). Similarly, TACE activity measured by a fluorimetric assay was increased in total skeletal muscle homogenates from Insr+/–D mice (Figure 1G). Addition to muscle extracts of recombinant Timp3 reduced this enzymatic activity, while recombinant Timp2, which is unable to block TACE, did not yield the same result (Figure 1G). Likewise, adding the MMP-specific inhibitor BMS-275291 did not modify the increased enzymatic activity in muscle from Insr+/–D mice (Figure 1G). This specific response to Timp3 compared with Timp2 and BMS-275291 is suggestive of TACE activity (14, 17). Next, we hypothesized that increased availability of TNF-α could impair insulin action by interfering with IRS-1 activation. TNF-α signaling activates JNK-1, which phosphorylates IRS-1 on Ser307. This serine phosphorylation reduces the ability of IRS-1 to be tyrosine phosphorylated by the Insr, a step required for insulin metabolic action such as glucose transport (18). We found that IRS-1 phosphorylation on Ser307 was increased in skeletal muscle from randomly fed Insr+/–D mice (Figure 1H).
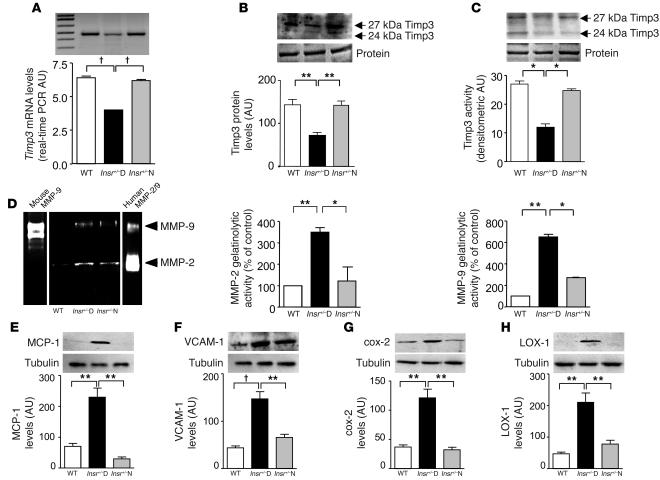
We then investigated the presence of vascular inflammation associated with diabetes. Similar to what we found in muscle, Timp3 was reduced in aortas from Insr+/–D mice at the level of mRNA (50%), protein (50%), and activity (50%) (Figure 2, A–C) compared with both Insr+/–N and WT mice. To verify the presence of vascular inflammation, we analyzed levels of MMP-2 and MMP-9. We found increases in gelatinolytic activity in bands corresponding to pro–MMP-9 and pro–MMP-2 in tissue from Insr+/–D aortas compared with WT and Insr+/–N aortas (Figure 2D). Since TIMPs would have no inhibitory effect in the gel, as they separate from the MMPs during electrophoresis, the increase in gelatinase activity was probably due to an increase in MMP expression consequent to the excess of TNF-α.
Figure 2.
Decreased Timp3 activity and increased inflammation in aortas of Insr+/–D mice. (A) Real-time RT-PCR analysis of Timp3 mRNA expression in Insr+/–D, Insr+/–N, and WT mice. †P < 0.001 by 1-way ANOVA. (B) Western blot analysis of Timp3 protein expression in Insr+/–D, Insr+/–N, and WT mice (equal loading was confirmed by silver staining). **P < 0.01 by 1-way ANOVA. (C) Comparison of Timp3 activity, measured by reverse zymography in Insr+/–D, Insr+/–N, and WT mice (equal loading was confirmed by silver staining). *P < 0.05 by 1-way ANOVA. (D) MMP measured by zymography in Insr+/–D, Insr+/–N, and WT mice. Mouse MMP-9 and human MMP-2/9 were used as standards. **P < 0.01, *P < 0.05 by 1-way ANOVA. Analysis by Western blotting of inflammatory markers, MCP-1 (E), VCAM-1 (F), cox-2 (G), LOX-1 (H), and tubulin as control in Insr+/–D, Insr+/–N, and WT mice. **P < 0.01, †P < 0.001 by 1-way ANOVA. Data from 3 separate experiments are summarized in the bar graphs and expressed as mean ± SD.
Next, we analyzed markers of vascular inflammation and atherosclerosis such as monocyte chemotactic protein 1 (MCP-1) (19) and VCAM-1 (20). By Western blotting, Insr+/–D animals displayed a 3.2-fold and 3.4-fold increase in vascular expression of MCP-1 and VCAM-1, respectively (Figure 2, E and F) compared with Insr+/–N and WT mice. We next studied vascular levels of cyclooxygenase-2 (cox-2) and ox-LDL receptor–1 (LOX-1), because these molecules are associated with proinflammatory mechanisms and oxidant stress in atherosclerosis (21, 22). Levels of cox-2 and LOX-1 antigens in aortas were enhanced 3.3-fold and 4.4-fold, respectively in Insr+/–D mice (Figure 2, G and H).
Interaction between Insr haploinsufficiency and reduced Timp3 expression in the muscle as a cause of hyperglycemia.
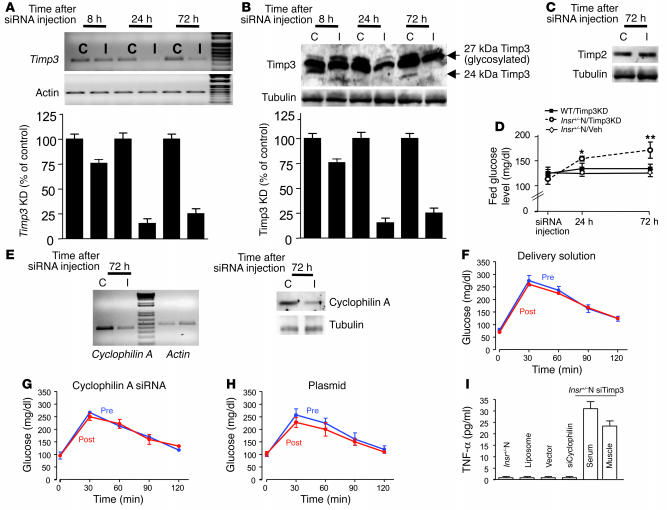
We hypothesized that the reduction in Timp3 expression in adult mice carrying the Insr mutation but normoglycemic, as the Insr+/–N, should result in an increase in soluble TNF-α and consequently an impairment in insulin sensitivity, similar to what was observed in Insr+/–D mice. To knock down Timp3 levels in the skeletal muscle of Insr+/–N adult mice, we used small interfering RNA (siRNA). We tested in 3T3L1 cells 5 different siRNAs for their ability to knock down Timp3, obtaining an 80% decrease in Timp3 expression with insert 3 (data not shown). We used this construct for in vivo Timp3 knockdown (KD). We found that reduction in Timp3 mRNA and protein was significant 24 hours after injection and stable until 72 hours (Figure 3, A and B). To confirm the specificity of the Timp3 siRNA, we assessed Timp2 protein levels that were unaffected by Timp3 siRNA (Figure 3C). Once the time course for Timp3 KD was established, we injected WT mice (WT/Timp3KD), Insr+/–N mice (Insr+/–N/Timp3KD), and Veh-Insr+/– mice (injected with plasmid only) in all 4 legs. In parallel to the observed changes in Timp3 expression, blood glucose levels rose significantly 24 hours after the injection and remained higher until 72 hours in Insr+/–N/Timp3KD but not in WT/Timp3KD and Veh-Insr+/– mice (Figure 3D). To verify that the increase in glucose levels was consequent to Timp3 KD, we performed glucose tolerance tests in Insr+/–N mice before and after the injection of either an in vivo functional siRNA specific for cyclophilin A, a gene unrelated to Timp3 (Figure 3E), the delivery solution, or the empty pRNA-U6.1/neo vector. In all cases, injection had no effect on glucose tolerance (Figure 3, F–H). Interestingly, in Insr+/– mice TNF-α levels were found to be increased only by Timp3 KD in skeletal muscle and unaffected by injections of unrelated siRNA, delivery solution, or vector (Figure 3I).
Figure 3.
Effect of Timp3 KD in skeletal muscle. siRNA-mediated inhibition of Timp3 mRNA (A) and protein (B) expression in mice injected with insert 3 containing vector at 8 hours, 24 hours, and 72 hours after injection. I, muscle injected with insert; C, contralateral muscle injected only with vehicle. Data from 3 separate experiments are summarized in the bar graphs and expressed as mean ± SD. (C) Effect of Timp3 KD on Timp2 protein levels. (D) Fed glucose levels in Insr+/–N/Timp3KD mice (open circles), WT/Timp3KD (filled squares), and Insr+/–N mice injected with vehicle (Insr+/–N/Veh; open diamonds). Data are expressed as mean ± SD (n = 6 per group). *P < 0.05, **P < 0.01. (E) Effect of cyclophilin A siRNA on cyclophilin A mRNA and protein level in Insr+/–N mice. (F–H) Intraperitoneal glucose tolerance tests before (Pre) and after (Post) injection of cyclophilin A (G), delivery solution (F), or empty plasmid (H) (n = 3 per group). (I) TNF-α levels in Insr+/–N mice injected with siRNA reagents and in Insr+/–N/cyclophilin A KD and Insr+/–N/Timp3KD mice. Data are expressed as mean ± SD (n = 3–6 per group).
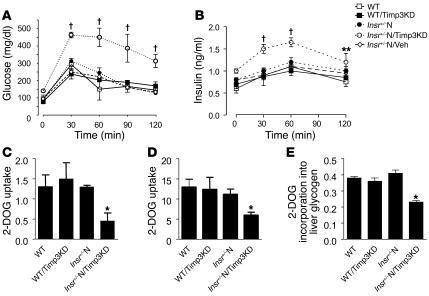
Glucose tolerance tests demonstrated that Insr+/–N/Timp3KD mice were significantly hyperglycemic and hyperinsulinemic compared with WT, Insr+/–N, WT/Timp3KD, and Insr+/–N/Veh mice (Figure 4, A and B). To verify that Insr+/–N/Timp3KD are insulin resistant in the skeletal muscle, the primary site of Insr/Timp3 interaction, and in the liver and white adipose tissue (WAT), we used glucose tolerance tests incorporating the tracer [3H]2-deoxyglucose (23). By this assay, we determined glucose uptake at 120 minutes after glucose loading in muscle and WATs as well as glucose incorporation into glycogen in liver. Glucose uptake was markedly impaired in muscle from Insr+/–N/Timp3KD compared with WT, WT/Timp3KD, and Insr+/–N mice. Notably, glucose uptake in WAT and glucose incorporation in liver glycogen were mild but significantly reduced in Insr+/–N/Timp3KD mice (Figure 4, C–E), confirming our hypothesis.
Figure 4.
Effect of Timp3 KD on glucose metabolism. Glucose (A) and insulin (B) levels during an intraperitoneal glucose tolerance test in WT mice (open squares), WT/Timp3KD (filled squares), Insr+/–N (filled circles), Insr+/–N/Timp3KD mice (open circles), and Insr+/–N/Veh (open diamonds) mice (n = 6 per group). Data are expressed as mean ± SD. **P < 0.01, †P < 0.001 by 2-way ANOVA for Insr+/–N/Timp3KD compared with other groups. 2-DOG uptake into triceps (C) and perigonadal WAT (D) during a glucose tolerance test. (E) Glucose uptake into liver, as estimated by 2-DOG incorporation into glycogen (n = 6 per group). Data in C–E represent moles/milligram protein per minute and are expressed as mean ± SD. *P < 0.05 compared with WT by 1-way ANOVA for Insr+/–N/Timp3KD compared with other groups.
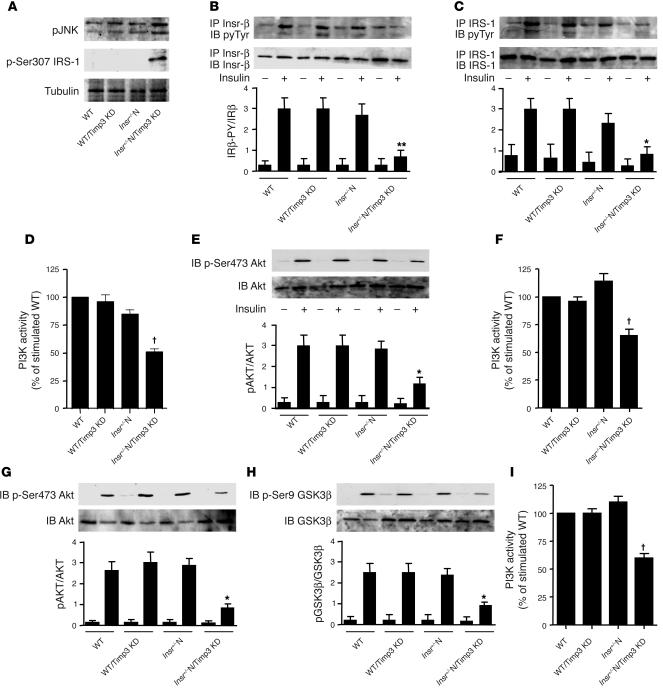
To gain insights into the molecular mechanism by which Timp3 reduction alters glucose homeostasis, we performed signaling studies in tissues relevant for insulin action and glucose metabolism. In skeletal muscle, Timp3 KD resulted in increased phosphorylation of JNK-1/2 and of IRS-1 at Ser307, both signs of increased TNF-α activity, only in Insr+/–N/Timp3KD compared to WT, WT/Timp3KD, Insr+/–N and WT mice (Figure 5A). Upon insulin injection, Insr β subunit and IRS-1 tyrosine phosphorylation, phosphotyrosine-associated PI3K activity and Akt phosphorylation on Ser473 were significantly decreased in Insr+/–N/Timp3KD compared with WT, WT/Timp3KD and Insr+/–N mice (Figure 5, B–E). Next, we analyzed insulin action in liver and WAT of mice upon insulin challenge. In liver we found decreased phosphotyrosine-associated PI3K activity and Akt phosphorylation on Ser473 in Insr+/–N/Timp3KD (Figure 5, F and G). Impairment of the metabolic branch of insulin signaling in Insr+/–N/Timp3KD resulted in decreased phosphorylation of glycogen synthase kinase 3β on Ser9 (Figure 5H), accounting for the observed reduction in glucose incorporation into glycogen. In WAT from Insr+/–N/Timp3KD mice, we observed reduced phosphotyrosine-associated PI3K activity (Figure 5I).
Figure 5.
Effect of Timp3 KD on insulin signaling in WT and Insr+/– mice. (A) TNF-α signaling in skeletal muscle measured by phosphorylation state of JNK-1/2 and of Ser307 in IRS1. After an overnight fast, 6-month-old WT, WT/Timp3KD, Insr+/– and Insr+/–/Timp3KD mice were injected with either saline (–) or 25 mU/kg of insulin (Ins). Skeletal muscle (B–E), livers (F–H), and WAT (I) were collected 5–10 minutes later. Protein extracts were prepared, immunoprecipitated with antibodies against Insr (B) and IRS-1 (C), and after gel separation were immunoblotted with antibodies specific for phosphotyrosine (pyTyr) (PY20) and normalized by reblotting with specific antibodies. PI3K activity (D, F, and I) was measured in phosphotyrosine immunoprecipitates by ELISA assay. The levels of total AKT1/2 and activated AKT (p-Ser473) (E and G), total glycogen synthase kinase 3β (GSK3β) and inactivated GSK3β (p-Ser9) (H) were determined by immunoblotting of the original lysates. Band intensities were quantified by densitometry and expressed as mean ± SD (n = 3 mice per group). *P < 0.05, **P < 0.01, †P < 0.001 by 1-way ANOVA for Insr+/–N/Timp3KD compared with other groups.
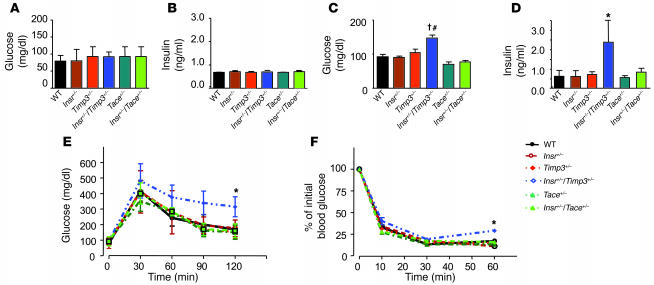
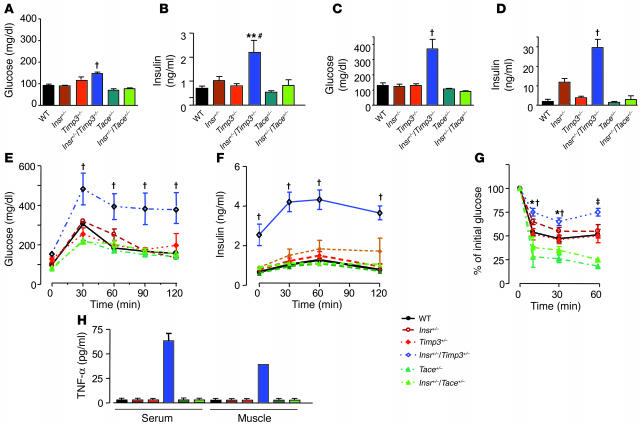
These results suggested that Timp3 plays a role in altering glucose homeostasis in vivo when interacting with defects in insulin action such as those due to Insr haploinsufficiency. Whether the Timp3/TACE dyad plays a role in regulation of glucose homeostasis is at present unclear. In fact, unrestrained TACE activity has been hypothesized to increase TNF-α expression in obesity (24). However, adipose tissue–restricted TNF-α action alone is insufficient to cause insulin resistance (25). To directly address these issues, we investigated glucose homeostasis in mice obtained from breeding Insr+/– with Timp3+/– and Tace+/– mice, all on a C57BL/129SV mixed background (14, 26). At 3 months Insr+/–Timp3+/– mice were hyperinsulinemic and hyperglycemic in the fed state compared with Insr+/–Tace+/–, Insr+/–, Timp3+/–, Tace+/–, and WT littermates (Figure 6, A–D). Intraperitoneal glucose and insulin tolerance tests showed a mild defect in glucose tolerance at 3 months in Insr+/–Timp3+/– mice compared with the other genotypes (Figure 6, E and F). At 6–8 months old, in both the fasted and the fed state, Insr+/–Timp3+/– mice were significantly hyperglycemic and hyperinsulinemic compared with the other genotypes (Figure 7, A–D). Intraperitoneal glucose tolerance tests corroborated that Insr+/–Timp3+/– mice were significantly hyperglycemic and hyperinsulinemic (Figure 7, E and F). Intraperitoneal insulin tolerance tests confirmed that Insr+/–Timp3+/– mice were insulin resistant compared with the other genotypes (Figure 7G). Moreover, we observed that Tace haploinsufficiency is associated with mildly increased insulin sensitivity compared with WT mice (Figure 7, E–G). TNF-α levels increased in both serum and skeletal muscle of Insr+/–Timp3+/– mice compared with the other genotypes (Figure 7H).
Figure 6.
Glucose homeostasis in Insr+/–Timp3+/–, Insr+/–Tace+/–, Insr+/–, Timp3+/–, Tace+/–, and WT littermates at 3 months. Fasted glucose (A), fasted insulin (B), fed glucose (C), and fed insulin (D) levels in mice (n = 8–10 per group). Data are expressed as mean ± SD. †P < 0.001 for Insr+/–Timp3+/– versus Timp3+/–, Tace+/–, and WT mice by 1-way ANOVA; #P < 0.01 for Insr+/–Timp3+/– versus Insr+/– and Insr+/–Tace+/– mice; *P < 0.05 for Insr+/–Timp3+/– versus all the other genotypes by 1-way ANOVA. (E) Glucose levels after intraperitoneal glucose load. Data are expressed as mean ± SD (n = 5 per group). *P < 0.05 for Insr+/–Timp3+/– versus other genotypes by 2-way ANOVA. (F) Insulin tolerance test (0.75 U kg–1). Data are expressed as mean ± SD (n = 5 per group). *P < 0.05 for Insr+/–/Timp3+/– versus other genotypes by 2-way ANOVA.
Figure 7.
Glucose homeostasis in Insr+/–Timp3+/–, Insr+/–Tace+/–, Insr+/–, Timp3+/–, Tace+/–, and WT littermates at 6 months. Fasted glucose (A), fasted insulin (B), fed glucose (C), and fed insulin (D) levels (n = 8–10 per group). Data are expressed mean ± SD. †P < 0.001 for Insr+/–/Timp3+/– versus other genotypes by 1-way ANOVA; **P < 0.01 for Insr+/–Timp3+/– versus Timp3+/–, Tace+/–, and WT; #P < 0.05, Insr+/–Timp3+/– versus Insr+/– and Insr+/–Tace+/– by 1-way ANOVA. Glucose (E) and insulin (F) levels during an intraperitoneal glucose tolerance test. Data are expressed as mean ± SD (n = 5 per group). †P < 0.001, Insr+/–Timp3+/– versus other genotypes by 2-way ANOVA. (G) Insulin tolerance test (0.75 U kg–1). Data are expressed as mean ± SD (n = 5 per group). †P < 0.001, Insr+/–Timp3+/– versus Timp3+/–, Tace+/–, and WT; *P < 0.05, Insr+/–/Timp3+/– versus Insr+/– and Insr+/–Tace+/– by 2-way ANOVA at 10 and 30 minutes; and ‡P < 0.001, Insr+/–Timp3+/– versus Insr+/–Tace+/–, Insr+/–, Timp3+/–, Tace+/–, and WT by 2-way ANOVA at 60 minutes. (H) Quantification of TNF-α in Insr+/–Timp3+/–, Insr+/–Tace+/–, Insr+/–, Timp3+/–, Tace+/–, and WT littermates.
Reconstitution of Timp3 activity by inhibition of TACE/MMP-2/9 activity improves diabetes and vascular inflammation in Insr+/–D mice.
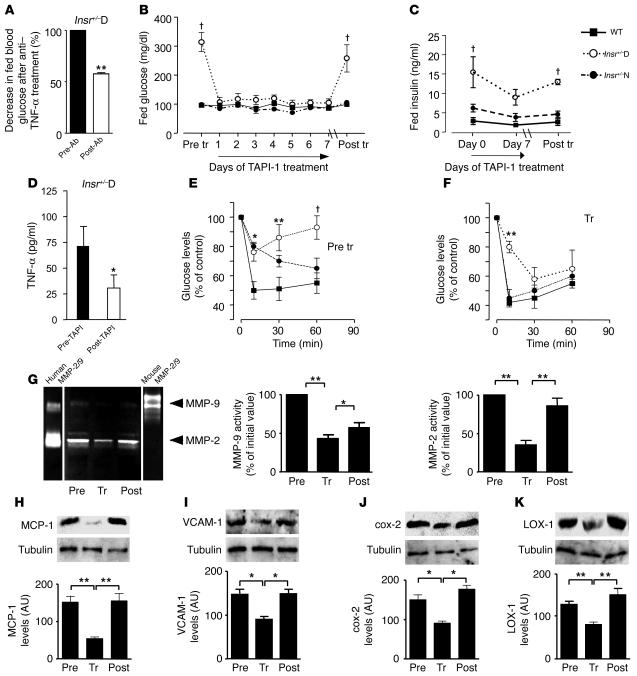
Because we observed increased conversion of proTNF-α to TNF-α in the skeletal muscle of Insr+/–D mice, we hypothesized that circulating TNF-α levels could be affected as a consequence of reduced inhibition of TACE by Timp3 both in skeletal muscle and vasculature. Serum TNF-α levels were increased in Insr+/–D mice compared with WT and Insr+/–N mice (Figure 1A). Thus, we treated Insr+/–D mice (Figure 8A) with single injections of anti–TNF-α neutralizing antibody, observing a significant reduction in fed glucose levels 24 hours after treatment. Since circulating TNF-α reflects the degree of TACE activity, we considered, as an alternative approach, inhibiting the function of TACE in vivo. We treated WT, Insr+/–N, and Insr+/–D mice with TNF-α protease inhibitor 1 (TAPI-1), a synthetic TACE/MMP inhibitor that is known to modulate proTNF-α to TNF-α conversion and also to inhibit MMP-2 and MMP-9, thus mimicking both the 2 main Timp3 activities (12, 13, 26). We observed that treatment with TAPI-1 reduced fed glucose levels to normal values within 24 hours of the first injection in Insr+/–D mice (Figure 8B). Treatment was continued with daily administration for 1 week. Twenty-four hours after withdrawal of the drug, fed blood glucose levels began to rise (data not shown). Two weeks after discontinuing TAPI-1, blood glucose levels in Insr+/–D mice were comparable to pretreatment levels (Figure 8B). Similarly, fed insulinemia decreased in Insr+/–D mice during TAPI-1 treatment, returning to pretreatment levels within 2 weeks of discontinuing TAPI-1 (Figure 8C). Interestingly, fed insulin levels were modestly reduced after TAPI-1 in Insr+/–N mice (Figure 8C).
Figure 8.
Glucose homeostasis in Insr+/–D mice is improved by inhibition of Tace/MMP activity. (A) Fed glucose levels were measured before (Pre-Ab) and 24 hours after (Post-Ab) anti–TNF-α antibody injection in Insr+/–D (n = 6). **P < 0.01 by 1-way ANOVA. (B) Fed glucose levels were measured before and on day 7 of TAPI-1 treatment and 14 days after discontinuing TAPI-1 in Insr+/–D, Insr+/–N, and WT mice at 6 months of age (n = 12 per group). †P < 0.001 by 1-way ANOVA. (C) Fed insulin levels before, on day 7 of TAPI-1 treatment, and day 14 after discontinuing TAPI-1 in Insr+/–D, Insr+/–N, and WT mice at 6 months of age (n = 12 per group). †P < 0.001 by 1-way ANOVA. (D) TNF-α levels before and after TAPI-1 treatment (7 days) in Insr+/–D mice. *P < 0.05. (E and F) Insulin tolerance test (0.75 U kg–1) in Insr+/–D (open circles), Insr+/–N (filled circles), and WT (filled squares) mice at 6 months of age (n = 6 per group) before and at the end of TAPI-1 treatment. *P < 0.05, **P < 0.01, †P < 0.001 by 2-way ANOVA. (G) MMP-9 and MMP-2 measured by zymography (n = 3 per group). Mouse MMP-9 and human MMP-2/9 were used as standards. MCP-1 (H), VCAM-1 (I), cox-2 (J), and LOX-1 (K) by Western blotting. Gel loading was normalized by tubulin. Data from 3 separate experiments are summarized in the bar graphs and expressed as mean ± SD. *P < 0.05, **P < 0.01 by 1-way ANOVA.
To prove that positive effects of TACE inhibition are paralleled by reduction in circulating TNF-α in Insr+/–D mice, we measured TNF-α levels before and after 1 week of treatment in WT and Insr+/–D mice. Interestingly, TAPI-1 reduced TNF-α levels (Figure 8D). By contrast, TAPI-1 treatment did not affect angiotensin II levels in Insr+/–D, Insr+/–N, and WT mice (data not shown). Thus, TAPI-1 treatment reduced fed glucose, insulin, and TNF-α levels in Insr+/–D mice to levels observed in WT mice. This may reflect an increase in peripheral tissue insulin sensitivity secondary to TAPI-1–dependent reduction of TACE activity. To address this possibility, we performed insulin tolerance tests before and after TAPI-1 treatment. These tests confirmed decreased insulin sensitivity in Insr+/–D mice (Figure 8E). Administration of TAPI-1 for 1 week caused a significant recovery of insulin sensitivity in Insr+/–D mice (Figure 8F). Interestingly, we found a positive effect of TAPI-1 treatment on insulin sensitivity in Insr+/–N mice (Figure 8F). We speculated that a reduction in Timp3 activity and the consequent systemic increase of TNF-α levels could explain the increase in MMPs in vascular cells observed in Insr+/–D mice. TNF-α plays a role in atherosclerosis, enhancing the local prothrombotic and proinflammatory states, which sustain plaque growth and instability. Enhanced expression of MMPs has been linked to multiple mechanisms germane to the progression of atherosclerosis lesions, such as SMC migration and lesion instability (27). Therefore, we measured MMP-2 and MMP-9 in Insr+/–D mice before and at the end of 1 week of TAPI-1 administration and 2 weeks after discontinuing TAPI-1. Both pro–MMP-2 and pro–MMP-9 were found to be decreased by TAPI-1, with a tendency to revert to initial levels after TAPI-1 withdrawal (Figure 8G). To elucidate whether blockage of TACE/MMP activity by TAPI-1 administration is associated with decreased expression of proinflammatory mediators in Insr+/–D vasculature, we assessed indices of vascular inflammation. By Western blotting, a 2.8-fold decrease in MCP-1 antigen was observed in TAPI-1–treated Insr+/–D mice compared with pretreatment levels (Figure 8H). Two weeks after discontinuing TAPI-1, levels of MCP-1 increased to pretreatment levels (Figure 8H). In Insr+/–D mice treated with TAPI-1, levels of VCAM-1 were reduced by 40% and increased to pretreatment levels after TAPI-1 was discontinued (Figure 8I). Inhibition of TACE by TAPI-1 decreased levels of cox-2 and LOX-1 antigens in the aortas of Insr+/–D mice by 40% and 238%, respectively (Figure 8, J and K).
Discussion
Epidemiological studies suggested that a tight control of risk factors may reduce chronic inflammation, so as to help the prevention of cardiovascular events in patients affected by type 2 diabetes and lower the risk for type 2 diabetes in patients affected by cardiovascular disease (28–30). Although clinical trials with angiotensin-converting enzyme inhibitors and salicylates suggest that the reduction of inflammation can help to maintain glucose homeostasis (29, 30), the molecular mechanisms explaining how control of inflammation influences both type 2 diabetes and atherosclerosis are only partially known.
Here, we describe a novel concept in diabetes/atherosclerosis pathogenesis: interaction between defective insulin action and loss of control of TACE, a protease that regulates soluble TNF-α levels, may synergize to induce concurrently hyperglycemia and vascular inflammation. Increased activation of TACE is a consequence of the reduced expression of its inhibitor Timp3. We demonstrated through in vivo assays that genetic interaction between systemic Insr haploinsufficiency and Timp3 deficiency in the skeletal muscle impairs glucose uptake, a sign of insulin resistance. The phenotype of mice carrying a reduced Timp3 expression in muscle and vasculature combined with systemic Insr haploinsufficiency resembles that of muscle-specific, insulin-resistant knockout–50% (MIRKO-50%) mice, in which only the combination of a specific muscle Insr deletion along with another mild defect (a systemic Insr haploinsufficiency) causes hyperglycemia and hyperinsulinemia in aged animals (31). It was also suggested that a defect in adipose tissue and liver is necessary to cause overt diabetes (32). Remarkably, glucose uptake is impaired in liver and WAT of Insr+/–N/Timp3KD mice. Therefore, it is possible that as a consequence of the interaction between the Insr haploinsufficiency and Timp3 deficiency, glucose shunted from muscle is not adequately metabolized in fat and liver. A similar mechanism has been suggested for muscle-specific GLUT4-null mice (32). Therefore, our model supports the hypothesis that to determine diabetes, a strong defect in one of the peripheral target tissues, as the one induced by interaction of Insr+/– and Timp3 in the muscle, should be flanked by mild defects in the other organs, such as those caused by Insr haploinsufficiency alone. Studies with mice with a systemic chronic haploinsufficiency of both Insr and Timp3 reveal that young animals manifest mild defects in insulin sensitivity and glucose tolerance, while adult heterozygous mice develop marked hyperglycemia and hyperinsulinemia. A similar phenotype was observed in double heterozygous Insr+/–Irs1+/– mice (9).
Using Insr+/– diabetic mice, in which there is evidence of unchecked TACE activation, we tested the hypothesis that recovery of Timp3 activity could be a valid approach to concurrently reducing diabetes and vascular inflammation. In fact, the blockage of TACE as well as MMP-2 and MMP-9 by a synthetic inhibitor markedly improves hyperglycemia, hyperinsulinemia, and markers of inflammation such as VCAM-1, LOX-1, MCP-1, and cox-2.
Since type 2 diabetes and atherosclerosis are multifactorial diseases and many patients develop macrovascular disease before frank hyperglycemia occurs, it is plausible that common pathways play a role in the development of both the diseases (3–5). We suggest that Timp3, which is a powerful regulator of inflammation (14, 33), can also curtail failure in glucose metabolism sustained by genetic or secondary insulin resistance. Since Timp3 is also an inhibitor of VEGF activity (34), Insr+/–Timp3+/– mice could be a useful model for studying the connection between insulin sensitivity, inflammation, and vascular complications of diabetes.
Anti–TNF-α treatment in human diseases such as diabetes/obesity and heart failure is biologically relevant, but the few attempts using monoclonal antibodies for chronic TNF-α neutralization have been ineffective (35–38). Our study suggests that TNF-α neutralization might also be obtained through use of appropriate TACE inhibitors.
In conclusion, we provide a direct mechanistic relationship among insulin action, control of inflammation, and the pathophysiology of atherosclerosis and diabetes. In the Insr+/–D mice, through recovery of Timp3 activity, it is possible to inhibit TACE and to break the synergistic effect of TNF-α and Insr haploinsufficiency on insulin sensitivity. Based on our findings, we propose that the TIMP3/TACE system is involved in the pathogenesis of atherosclerosis and type 2 diabetes in human subjects and as such may be exploited for therapeutic purposes.
Methods
Animal husbandry, genotyping, and analytical procedures.
Insr+/– mice used for the differential display were previously described (8). Insr+/– mice on a C57BL/129SV mixed background were obtained from Columbia University; generation and genotyping of these mice has been described in previous publications (7–9). Timp3+/– and Tace+/– mice on a C57BL/129SV mixed background were previously described (14, 26). Bleeding and metabolic testing procedures have been previously described (7–9). TNF-α levels were measured using a commercial ELISA kit (BD Biosciences — Pharmingen) in accordance with the manufacturer’s instructions (14). Animal studies were approved by the University of Rome “Tor Vergata” Animal Care and Use Committee.
mRNA display.
To identify differentially expressed genes, we used the Hieroglyph differential display kit (Genomyx Corp.) according to the manufacturer’s instructions.
DNA sequencing.
Following reamplification, PCR products were purified on NICK Columns (Amersham Biosciences) and subjected to sequence analysis using [33P]-labeled di-deoxynucleotide terminators in PCR sequencing with Thermo Sequenase DNA Polymerase (Amersham Biosciences). Each PCR product was analyzed in 4 independent reactions. The products of the sequencing reactions were analyzed on denaturing 9M urea/6% polyacrylamide gels and detected by autoradiography.
Extraction of Timp3 for Western blots and reverse zymography.
For the extraction of matrix-bound Timp3, tissues were treated as described by Woessner and coworkers (39). Briefly, hind limb skeletal muscles and aortas were removed, washed 3 times with cold 50 mM Tris, pH 7.5, 0.03% sodium azide, snap frozen, pulverized, and homogenized in 500 μl of the same buffer containing 0.1% Triton X-100 for 6 minutes at 4°C. The mixture was centrifuged at 13,500 g for 20 minutes. The pellet was washed 2 times and resuspended in the same volume of cold 50 mM Tris, pH 7.5, 0.03% sodium azide, 50 μM Z-Phe-chloromethyl ketone, 50 μM aminoethyl-benzenesulfonyl fluoride. Extractants (a mixture of chondroitin sulfates A, B, and C; Sigma-Aldrich) were added to a final concentration of 0.2 mg/ml. Extraction at 4°C for 30 minutes was followed by centrifugation at 17,000 g for 10 minutes.
Analysis of TACE substrates shedding in total muscle homogenates and purified skeletal muscle membranes.
TACE activity was measured by adding 10 μM of Abz-LAQAVRSSSR-Dpa to equal amounts (100 μg) of hind limb skeletal muscle lysates resuspended in TACE buffer for 1 hour (50 mM Tris-Cl, pH 7.4, 25 mM NaCl, and 4% glycerol, room temperature). Fluorescence was monitored at λex 320 nm and λem 420 nm over a period of 10 minutes (40). We purchased recombinant Timp3 and TIMP1 from Oncogene Science and R&D Systems, respectively. BMS-275291 was a gift of John Bird (Celltech Group, Cambridge, United Kingdom). Shedding of TACE substrates was measured on skeletal muscle membranes using specific antibodies (all from Santa Cruz Biotechnology Inc.) following methods described by Xu et al. (25).
Muscle and aortas lysates for Western blots.
Skeletal muscle lysates were obtained as described previously (9). Fresh aortas were collected separately, pulverized under liquid nitrogen, and extracted with the use of ice-cold lysis buffer (10 mmol/l sodium phosphate, pH 7.2, containing 150 mmol/l NaCl [PBS], and 1% Triton X-100, 0.1% SDS, 0.5% sodium deoxycholate, and 0.2% sodium azide) for 1 hour at 4°C. Insoluble material was removed by centrifugation at 13,800 g at 4°C for 10 minutes. Supernatant (100 μg) was added to Laemmli buffer and heated in boiling water for 4 minutes. Equal amounts from 3 animals for each genotype were subjected to immunoblot analysis.
Western blots.
Total lysates, ECM extracts, or membrane lysates prepared as described above were subjected to SDS-PAGE and immunoblot analysis as described. The following antibodies were used: anti–mouse Timp-3 (Santa Cruz Biotechnology Inc.), anti–MCP-1, anti–VCAM-1, anti–cox-2, anti–LOX-1 (Santa Cruz Biotechnology Inc.), anti–TNF-α antibody (Endogen; Pierce Biotechonology Inc.); anti–phospho-Ser307 IRS-1 (Cell Signaling Technology Inc.). Specific anti-mouse α-tubulin antibody (Sigma-Aldrich) and total protein content (14) were measured as loading control.
SDS-PAGE zymography and reverse zymography.
Aorta lysates, obtained from aortic root of Insr+/–D, Insr+/–N, and WT mice, were subjected to zymography and reverse zymography experiments as described previously (41). Briefly, equal amounts of tissue extract protein (20 μg) were mixed with an equal volume of 2× non-reducing sample buffer. Twenty-microliter aliquots were electrophoresed in the presence of SDS in discontinuous 10% SDS-polyacrylamide gels containing gelatin or casein (NOVEX; Invitrogen Corp.). After running, gels were incubated in NOVEX Zymogram Renaturing Buffer (room temperature for 30 minutes), equilibrated in the NOVEX Zymogram Developing Buffer (room temperature for 30 minutes), and subsequently incubated in the same buffer for 18 hours at 37°C. Then gels were stained with Coomassie blue R-250 (room temperature for 30 minutes), followed by destaining in 5% methanol and 7% acetic acid. In some experiments, to verify the metalloproteinase activity detected by zymography, identical gels were incubated in the above-mentioned buffer containing either 20 mmol/l EDTA, an inhibitor of MMPs, or 1 mmol/l PMSF, an inhibitor of serine proteases. Zymography gels were then stained and destained as described above. To identify gelatinases, we used both purified human MMP-2 and MMP-9 (a generous gift from Dylan Edwards, University of East Anglia, Norwich, United Kingdom) and mouse MMP-9 (Sigma-Aldrich). Reverse zymography was performed to measure TIMP activities as follows: samples were electrophoresed in discontinuous 12% SDS-PAGE gels containing 1 mg/ml gelatin and conditioned medium from baby hamster kidney cells expressing gelatinase A (a generous gift from Dylan Edwards). The gels were washed and incubated for 24 hours at 37°C in regenerating buffer (50 mmol/l Tris-HCl, pH7.5, and 5 mmol/l CaCl2). Under these conditions, TIMPs inhibit gelatin digestion by activated MMPs, producing dark blue bands against a lighter background. Purified human Timp3 (Calbiochem) was used as control. Density of bands was quantified by the NIH IMAGE program, version 1.6 (http://rsb.info.nih.gov/nih-image/).
RNA extraction and real-time quantitative PCR analysis.
Total cellular RNA isolation and real-time PCR experiments were performed as described previously (42). Total RNA was isolated from fresh mouse aortas and hind limb muscles using TRIzol reagents (Invitrogen Corp.). Real-time PCR was carried out on individual samples from adult mice using a Roche LightCycler PCR instrument and LightCycler RT-PCR kit (Roche Diagnostics Corp.). Each reaction was carried out in triplicate using standard reaction conditions. The following primers were employed: Timp3, forward 5′-ACCGACATGCTCTCCAA-3′ and reverse, 5′-CCTCTGACATGCACAC-3′.
Design of siRNAs and intramuscular injection.
We used the target finder and design tool (GenScript Corp.) to identify target siRNAs. Five siRNA sequences (inserts 1–5) were identified and inserted in pRNA-U6.1/neo expression vector. The siRNA sequences were TCCTGCTACTACTTGCCTTGT (insert 1), GCAAGATGTACACAGGACTGT (insert 2), GCCTCAAGCTAGAAGTCAACA (insert 3), CAATTGCAAGATCAAGTCCTG (insert 4), and TGAAGATGTACCGAGGCTTCA (insert 5). Transfection of 3T3L1 cells was performed with siPORT reagents (Ambion Inc.) according to the manufacturer’s instructions. For in vivo delivery, 50 μl of a solution (Mirus Bio Corp.) (43) containing 50 μg of the plasmid encoding timp3 siRNA (Timp3KD) or the plasmid alone (Veh) were injected intramuscularly. timp3 expression was measured by real-time RT-PCR and Western blotting. Glucose levels were measured daily for 72 hours.
In vivo tissue glucose transport during a glucose tolerance test.
2-Deoxy-D-[1, 2-3H]-glucose (Amersham Biosciences) was mixed with 20% dextrose before intraperitoneal injection (2 g/kg body weight; 10 μCi/mouse) into weight-matched 6-month-old male mice (WT, WT/Timp3KD, Insr+/–, Insr+/–N/Timp3KD, and Veh-Insr+/– mice; n = 5 for each group). Blood samples were obtained from tail veins at 0, 15, 30, 45, 60, and 120 minutes and used to determine glucose-specific activity as described previously (23). At 120 minutes, mice were killed and tissues were snap-frozen in liquid nitrogen. To determine tissue accumulation of 2-deoxyglucose-6-phosphate (2-DOG-6-phosphate), 100–500 mg tissue (triceps and perigonadal adipose tissue) was homogenized and processed as described previously (23). To calculate the 2-DOG uptake, the counts (degenerations per minute) were divided by the integrated glucose-specific activity area under the curve and normalized to the sample protein content.
2-DOG incorporation into liver glycogen and liver glycogen measurement during a glucose tolerance test.
Frozen liver (50–75 mg) was pulverized with mortar and pestle in liquid nitrogen and digested. Macromolecules were then allowed to precipitate and used to determine radioactivity incorporation as described previously (23). To determine 2-DOG incorporation into liver glycogen, [3H]radioactivity in glycogen counts (degenerations per minute) was divided by the integrated glucose-specific activity area under the curve and corrected for sample protein content.
Insulin signaling studies.
Insulin signaling studies with phosphotyrosine or phosphospecific antibodies were performed and PI3K activity was assessed as previously described (9–11, 43).
TAPI and anti–TNF- α antibody treatment.
Anti–TNF-α neutralizing antibody (CALTAG Laboratories) was administered by intraperitoneal injections at 10 mg/kg/body weight/d to 6 month-old mice, and glucose levels were measured 24 hours after the injection. TAPI-1 (N-(R)-[2-(hydroxyaminocarbonyl)methyl]-4-methylpentanoyl-L-naphthyl-alanyl-L-alanine,2-aminoethyl amide) (Peptides International Inc.) was administered by intraperitoneal injections at 10 mg/kg/body weight/d to 6-month-old mice for 7 days consecutively. Glucose levels were measured daily during the treatment. Insulin tolerance tests were performed at day 0 and at day 8. Mice were killed at day 0, day 8 of treatment, and 14 days after discontinuing TAPI-1.
Statistics.
Results of the experimental studies are expressed as mean ± SEM or mean ± SD, as indicated. Statistical analysis were performed using the ANOVA or unpaired Student’s t test as indicated. Values of P < 0.05 were considered statistically significant.
Acknowledgments
We thank Amgen Inc. for providing us the Tace+/– mice. BMS-275291 was a gift of John Bird (Celltech). This work was supported by the following grants: Telethon Grant GGP04073 (to M. Federici), Italian “Ministero dell’Università e Ricerca Scientifica e Tecnologica” PRIN 2003067733_006 (to M. Federici), and NIH grants DK57539 (to D. Accili) and CA85410 (to D.C. Lee). We thank the Russ Berrie Foundation for fellowship support to M.L. Hribal and University of Rome “Tor Vergata” for fellowship support to R. Menghini and M.L. Hribal.
Footnotes
Nonstandard abbreviations used: cox-2, cyclooxygenase-2; 2-DOG, 2-deoxyglucose; Insr, insulin receptor; IRS-1, insulin receptor substrate 1; KD, knockdown; LOX-1, ox-LDL receptor–1; MCP-1, monocyte chemotactic protein 1; siRNA, small interfering RNA; TACE, TNF-α–converting enzyme; TAPI-1, TNF-α protease inhibitor 1; TIMP3, tissue inhibitor of metalloproteinase 3; WAT, white adipose tissue.
Conflict of interest: The authors have declared that no conflict of interest exists.
References
- 1.Warram JH, Martin BC, Krolewski AS, Soeldner JS, Kahn CR. Slow glucose removal rate and hyperinsulinemia precede the development of type II diabetes in the offspring of diabetic parents. Ann. Intern. Med. 1990;113:909–915. doi: 10.7326/0003-4819-113-12-909. [DOI] [PubMed] [Google Scholar]
- 2.Rewers M, et al. Insulin sensitivity, insulinemia, and coronary artery disease: the Insulin Resistance Atherosclerosis Study. Diabetes Care. 2004;27:781–787. doi: 10.2337/diacare.27.3.781. [DOI] [PubMed] [Google Scholar]
- 3.Stern MP. Diabetes and cardiovascular disease. The “common soil” hypothesis. Diabetes. 1995;44:369–374. doi: 10.2337/diab.44.4.369. [DOI] [PubMed] [Google Scholar]
- 4.Ginsberg HN. Insulin resistance and cardiovascular disease. J. Clin. Invest. 2000;106:453–458. doi: 10.1172/JCI10762. [DOI] [PMC free article] [PubMed] [Google Scholar]
- 5.Festa A, et al. Chronic subclinical inflammation as part of the insulin resistance syndrome: the Insulin Resistance Atherosclerosis Study (IRAS) Circulation. 2000;102:42–47. doi: 10.1161/01.cir.102.1.42. [DOI] [PubMed] [Google Scholar]
- 6.Hotamisligil GS. Inflammatory pathways and insulin action. Int. J. Obes. Relat. Metab. Disord. 2003;27(Suppl. 3):S53–S55. doi: 10.1038/sj.ijo.0802502. [DOI] [PubMed] [Google Scholar]
- 7.Accili D, et al. Early neonatal death in mice homozygous for a null allele of the insulin receptor gene. Nat. Genet. 1996;12:106–109. doi: 10.1038/ng0196-106. [DOI] [PubMed] [Google Scholar]
- 8.Kido Y, Philippe N, Schaffer AA, Accili D. Genetic modifiers of the insulin resistance phenotype in mice. Diabetes. 2000;49:589–596. doi: 10.2337/diabetes.49.4.589. [DOI] [PubMed] [Google Scholar]
- 9.Bruning JC, et al. Development of a novel polygenic model of NIDDM in mice heterozygous for IR and IRS-1 null alleles. Cell. 1997;88:561–572. doi: 10.1016/s0092-8674(00)81896-6. [DOI] [PubMed] [Google Scholar]
- 10.Nakae J, et al. Regulation of insulin action and pancreatic beta-cell function by mutated alleles of the gene encoding forkhead transcription factor Foxo1. Nat. Genet. 2002;32:245–253. doi: 10.1038/ng890. [DOI] [PubMed] [Google Scholar]
- 11.Kitamura T, et al. The forkhead transcription factor Foxo1 links insulin signaling to Pdx1 regulation of pancreatic β cell growth. J. Clin. Invest. 2002;110:1839–1847. doi:10.1172/JCI200216857. doi: 10.1172/JCI200216857. [DOI] [PMC free article] [PubMed] [Google Scholar]
- 12.Apte SS, Olsen BR, Murphy G. The gene structure of tissue inhibitor of metalloproteinases (TIMP)-3 and its inhibitory activities define the distinct TIMP gene family. J. Biol. Chem. 1995;270:14313–14318. doi: 10.1074/jbc.270.24.14313. [DOI] [PubMed] [Google Scholar]
- 13.Amour A, et al. TNF-alpha converting enzyme (TACE) is inhibited by TIMP-3. FEBS Lett. 1998;435:39–44. doi: 10.1016/s0014-5793(98)01031-x. [DOI] [PubMed] [Google Scholar]
- 14.Mohammed FF, et al. Abnormal TNF activity in Timp3–/– mice leads to chronic hepatic inflammation and failure of liver regeneration. Nat. Genet. 2004;36:969–977. doi: 10.1038/ng1413. [DOI] [PubMed] [Google Scholar]
- 15.Matthews V, et al. Cellular cholesterol depletion triggers shedding of the human interleukin-6 receptor by ADAM10 and ADAM17 (TACE) J. Biol. Chem. 2003;278:38829–38839. doi: 10.1074/jbc.M210584200. [DOI] [PubMed] [Google Scholar]
- 16.Contin C, et al. Membrane-anchored CD40 is processed by the tumor necrosis factor-alpha-converting enzyme. Implications for CD40 signaling. J. Biol. Chem. 2003;278:32801–32809. doi: 10.1074/jbc.M209993200. [DOI] [PubMed] [Google Scholar]
- 17.Lee MH, Rapti M, Murphy G. Delineating the molecular basis of the inactivity of tissue inhibitor of metalloproteinase (TIMP)-2 against TNF-α converting enzyme (TACE) J. Biol. Chem. 2004;279:45121–45129. doi: 10.1074/jbc.M406611200. [DOI] [PubMed] [Google Scholar]
- 18.Aguirre V, et al. Phosphorylation of Ser307 in insulin receptor substrate-1 blocks interactions with the insulin receptor and inhibits insulin action. J. Biol. Chem. 2002;277:1531–1537. doi: 10.1074/jbc.M101521200. [DOI] [PubMed] [Google Scholar]
- 19.Rayner K, Van Eersel S, Groot PH, Reape TJ. Localisation of mRNA for JE/MCP-1 and its receptor CCR2 in atherosclerotic lesions of the ApoE knockout mouse. J. Vasc. Res. 2000;37:93–102. doi: 10.1159/000025720. [DOI] [PubMed] [Google Scholar]
- 20.Cybulsky MI, et al. A major role for VCAM-1, but not ICAM-1, in early atherosclerosis. J. Clin. Invest. 2001;107:1255–1262. doi: 10.1172/JCI11871. [DOI] [PMC free article] [PubMed] [Google Scholar]
- 21.Burleigh ME, et al. Cyclooxygenase-2 promotes early atherosclerotic lesion formation in LDL receptor-deficient mice. Circulation. 2002;105:1816–1823. doi: 10.1161/01.cir.0000014927.74465.7f. [DOI] [PubMed] [Google Scholar]
- 22.Li D, et al. LOX-1 mediates oxidized low-density lipoprotein-induced expression of matrix metalloproteinases in human coronary artery endothelial cells. Circulation. 2003;107:612–617. doi: 10.1161/01.cir.0000047276.52039.fb. [DOI] [PubMed] [Google Scholar]
- 23.Zisman A, et al. Targeted disruption of the glucose transporter 4 selectively in muscle causes insulin resistance and glucose intolerance. Nat. Med. 2000;6:924–928. doi: 10.1038/78693. [DOI] [PubMed] [Google Scholar]
- 24.Xu H, Hirosumi J, Uysal KT, Guler AD, Hotamisligil GS. Exclusive action of transmembrane TNF alpha in adipose tissue leads to reduced adipose mass and local but not systemic insulin resistance. Endocrinology. 2002;143:1502–1511. doi: 10.1210/endo.143.4.8715. [DOI] [PubMed] [Google Scholar]
- 25.Xu H, Uysal KT, Becherer JD, Arner P, Hotamisligil GS. Altered tumor necrosis factor-alpha (TNF-alpha) processing in adipocytes and increased expression of transmembrane TNF-alpha in obesity. Diabetes. 2002;51:1876–1883. doi: 10.2337/diabetes.51.6.1876. [DOI] [PubMed] [Google Scholar]
- 26.Peschon JJ, et al. An essential role for ectodomain shedding in mammalian development. Science. 1998;282:1281–1284. doi: 10.1126/science.282.5392.1281. [DOI] [PubMed] [Google Scholar]
- 27.Aikawa M, et al. Lipid lowering by diet reduces matrix metalloproteinase activity and increases collagen content of rabbit atheroma: a potential mechanism of lesion stabilization. Circulation. 1998;97:2433–2444. doi: 10.1161/01.cir.97.24.2433. [DOI] [PubMed] [Google Scholar]
- 28.Gaede P, et al. Multifactorial intervention and cardiovascular disease in patients with type 2 diabetes. N. Engl. J. Med. 2003;348:383–393. doi: 10.1056/NEJMoa021778. [DOI] [PubMed] [Google Scholar]
- 29.Padwal R, Laupacis A. Antihypertensive therapy and incidence of type 2 diabetes: a systematic review. Diabetes Care. 2004;27:247–255. doi: 10.2337/diacare.27.1.247. [DOI] [PubMed] [Google Scholar]
- 30.Yuan M, et al. Reversal of obesity- and diet-induced insulin resistance with salicylates or targeted disruption of Ikkbeta. Science. 2001;293:1673–1677. doi: 10.1126/science.1061620. [DOI] [PubMed] [Google Scholar]
- 31.Bruning JC, et al. A muscle-specific insulin receptor knockout exhibits features of the metabolic syndrome of NIDDM without altering glucose tolerance. Mol. Cell. 1998;2:559–569. doi: 10.1016/s1097-2765(00)80155-0. [DOI] [PubMed] [Google Scholar]
- 32.Minokoshi Y, Kahn CR, Kahn BB. Tissue-specific ablation of the GLUT4 glucose transporter or the insulin receptor challenges assumptions about insulin action and glucose homeostasis. J. Biol. Chem. 2003;278:33609–33612. doi: 10.1074/jbc.R300019200. [DOI] [PubMed] [Google Scholar]
- 33.Mohler KM, et al. Protection against a lethal dose of endotoxin by an inhibitor of tumour necrosis factor processing. Nature. 1994;370:218–220. doi: 10.1038/370218a0. [DOI] [PubMed] [Google Scholar]
- 34.Qi JH, et al. A novel function for tissue inhibitor of metalloproteinases-3 (TIMP3): inhibition of angiogenesis by blockage of VEGF binding to VEGF receptor-2. Nat. Med. 2003;9:407–415. doi: 10.1038/nm846. [DOI] [PubMed] [Google Scholar]
- 35.Miyazaki Y, Pipek R, Mandarino LJ, DeFronzo RA. Tumor necrosis factor alpha and insulin resistance in obese type 2 diabetic patients. Int. J. Obes. Relat. Metab. Disord. 2003;27:88–94. doi: 10.1038/sj.ijo.0802187. [DOI] [PubMed] [Google Scholar]
- 36.Ofei F, Hurel S, Newkirk J, Sopwith M, Taylor R. Effects of an engineered human anti-TNF-alpha antibody (CDP571) on insulin sensitivity and glycemic control in patients with NIDDM. Diabetes. 1996;45:881–885. doi: 10.2337/diab.45.7.881. [DOI] [PubMed] [Google Scholar]
- 37.Bozkurt B, et al. Results of targeted anti-tumor necrosis factor therapy with etanercept (ENBREL) in patients with advanced heart failure. Circulation. 2001;103:1044–1047. doi: 10.1161/01.cir.103.8.1044. [DOI] [PubMed] [Google Scholar]
- 38.Chung ES, Packer M, Lo KH, Fasanmade AA, Willerson JT. Randomized, double-blind, placebo-controlled, pilot trial of infliximab, a chimeric monoclonal antibody to tumor necrosis factor-alpha, in patients with moderate-to-severe heart failure: results of the anti-TNF Therapy Against Congestive Heart Failure (ATTACH) trial. Circulation. 2003;107:3133–3140. doi: 10.1161/01.CIR.0000077913.60364.D2. [DOI] [PubMed] [Google Scholar]
- 39.Yu WH, Yu S, Meng Q, Brew K, Woessner JF., Jr TIMP-3 binds to sulfated glycosaminoglycans of the extracellular matrix. J. Biol. Chem. 2000;275:31226–31232. doi: 10.1074/jbc.M000907200. [DOI] [PubMed] [Google Scholar]
- 40.Jin G, et al. A continuous fluorimetric assay for tumor necrosis factor-alpha converting enzyme. Anal. Biochem. 2002;302:269–275. doi: 10.1006/abio.2001.5549. [DOI] [PubMed] [Google Scholar]
- 41.Federici M, et al. Insulin-dependent activation of endothelial nitric oxide synthase is impaired by O-linked glycosylation modification of signaling proteins in human coronary endothelial cells. Circulation. 2002;106:466–472. doi: 10.1161/01.cir.0000023043.02648.51. [DOI] [PubMed] [Google Scholar]
- 42.Hribal ML, Nakae J, Kitamura T, Shutter JR, Accili D. Regulation of insulin-like growth factor-dependent myoblast differentiation by Foxo forkhead transcription factors. J. Cell Biol. 2003;162:535–541. doi: 10.1083/jcb.200212107. [DOI] [PMC free article] [PubMed] [Google Scholar]
- 43.Lewis DL, Hagstrom JE, Loomis AG, Wolff JA, Herweijer H. Efficient delivery of siRNA for inhibition of gene expression in postnatal mice. Nat. Genet. 2002;32:107–108. doi: 10.1038/ng944. [DOI] [PubMed] [Google Scholar]


