

Abstract
Over 30 genomic regions show linkage to asthma traits. Six asthma genes have been cloned, but the putative loci in many linked regions have not been identified. To search for asthma susceptibility loci, we performed genomewide univariate linkage analyses of seven asthma traits, using 202 Australian families ascertained through a twin proband. House-dust mite sensitivity (Dpter) exceeded the empirical threshold for significant linkage at 102 cM on chromosome 20q13, near marker D20S173 (empirical pointwise P = .00001 and genomewide P = .005, both uncorrected for multiple-trait testing). Atopy, bronchial hyperresponsiveness (BHR), and forced expiratory volume in 1 s (FEV1) were also linked to this region. In addition, 16 regions were linked to at least one trait at the suggestive level, including 12q24, which has consistently shown linkage to asthma traits in other studies. Some regions were expected to be false-positives arising from multiple-trait testing. To address this, we developed a new approach to estimate genomewide significance that accounts for multiple-trait testing and for correlation between traits and that does not require a Bonferroni correction. With this approach, Dpter remained significantly linked to 20q13 (empirical genomewide P = .042), and airway obstruction remained linked to 12q24 at the suggestive level. Finally, we extended this method to show that the linkage of Dpter, atopy, BHR, FEV1, asthma, and airway obstruction to chromosome 20q13 is unlikely to be due to chance and may result from a quantitative trait locus in this region that affects several of these traits.
To date, 16 independent samples from 12 countries have been used in genomewide screens for asthma (MIM 600807) or atopy (MIM 147050) susceptibility loci (table 1). These screens have identified >30 regions of suggestive or significant linkage (Lander and Kruglyak 1995), leading to the positional cloning of four asthma genes or gene complexes: ADAM33 (MIM 607114) at 20p13 (Van Eerdewegh et al. 2002); PHF11 (MIM 607796) and SETDB2 (MIM 607865) at 13q14 (Zhang et al. 2003); DPP10 (MIM 608209) at 2q14 (Allen et al. 2003), and GPRA (MIM 608595) at 7p14 (Laitinen et al. 2004). Recently, evidence for two new cloned genes at 6p21 (Nicolae et al. 2005) and 5q33 (Noguchi et al. 2005) has been presented. It is likely that some of the remaining linked regions for which a QTL has not yet been characterized will prove spurious. In this respect, replication studies are essential to prioritize regions for subsequent fine mapping.
Table 1.
Summary of Results from Published Genome Scans of Asthma or Related Traits[Note]
|
Position(s) on Chromosome |
||||||||||||||||||||
| Reference(s) | Population(s)a | No. of Families (Subjects) | No. ofMarkers | 1 | 2 | 3 | 4 | 5 | 6 | 7 | 8 | 9 | 11 | 12 | 13 | 14 | 15 | 16 | 19 | 20 |
| Daniels et al. 1996 | Australian | 80 (364) | 296 | … | … | … | q35 | … | p22 | p14 | … | … | q12 | … | … | … | … | … | … | … |
| Mathias et al. 2001; Xu et al. 2001a; Blumenthal et al. 2004a, 2004b | CSGA, American | 287 (1,931) | 323 | p32 | … | … | … | … | … | … | … | … | … | … | … | … | … | … | p13 | … |
| Wjst et al. 1999 | German, Swedish | 97 (415) | 351 | … | … | … | … | p21 | … | … | … | … | … | … | … | … | … | … | … | |
| Ober et al. 2000 | Hutterites, American | 1 (693) | 563 | p21, p36 | q34 | p22, q12 | … | q15 | … | … | p12, q11, q21 | q31 | p15 | … | q12 | q32 | … | … | q13 | … |
| Yokouchi et al. 2000 | Japanese | 47 (197) | 376 | … | … | … | q34 | q33 |
… | … | … | … | … | … | q12 | … | … | … | … | … |
| Dizier et al. 2000 | EGEA, French | 107 (493) | 254 | … | … | … | … | … | … | … | … | … | … | q24 | … | … | … | … | … | … |
| Xu et al. 2001b | Chinese | 533 (2,551) | 422 | … | p25 |
… | q23 | … | … | … | … | … | … | … | … | … | … | p12 | … | … |
| Laitinen et al. 2001 | Finnish | 86 (443) | 312 | … | … | … | q21 | … | … | p14 | … | … | … | … | … | … | … | … | … | … |
| Xu et al. 2000; Koppelman et al. 2002; Meyers et al. 2005; Postma et al. 2005 | Dutch | 200 (1,174) | 366 | … | q32 |
… | … | q23-q31 | … | q21 | … | … | … | q23 | q13 | … | q12 | … | … | … |
| Haagerup et al. 2002 | Danish | 48 (206) | 446 | … | … | q24 | … | … | p24-p22 | … | … | … | … | … | … | … | … | … | … | … |
| Hakonarson et al. 2002 | Icelandic | 175 (1,134) | 976 | … | … | … | … | … | … | … | … | … | … | … | … | q24 | … | … | … | … |
| Van Eerdewegh et al. 2002 | American, British | 460 (920) | 387 | … | … | … | … | … | … | … | … | … | … | … | … | … | … | … | … | p13 |
| Yokouchi et al. 2002 | Japanese | 48 (188) | 400 | p36 | … | p24 |
… | q33 |
… | … | … | … | … | p13, q24 |
… | … | … | … | … | … |
| Bouzigon et al. 2004 | French | 295 (1,317) | 396 | … | … | … | … | … | … | … | … | … | … | p13 | … | … | … | … | … | … |
| Evans et al. 2004 | Australian | 539 (2,360) | 757 | … | q33 |
… | … | … | … | … | q24 | … | … | … | … | … | … | … | … | … |
| Kurz et al. 2005 | European | 82 (366) | 603 | … | p12 |
q21 |
… | … | … | … | … | … | … | … | … | … | … | q21 |
… | … |
Note.— Only regions of suggestive (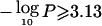 or as demonstrated by simulation) or significant (
 or as demonstrated by simulation) linkage are shown. Regions of significant linkage are underlined. Results from earlier studies that tested the same phenotypes in the same or a nested sample were not considered.
CSGA = Collaborative Study on the Genetics of Asthma; EGEA = Epidemiological Study on the Genetics and Environment of Asthma, Bronchial Hyperresponsiveness, and Atopy.
In this study, we searched for chromosomal regions linked to asthma in a sample of 202 Australian families ascertained through an asthmatic proband. These families were tested as part of a large asthma study performed with the approval of the Human Research Ethics Committee of the Queensland Institute of Medical Research and with the written informed consent of all participants. Detailed methods and phenotype descriptions are provided elsewhere (Ferreira et al., in press). In brief, four affection and three continuous traits were measured in 411 siblings but not in the 180 available parents from these families. The affection traits were self-reported asthma, bronchial hyperresponsiveness (BHR [MIM 600807]), atopy, and house-dust mite (Dermatophagoides pteronyssinus) sensitivity (Dpter). A participant was considered to be affected with asthma if he or she answered “Yes” or “Yes, told to me by a doctor” to the question “Have you ever suffered from asthma or wheezing?” and answered “Yes” to the question “Have you ever taken any medicine for asthma or wheezing?” A histamine challenge test was considered to have a positive result if the participant experienced a drop in forced expiratory volume in 1 s (FEV1) of ⩾20% of the post–saline inhalation FEV1 after the last dose of histamine was given. A participant was classified as atopic if at least 1 of 11 common allergens tested elicited a mean wheal diameter at least 3 mm greater than the negative control wheal. Similarly, a skin-prick test for Dpter was considered to have positive a result if the mean wheal diameter was 3 mm greater than the negative control wheal. The three continuous traits were baseline FEV1; baseline airway obstruction, as measured by FEV1 divided by forced vital capacity (FEV1/FVC); and total serum immunoglobulin E (IgE) levels. These were all measured in accordance with standard procedures (Ferreira et al., in press) and were normalized prior to analysis.
The characteristics of the 591 participants used for this genome scan are summarized in table 2. We have shown elsewhere that the seven traits of interest have a high reliability (test-retest correlation range 0.67–0.99), are all heritable (heritability range 0.38–0.71), have cross-trait phenotypic correlations across a wide range (0.03–0.81; mean 0.35), and are regulated to a great extent by specific genetic factors (Ferreira et al., in press). Nonetheless, there was some degree of genetic overlap, particularly between atopy and both asthma and BHR and, as expected, between markers of allergic sensitization (atopy, Dpter, and IgE).
Table 2.
Characteristics of 591 Participants from 202 Families Used for a Genome Scan of Multiple Asthma Traits
| Characteristics | Parents | Twins and Sibs |
| Subjects: | ||
| Total | 180 | 411 |
| With questionnaire | 7% | 100% |
| With full testing | 0% | 99% |
| Female sex | 59% | 57% |
| Mean (range) age [years] | 63 (45–80) | 38 (22–75) |
| Ever a smoker | 46% | 50% |
| Current smoker | 0% | 26% |
| Asthma | 23% | 38% |
| Doctor-diagnosed asthma | 23% | 31% |
| Positive BHR test | … | 48% |
| Atopy | … | 73% |
| Positive SPT for D. pteronyssinusa | … | 58% |
| FEV1⩽0.7 predicted | … | 6% |
| Mean (range) FEV1 | … | 3.3 (.7–5.7) |
| Mean (range) FEV1/FVC | … | .8 (.4–1.0) |
| IgE geometric mean (range) [IU/ml] | … | 71 (.6–6,908) |
SPT = skin-prick test.
In addition to these phenotypes, genomewide genotyping data were obtained for the 202 families as part of four recent twin studies of asthma (Ferreira et al., in press), neuroticism (Kirk et al. 2000), cardiovascular disease (Beekman et al. 2003), and other common disorders (Whitfield et al. 2000). When data from these four sources were combined, the genome-scan sample consisted of 87 families (43%) with no parents genotyped, 50 (25%) with one parent genotyped, and 65 (32%) with both parents genotyped. Of 218 sib pairs available for analysis, 14 (6%) were genotyped at 201–300 markers, 104 (48%) at 301–500 markers, 54 (25%) at 501–1,000 markers, and 46 (21%) at 1,001–1,544 markers. Familial relationships were verified using GRR (Abecasis et al. 2001), Mendelian inconsistencies were identified and removed using SIB-PAIR 0.99.9 (see Web Resources), and unlikely recombinants were identified and removed using MERLIN 1.0 (Abecasis and Wigginton 2005). The marker genetic positions were interpolated via locally weighted linear regression from the National Center for Biotechnology Information (NCBI) build 34.3 physical map positions and the published Rutgers genetic map (Kong et al. 2004), and they are expressed in Kosambi cM (see genetic map site in Web Resources). The average multipoint entropy information content (Kruglyak et al. 1996) was 0.57 (range 0.15–0.85), computed with MERLIN at the marker closest to the middle of the chromosome and averaged over the 22 autosomes. The average heterozygosity for the autosomal markers was 75%. The 218 available sib pairs were genotyped, on average, at 624 autosomal markers (range 201–1,544). Intermarker distances were estimated for each sib pair and then were averaged across the 218 pairs. The mean intermarker distance was 7.1 cM (range 2.8–15.8).
Two sets of univariate linkage analyses were performed. For both sets, the probabilities that two siblings shared 0, 1, or 2 alleles identical by descent (IBD) were estimated every 2 cM with MERLIN. For the four affection traits, the Whittemore and Halpern (1994) Sall statistic was calculated, and Z scores were converted into LOD scores by use of the Kong and Cox (1997) exponential model implemented in MERLIN. This analysis is appropriate for the type of sample-selection procedure used. For the three continuous traits, IBD probabilities were imported into SOLAR 2.1.4, and maximum-likelihood univariate variance-components linkage analysis was performed as implemented by Almasy and Blangero (1998). In addition, the fixed effects of significant (P<.05) covariates—age, sex, height (for FEV1 only), and regular smoking (for FEV1/FVC only)—were included in the means model. We have shown elsewhere that the ascertainment procedure had minimal impact on variance-components estimates of FEV1, FEV1/FVC, and IgE (Ferreira et al., in press), which reflects the low phenotypic correlations between these traits and asthma (range 0.25–0.29). Nonetheless, we used the proband-ascertainment correction implemented in SOLAR for variance-components linkage analyses. Residual kurtosis was 1.5 for FEV1, 0.43 for FEV1/FVC, and −0.36 for IgE.
Since the distribution of linkage test statistics was not comparable between affection and continuous traits or even between different continuous traits, all LOD scores were converted to empirical pointwise P values. In brief, to assess pointwise significance, we used MERLIN to generate 1,000 genome-scan replicates that retained the original phenotypes but had new genotypes simulated under the null hypothesis of no linkage for all autosomes, preserving the same allele frequencies, missing data pattern, and marker spacing. Linkage analysis was then performed for each trait with each genome-scan replicate, as described for the real data set. LOD scores observed with these simulated data sets were entirely due to chance. Once each trait was analyzed with the real genome scan and with the 1,000 genome-scan replicates, all LOD scores for that trait were combined into a single distribution. The empirical pointwise P value for each LOD l, obtained with the real or simulated data sets, was then computed as the proportion of LOD scores in this distribution that were ⩾l. All empirical pointwise P values are conveniently expressed as the −log10 of the P value (−log10P).
To assess genomewide significance, we further investigated how often a given −log10P was expected to be observed in a genome scan by chance alone. This was performed for each of the seven traits individually. Briefly, for each of the genome-scan replicates described above, we recorded the highest empirical pointwise −log10P observed for each chromosome and counted the number of chromosomes exhibiting a −log10P equal to or greater than a given threshold j. The empirical genomewide thresholds for suggestive or significant linkage (Lander and Kruglyak 1995) were defined as the threshold j for which we observed, on average, 1 or 0.05 peaks per genome scan with a  , respectively. For all traits, a −log10P of 2.1 was the threshold for suggestive linkage, and a −log10P of 4.0 was the threshold for significant linkage.
The strongest evidence of linkage in the univariate analyses occurred at 96–102 cM on chromosome 20q13, near markers D20S171 and D20S173 (fig. 1A–1G). At this location, significant linkage was observed for Dpter (empirical pointwise 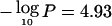 ), and suggestive linkage was observed for atopy (
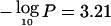 ), BHR (
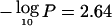 ), and FEV1 (
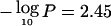 ). The mean proportion of alleles shared IBD at 20q13 was 0.62 (95% CI 0.55–0.69) for sib pairs concordant affected for Dpter, 0.52 (95% CI 0.46–0.58) for discordant pairs, and 0.49 (95% CI 0.39–0.58) for concordant unaffected pairs. Similar patterns of allele sharing were observed for atopy and BHR. The proportion of variance in FEV1 explained by a QTL in this region was 0.50 (95% CI 0.21–0.79), but this figure should be interpreted with care because effect sizes estimated from genomewide scans are known to have a large upward bias (Goring et al. 2001). Sixteen additional regions exceeded the threshold of suggestive linkage for at least one of the seven traits (table 3).
Figure 1.

Genomewide linkage results for asthma and related traits. Autosomes are arranged by number from p-ter to q-ter, with genetic distance expressed as Kosambi cM (0–3,548 cM). A–D, For the four affection traits, the Whittemore and Halpern (1994) Sall statistic was calculated, and Z scores were converted into LOD scores by use of the Kong and Cox (1997) exponential model implemented in MERLIN 1.0. LOD scores were then converted to empirical pointwise −log10P values by use of 1,000 genome-scan replicates simulated under the null hypothesis of no linkage. The same replicates were used to estimate the thresholds for genomewide suggestive and significant linkage (see main text). The number of families with two or more affected sibs was 34 for asthma, 49 for BHR, 115 for atopy, and 69 for Dpter. E–G, For the three continuous traits, IBD probabilities were imported into SOLAR, and maximum-likelihood univariate variance-components linkage analysis was performed with the fixed effects of covariates (see main text) and proband-ascertainment correction. LOD scores were converted to empirical pointwise −log10P values, and genomewide thresholds were estimated as described above. The minimum value for the Y-axis corresponds to −log10(.5) (i.e., LOD=0). The top horizontal line shows the empirical genomewide threshold for significant linkage ( , for all traits), and the bottom line, for suggestive linkage (
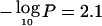 ). H, Multipoint entropy information content (Kruglyak et al. 1996). The average information content was 0.57, computed with MERLIN at the marker closest to the middle of the chromosome and averaged over the 22 autosomes.
Table 3.
Univariate Linkage Results with −log10P ⩾ 2
|
Empirical Pointwise −log10P forb |
|||||||||
| Region | Locationa(cM) | Peak Marker(s) | Asthma | BHR | Atopy | Dpter | FEV1 | FEV1/FVC | IgE |
| 1q24-q25 | 182–184 | D1S196, D1S1589 | 3.20 | … | … | … | … | … | 2.08 |
| 2q14 | 136 | D2S347 | … | … | … | 2.19 | … | … | … |
| 2q35 | 220 | D2S434 | … | … | 2.43 | … | … | … | … |
| 3p23 | 60 | D3S1768 | … | … | … | 2.86 | … | … | … |
| 3q12 | 114 | D3S1271 | … | … | 2.75 | … | … | … | … |
| 4p16 | 8 | D4S412 | 2.60 | … | … | … | … | … | … |
| 4q21 | 94 | D4S400 | … | … | … | … | … | 2.07 | … |
| 5q13 | 90 | D5S424 | … | … | … | … | 2.71 | … | … |
| 6p21 | 62–64 | D6S426, D6S1017 | … | 2.20 | 2.01 | … | … | … | … |
| 8p21 | 52 | D8S1771 | … | … | … | … | 2.26 | … | … |
| 9q34 | 142 | D9S290 | … | … | … | … | … | 2.02 | … |
| 10q22 | 92–104 | D10S535, D10S1686 | … | … | … | 3.20 | … | … | 2.26 |
| 11p15 | 22 | D11S1999 | 2.55 | … | … | … | … | … | … |
| 12q24 | 166–168 | D12S343, D12S1723 | … | … | … | … | 2.78 | 3.53 | … |
| 17q21 | 72–74 | D17S791 | 2.41 | … | 2.13 | … | … | … | … |
| 17q25 | 128 | D17S784 | … | … | … | … | 2.35 | … | … |
| 18p11 | 30 | D18S843 | 2.70 | … | … | … | … | … | … |
| 19p13 | 20 | D19S1034 | 2.87 | … | … | … | … | … | … |
| 20q13 | 96–102 | D20S171, D20S173 | … | 2.64 | 3.21 | 4.93 | 2.45 | … | … |
Marker locations are given in Kosambi cM and have been interpolated from published physical positions and genetic maps (Kong et al. 2004).
Empirical pointwise P values and genomewide thresholds were estimated for each trait from 1,000 genome-scan replicates generated under the null hypothesis of no linkage (see main text for details). Empirical genomewide thresholds for all traits were 2.1 for suggestive linkage and 4.0 for significant linkage.
Some of the regions identified with univariate analyses were expected to be false positives arising from multiple-trait testing. The first approach used to address this problem was to perform variance-components analysis of multiple asthma traits by use of the algorithm implemented in SOLAR 3.0.3 and outlined by Williams et al. (1999b). Multivariate linkage analyses of the three continuous traits (FEV1, FEV1/FVC, and IgE) improved the evidence of linkage at 20q13 and 12q24, compared with the individual univariate analyses of these three traits (not shown). However, linkage models could not be consistently maximized when affection traits were added to the multivariate analysis of the three continuous traits. In addition, estimation of empirical significance was not feasible, with one genome-scan replicate of three traits taking ∼2 wk to run on a 2.80-GHz processor. As a result, multivariate analysis could not be used to overcome the problem of multiple-trait testing.
We then developed and applied a simple approach to estimate genomewide significance while accounting for multiple-trait testing and for the correlation structure between traits. To exemplify our approach, consider the empirical pointwise −log10P observed for the seven traits at position 102 cM on chromosome 20: 1.04 (asthma), 2.59 (BHR), 3.21 (atopy), 4.93 (Dpter), 2.45 (FEV1), 0.95 (FEV1/FVC), and 0.30 (IgE). Note that these −log10P refer specifically to position 102 cM, whereas table 3 reports the highest −log10P for each trait within the 96–102 cM range. First, we sorted these −log10P values in descending order to create the observed vector of ordered −log10P values, VQ=[4.93, 3.21, 2.59, 2.45, 1.04, 0.95, 0.30]. This same procedure was used to create one simulated vector (VNull) for each position of the 1,000 genome-scan replicates simulated under the null hypothesis of no linkage (see above). We analyzed 1,796 positions throughout the 22 autosomes (3,548 cM at 2-cM intervals), and thus 1,796 VNull vectors of ordered −log10P values were created for each genome-scan replicate. Note—and this is crucial—that the order of traits does not have to be the same in the observed vector VQ and in the simulated vectors VNull, a property that forms the basis for correction of multiple-trait testing. Second, to compute the genomewide P value for trait k of VQ, we counted the proportion of genome-scan replicates that had at least one VNull vector with a highest −log10P greater than or equal to the −log10P recorded for trait k of VQ.
When this approach was applied to Dpter at 20q13, 42 of 1,000 genome-scan replicates had one or more VNull vectors with a highest  . Therefore, the genomewide P value for Dpter at this position remained significant after multiple-trait testing was correctly accounted for (P=.042). Note that, if we had applied the traditional approach of estimating the genomewide significance for Dpter individually, then P would be equal to .005—that is, there were 5/1,000 Dpter genome-scan replicates with one or more positions that exceeded a −log10P of 4.93. If a Bonferroni correction were then used to account for multiple-trait testing, the genomewide P would lie between .025 (correction for five independent traits, as identified by principal-components analysis) and .035 (correction for seven traits tested). Of the remaining 16 regions of suggestive linkage shown in table 3, only the linkage between 12q24 and FEV1/FVC was at the suggestive level after multiple-trait testing was accounted for, with an expected number of false positives per genome scan of 0.741 (P=.509).
Six traits were linked to chromosome 20q13, although only Dpter showed linkage at the significant level (fig. 2). Next, we investigated whether the simultaneous linkage of multiple traits to 20q13 could be attributed either to a pleiotropic QTL in this region or simply to chance. For this purpose, we extended the approach described above to estimate the probability that a genome scan simulated under the null hypothesis of no linkage could have one or more VNull vectors with the sum of the k highest −log10P values (i.e., 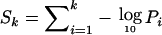 ) greater than or equal to the sum of the k highest −log10P values of VQ at 102 cM on 20q13, where k=1,2,…,7 (table 4). A similar method was recently proposed to combine P values obtained in performing association analysis of multiple SNPs, such as in genomewide association studies (Hoh et al. 2001; Dudbridge and Koeleman 2004). The significance of the Sk statistics computed at VQ was expected to decrease as k approached the number of traits influenced by an underlying QTL and to stabilize thereafter (for similar examples, see Hoh et al. [2001] and Dudbridge and Koeleman [2004]). Note that the same seven traits were analyzed with the real genome scan and with each genome-scan replicate, which thus preserved the original correlation structure between traits in the analyses performed under the null hypothesis.
Figure 2.

Details of linkage results on chromosome 20 for Dpter (red), atopy (orange), BHR (light green), FEV1 (dark green), asthma (light blue), and FEV1/FVC (dark blue). The solid horizontal line shows the empirical genomewide threshold for significant linkage, and the dashed line shows the threshold for suggestive linkage (see main text). Multipoint entropy information content (Kruglyak et al. 1996) is also shown (dotted line). Highlighted at the top are the positions of ADAM33 (unblackened arrowhead), the centromere (blackened arrowhead), and the markers genotyped in the 20q terminal region. Note that the X-axis scale ends at 102 cM, although the last X-axis label is 100 cM for convenience.
Table 4.
Empirical Genomewide Significance of the Seven Sk Sum Statistics Recorded at Position 102 cM on Chromosome 20q13
| Rank (k) | Trait | −log10Pa | Cumulative−log10P (Sk) | Pb |
| 1 | Dpter | 4.93 | 4.93 | .042 |
| 2 | Atopy | 3.21 | 8.14 | .026 |
| 3 | BHR | 2.59 | 10.73 | .017 |
| 4 | FEV1 | 2.45 | 13.18 | .012 |
| 5 | Asthma | 1.04 | 14.22 | .011 |
| 6 | FEV1/FVC | .95 | 15.17 | .007 |
| 7 | IgE | .30 | 15.47 | .007 |
Empirical pointwise −log10P for each trait at 102 cM on 20q13.
Empirical genomewide significance of Sk. Corresponds to the proportion of genome-scan replicates with one or more positions with an Sk statistic greater than or equal to the Sk observed at 20q13 in the real scan. The probabilities were estimated from 1,000 genome-scan replicates simulated under the null hypothesis of no linkage (see main text).
When only the highest −log10P at 20q13 was considered (4.93 for Dpter), the genomewide P value was .042, as described above. However, when we considered the cumulative  observed for Dpter and atopy (8.14), only 26/1,000 genome-scan replicates had at least one simulated vector with the sum of the two highest
 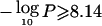 (P=.026). If the linkage of atopy to 20q13 was spurious or a result of the residual correlation between this trait and Dpter, then no improvement in significance would be expected when both traits were considered. Similarly, only 7/1,000 genome-scan replicates had one or more simulated vectors with a sum of the six highest −log10P values ⩾15.17 (P=.007). Even the addition of the FEV1/FVC trait, which had an empirical pointwise −log10P of only 0.95, considerably increased the evidence for linkage in this region. On the other hand, taking the IgE trait into consideration had no impact on the overall linkage significance, which suggests that a QTL in this region either does not regulate variation in total serum IgE levels or does so only to a degree that is undetectable in this sample. Therefore, our results suggest that the simultaneous linkage of Dpter, atopy, BHR, FEV1, asthma, and FEV1/FVC to chromosome 20q13 is unlikely to be due to chance or to the residual correlation between these traits and may result from a pleiotropic or multiple QTL that map(s) to this region.
Finally, since we computed seven Sk sum statistics in this process, we estimated the global genomewide significance of linkage between the six traits and 20q13, using a permutation test similar to that proposed by Hoh et al. (2001). (Note: The SAS routines used to estimate genomewide significance in the present study are available from the authors upon request.) In this case, the test consisted of counting the proportion of genome-scan replicates that had one or more VNull vectors with any of the seven Sk sum statistics as significant as the Sk statistic observed at 20q13 when k=6 (with P=.007). We observed 23 of such genome-scan replicates among the 1,000 total replicates, and thus the global genomewide significance for multiple linkage at 20q13 was P=.023. Although it was beyond the scope of this study, we performed simulations that showed that this method of combining results from univariate linkage analyses can be as powerful as formal multivariate variance-components analysis in detecting a pleiotropic QTL, with the advantage that it is computationally feasible for any number of traits, even if these are analyzed with different linkage statistics (not shown).
In this study, we searched for chromosomal regions linked to asthma traits measured in 202 Australian families ascertained through a twin proband. Univariate analyses of seven traits identified 1 region of significant linkage and 16 of suggestive linkage. Some of these regions have previously been identified by more than one study at a suggestive or significant level, in particular 2q33-q35, 6p21, and 12q24 (table 1). However, it was likely that some were, in fact, false-positives arising from multiple-trait testing. The most common approach to address this issue is to perform multiple univariate analyses and then apply a Bonferroni correction to the observed P values. This approach, however, has well-known limitations. First, the significance of a particular position (i.e., marker) is assessed separately for each trait, which can result in many traits being linked to the same position but none at a particularly significant level. Second, the Bonferroni correction can be conservative in some situations and, thus, may contribute to a reduction in the power of the analysis.
One alternative is to perform a principal-components analysis of all traits tested and then analyze only the extracted independent factor scores. This approach has been applied previously to asthma (Holberg et al. 2001). However, although it overcomes the problem of testing correlated traits, this approach minimizes but does not entirely overcome the problem of testing multiple traits, and it may result in testing of phenotypes that are not comparable to those in other studies. Another alternative is to perform a full multivariate analysis of all phenotypes tested. This was recently applied to traits such as alcoholism (Williams et al. 1999a), dyslexia (Marlow et al. 2003), and metabolic syndrome (Olswold and de Andrade 2003). Although theoretically desirable, the multivariate approach also has some limitations. First, multivariate linkage is not always guaranteed to provide increased power compared with that of individual univariate analyses. Martin et al. (1997) showed that power is improved if the pattern of factor loadings in the QTL is correctly specified but is reduced if it is incorrectly specified. Furthermore, the gain in power seems to be considerable only when a pleiotropic QTL and the residual sources of variation induce cross-trait correlations in opposite directions (Allison et al. 1998; Amos et al. 2001; Evans and Duffy 2004). An additional limitation of multivariate analysis is computational. The two methods available for multivariate linkage are the variance-components method (Eaves et al. 1996; Blangero and Almasy 1997; de Andrade et al. 1997) and a modified Haseman-Elston method (Amos et al. 1990). In theory, variance components can be extended to any number of traits, but, in practice, only a restricted number of traits can be effectively analyzed with current tools, particularly if both continuous and affection traits are being measured or if empirical significance will be estimated. This was the case for the multivariate analyses reported here. Continuous and affection traits could not be analyzed simultaneously, and empirical significance could not be assessed. Similarly, at present, the multivariate Haseman-Elston method is limited to sib pairs and provides lower power than does the multivariate variance-components method (Amos et al. 2001).
Thus, commonly used approaches to address multiple-trait testing in the context of linkage analyses are limited in their power and/or applicability. We sought to develop a general method for the assessment of experimentwise linkage significance that took into account the information provided by the multiple univariate analyses performed. The approach outlined and implemented here efficiently overcomes the acute problem of multiple-trait testing without resorting to a Bonferroni correction. In the first published genomewide screen for asthma, Daniels et al. (1996) used a permutation method that is similar in principle to our approach; unfortunately, very few genomewide linkage studies adopted their method. In addition, the approach we describe here can be extended to assess the evidence for linkage at a particular position across a number of traits. When this method was applied to our genome scan of seven asthma traits, two regions were identified that exceeded the genomewide threshold for suggestive (12q24) or significant (20q13) linkage. Chromosome 12q24 was linked to the lung function traits FEV1/FVC and FEV1. To date, three studies have reported suggestive or significant linkage to 12q23-q24 (table 1), but a major asthma gene has yet to be cloned in this region. A number of association studies suggest that the nitric oxide synthase 1 gene (NOS1 [MIM 163731]) is a likely candidate (Grasemann et al. 1999; Gao et al. 2000; Wechsler et al. 2000; Ali et al. 2003; Shao et al. 2004).
However, the most significant evidence for linkage was observed at a novel region, chromosome 20q13. Multiple traits were linked to this region, including Dpter, atopy, BHR, FEV1, asthma, and FEV1/FVC. The simultaneous linkage of these six traits to 20q13 was expected by chance alone in only 7 of 1,000 genome scans. Therefore, we suggest that a pleiotropic QTL and/or multiple clustered QTL in this region contribute(s) to the variation of Dpter, atopy, BHR, and FEV1, although to different degrees. A QTL at 20q13 may also directly influence asthma status and variation in FEV1/FVC. To our knowledge, no study has reported suggestive or significant linkage of asthma traits to this region. There are many examples of genes shown to be associated with asthma for which suggestive or significant linkage was reported in only a small number of independent samples, including ADAM33 and DPP10. This may result from a combination of factors—namely, genetic heterogeneity and, in the case of loci located near terminal positions, low inheritance information available toward the telomeres. A number of chromosomes in our genome scan displayed such effects, but the entropy information content at the last 10 cM of chromosome 20—where our six peaks lie—ranged from 0.40 to 0.60, which is comparable to the genomewide mean (0.57). Singlepoint analyses provided further confidence that these results are unlikely to be driven by only one marker or to be an artifact caused by end-of-map problems. Dpter showed singlepoint LOD scores ⩾1.0 for D20S100, UT254, TTTA093, and D20S171 and ⩾0.7 for AAT269, GATA45B10, UT1772, and D20S173 (see fig. 2 for positions).
Finally, the 20q13 linkage region is broad, with the equivalent of a 1-LOD drop interval of 12 cM (8.7 Mb) situated between D20S100 and 20qter. At present, there are 117 known genes in this segment, of which only the cadherin-like 26 gene (CDH26) stands out as a candidate gene for atopy or asthma. Although ADAM33 is also located on chromosome 20, it is 54.7 Mb distant and, thus, is very unlikely to explain our linkage signal. However, we note that most, if not all, cloned asthma genes had no obvious functional relevance when first identified. Therefore, subsequent fine-mapping strategies are warranted across the entire 20q13 linkage region.
Acknowledgments
We thank all the families who participated in this study. We also thank Dr. Claire Wainwright, Barbara Haddon, Dixie Statham, Wendy Oddy, Sunalene Devadason, Dr. Nigel Dore, Marita Dalton, Brigitte Willemse, Elena Belousova, Janet Li, and Dr. Jennifer Peat, for phenotype collection; Dr. Jeff Hall (Sequana scan), Dr. Peter Reed (Gemini Genomics scan), Dr. Eline Slagboom, Dr. Bas Heijmans, and Professor Dorret Boomsma (Leiden scan), and Dr. James Weber (Marshfield scan), for genotype collection; Sarah Medland and Kate Morley, for their work with some of the genotyping data; Gu Zhu, David Smyth, and Scott Gordon, for IT support; Dr. Gonçalo Abecasis, for advice on the analysis; and Dr. Dale Nyholt, for valuable comments on the original manuscript. We particularly acknowledge Professor Lon Cardon’s role in the establishment of this project. We also thank two referees for suggestions that helped to improve the manuscript.
Web Resources
The URLs for data presented herein are as follows:
- Genetic map with interpolated genetic map positions used for linkage analyses, http://www.qimr.edu.au/davidD/master_map.dat
- Online Mendelian Inheritance in Man (OMIM), http://www.ncbi.nlm.nih.gov/Omim/ (for asthma, atopy, ADAM33, PHF11, SETDB2, DPP10, GPRA, BHR, NOS1)
- SIB-PAIR 0.99.9, http://www.qimr.edu.au/davidD/sib-pair.html
References
- Abecasis GR, Cherny SS, Cookson WO, Cardon LR (2001) GRR: graphical representation of relationship errors. Bioinformatics 17:742–743 10.1093/bioinformatics/17.8.742 [DOI] [PubMed] [Google Scholar]
- Abecasis GR, Wigginton JE (2005) Handling marker-marker linkage disequilibrium: pedigree analysis with clustered markers. Am J Hum Genet 77:754–767 [DOI] [PMC free article] [PubMed] [Google Scholar]
- Ali M, Khoo SK, Turner S, Stick S, Le Souëf P, Franklin P (2003) NOS1 polymorphism is associated with atopy but not exhaled nitric oxide levels in healthy children. Pediatr Allergy Immunol 14:261–265 10.1034/j.1399-3038.2003.00065.x [DOI] [PubMed] [Google Scholar]
- Allen M, Heinzmann A, Noguchi E, Abecasis G, Broxholme J, Ponting CP, Bhattacharyya S, et al (2003) Positional cloning of a novel gene influencing asthma from chromosome 2q14. Nat Genet 35:258–263 10.1038/ng1256 [DOI] [PubMed] [Google Scholar]
- Allison DB, Thiel B, St Jean P, Elston RC, Infante MC, Schork NJ (1998) Multiple phenotype modeling in gene-mapping studies of quantitative traits: power advantages. Am J Hum Genet 63:1190–1201 [DOI] [PMC free article] [PubMed] [Google Scholar]
- Almasy L, Blangero J (1998) Multipoint quantitative-trait linkage analysis in general pedigrees. Am J Hum Genet 62:1198–1211 [DOI] [PMC free article] [PubMed] [Google Scholar]
- Amos C, de Andrade M, Zhu D (2001) Comparison of multivariate tests for genetic linkage. Hum Hered 51:133–144 10.1159/000053334 [DOI] [PubMed] [Google Scholar]
- Amos CI, Elston RC, Bonney GE, Keats BJ, Berenson GS (1990) A multivariate method for detecting genetic linkage, with application to a pedigree with an adverse lipoprotein phenotype. Am J Hum Genet 47:247–254 [PMC free article] [PubMed] [Google Scholar]
- Beekman M, Heijmans BT, Martin NG, Whitfield JB, Pedersen NL, DeFaire U, Snieder H, Lakenberg N, Suchiman HE, de Knijff P, Frants RR, van Ommen GJ, Kluft C, Vogler GP, Boomsma DI, Slagboom PE (2003) Evidence for a QTL on chromosome 19 influencing LDL cholesterol levels in the general population. Eur J Hum Genet 11:845–850 10.1038/sj.ejhg.5201053 [DOI] [PubMed] [Google Scholar]
- Blangero J, Almasy L (1997) Multipoint oligogenic linkage analysis of quantitative traits. Genet Epidemiol 14:959–964 [DOI] [PubMed] [Google Scholar]
- Blumenthal MN, Langefeld CD, Beaty TH, Bleecker ER, Ober C, Lester L, Lange E, Barnes KC, Wolf R, King RA, Solway J, Oetting W, Meyers DA, Rich SS (2004a) A genome-wide search for allergic response (atopy) genes in three ethnic groups: Collaborative Study on the Genetics of Asthma. Hum Genet 114:157–164 10.1007/s00439-003-1030-5 [DOI] [PubMed] [Google Scholar]
- Blumenthal MN, Ober C, Beaty TH, Bleecker ER, Langefeld CD, King RA, Lester L, Cox N, Barnes K, Togias A, Mathias R, Meyers DA, Oetting W, Rich SS (2004b) Genome scan for loci linked to mite sensitivity: the Collaborative Study on the Genetics of Asthma (CSGA). Genes Immun 5:226–231 10.1038/sj.gene.6364063 [DOI] [PubMed] [Google Scholar]
- Bouzigon E, Dizier MH, Krahenbuhl C, Lemainque A, Annesi-Maesano I, Betard C, Bousquet J, Charpin D, Gormand F, Guilloud-Bataille M, Just J, Moual NL, Maccario J, Matran R, Neukirch F, Oryszczyn MP, Paty E, Pin I, Rosenberg-Bourgin M, Vervloet D, Kauffmann F, Lathrop M, Demenais F (2004) Clustering patterns of LOD scores for asthma-related phenotypes revealed by a genome-wide screen in 295 French EGEA families. Hum Mol Genet 13:3103–3113 10.1093/hmg/ddh340 [DOI] [PubMed] [Google Scholar]
- Daniels SE, Bhattacharrya S, James A, Leaves NI, Young A, Hill MR, Faux JA, Ryan GF, le Souef PN, Lathrop GM, Musk AW, Cookson WO (1996) A genome-wide search for quantitative trait loci underlying asthma. Nature 383:247–250 10.1038/383247a0 [DOI] [PubMed] [Google Scholar]
- de Andrade M, Thiel TJ, Yu L, Amos CI (1997) Assessing linkage on chromosome 5 using components of variance approach: univariate versus multivariate. Genet Epidemiol 14:773–778 [DOI] [PubMed] [Google Scholar]
- Dizier MH, Besse-Schmittler C, Guilloud-Bataille M, Annesi-Maesano I, Boussaha M, Bousquet J, Charpin D, et al (2000) Genome screen for asthma and related phenotypes in the French EGEA study. Am J Respir Crit Care Med 162:1812–1818 [DOI] [PubMed] [Google Scholar]
- Dudbridge F, Koeleman BP (2004) Efficient computation of significance levels for multiple associations in large studies of correlated data, including genomewide association studies. Am J Hum Genet 75:424–435 [DOI] [PMC free article] [PubMed] [Google Scholar]
- Eaves LJ, Neale MC, Maes H (1996) Multivariate multipoint linkage analysis of quantitative trait loci. Behav Genet 26:519–525 [DOI] [PubMed] [Google Scholar]
- Evans DM, Duffy DL (2004) A simulation study concerning the effect of varying the residual phenotypic correlation on the power of bivariate quantitative trait loci linkage analysis. Behav Genet 34:135–141 10.1023/B:BEGE.0000013727.15845.f8 [DOI] [PubMed] [Google Scholar]
- Evans DM, Zhu G, Duffy DL, Montgomery GW, Frazer IH, Martin NG (2004) Major quantitative trait locus for eosinophil count is located on chromosome 2q. J Allergy Clin Immunol 114:826–830 10.1016/j.jaci.2004.05.060 [DOI] [PubMed] [Google Scholar]
- Ferreira MAR, O’Gorman L, Le Souëf P, Burton PR, Toelle BG, Robertson CF, Martin NG, Duffy DL. Variance components analyses of multiple asthma traits in a large sample of Australian families ascertained through a twin proband. Allergy (in press) [DOI] [PubMed] [Google Scholar]
- Gao PS, Kawada H, Kasamatsu T, Mao XQ, Roberts MH, Miyamoto Y, Yoshimura M, Saitoh Y, Yasue H, Nakao K, Adra CN, Kun JF, Moro-oka S, Inoko H, Ho LP, Shirakawa T, Hopkin JM (2000) Variants of NOS1, NOS2, and NOS3 genes in asthmatics. Biochem Biophys Res Commun 267:761–763 10.1006/bbrc.1999.2030 [DOI] [PubMed] [Google Scholar]
- Göring HHH, Terwilliger JD, Blangero J (2001) Large upward bias in estimation of locus-specific effects from genomewide scans. Am J Hum Genet 69:1357–1369 [DOI] [PMC free article] [PubMed] [Google Scholar]
- Grasemann H, Yandava CN, Drazen JM (1999) Neuronal NO synthase (NOS1) is a major candidate gene for asthma. Clin Exp Allergy Suppl 4 29:39–41 [PubMed] [Google Scholar]
- Haagerup A, Bjerke T, Schiotz PO, Binderup HG, Dahl R, Kruse TA (2002) Asthma and atopy—a total genome scan for susceptibility genes. Allergy 57:680–686 10.1034/j.1398-9995.2002.23523.x [DOI] [PubMed] [Google Scholar]
- Hakonarson H, Bjornsdottir US, Halapi E, Palsson S, Adalsteinsdottir E, Gislason D, Finnbogason G, Gislason T, Kristjansson K, Arnason T, Birkisson I, Frigge ML, Kong A, Gulcher JR, Stefansson K (2002) A major susceptibility gene for asthma maps to chromosome 14q24. Am J Hum Genet 71:483–491 [DOI] [PMC free article] [PubMed] [Google Scholar]
- Hoh J, Wille A, Ott J (2001) Trimming, weighting, and grouping SNPs in human case-control association studies. Genome Res 11:2115–2119 10.1101/gr.204001 [DOI] [PMC free article] [PubMed] [Google Scholar]
- Holberg CJ, Halonen M, Solomon S, Graves PE, Baldini M, Erickson RP, Martinez FD (2001) Factor analysis of asthma and atopy traits shows 2 major components, one of which is linked to markers on chromosome 5q. J Allergy Clin Immunol 108:772–780 10.1067/mai.2001.119158 [DOI] [PubMed] [Google Scholar]
- Kirk KM, Birley AJ, Statham DJ, Haddon B, Lake RI, Andrews JG, Martin NG (2000) Anxiety and depression in twin and sib pairs extremely discordant and concordant for neuroticism: prodromus to a linkage study. Twin Res 3:299–309 10.1375/136905200320565274 [DOI] [PubMed] [Google Scholar]
- Kong A, Cox NJ (1997) Allele-sharing models: LOD scores and accurate linkage tests. Am J Hum Genet 61:1179–1188 [DOI] [PMC free article] [PubMed] [Google Scholar]
- Kong X, Murphy K, Raj T, He C, White PS, Matise TC (2004) A combined linkage-physical map of the human genome. Am J Hum Genet 75:1143–1148 [DOI] [PMC free article] [PubMed] [Google Scholar]
- Koppelman GH, Stine OC, Xu J, Howard TD, Zheng SL, Kauffman HF, Bleecker ER, Meyers DA, Postma DS (2002) Genome-wide search for atopy susceptibility genes in Dutch families with asthma. J Allergy Clin Immunol 109:498–506 10.1067/mai.2002.122235 [DOI] [PubMed] [Google Scholar]
- Kruglyak L, Daly MJ, Reeve-Daly MP, Lander ES (1996) Parametric and nonparametric linkage analysis: a unified multipoint approach. Am J Hum Genet 58:1347–1363 [PMC free article] [PubMed] [Google Scholar]
- Kurz T, Altmueller J, Strauch K, Ruschendorf F, Heinzmann A, Moffatt MF, Cookson WO, Inacio F, Nurnberg P, Stassen HH, Deichmann KA (2005) A genome-wide screen on the genetics of atopy in a multiethnic European population reveals a major atopy locus on chromosome 3q21.3. Allergy 60:192–199 10.1111/j.1398-9995.2005.00646.x [DOI] [PubMed] [Google Scholar]
- Laitinen T, Daly MJ, Rioux JD, Kauppi P, Laprise C, Petays T, Green T, Cargill M, Haahtela T, Lander ES, Laitinen LA, Hudson TJ, Kere J (2001) A susceptibility locus for asthma-related traits on chromosome 7 revealed by genome-wide scan in a founder population. Nat Genet 28:87–91 10.1038/88319 [DOI] [PubMed] [Google Scholar]
- Laitinen T, Polvi A, Rydman P, Vendelin J, Pulkkinen V, Salmikangas P, Makela S, Rehn M, Pirskanen A, Rautanen A, Zucchelli M, Gullsten H, Leino M, Alenius H, Petays T, Haahtela T, Laitinen A, Laprise C, Hudson TJ, Laitinen LA, Kere J (2004) Characterization of a common susceptibility locus for asthma-related traits. Science 304:300–304 10.1126/science.1090010 [DOI] [PubMed] [Google Scholar]
- Lander E, Kruglyak L (1995) Genetic dissection of complex traits: guidelines for interpreting and reporting linkage results. Nat Genet 11:241–247 10.1038/ng1195-241 [DOI] [PubMed] [Google Scholar]
- Marlow AJ, Fisher SE, Francks C, MacPhie IL, Cherny SS, Richardson AJ, Talcott JB, Stein JF, Monaco AP, Cardon LR (2003) Use of multivariate linkage analysis for dissection of a complex cognitive trait. Am J Hum Genet 72:561–570 [DOI] [PMC free article] [PubMed] [Google Scholar]
- Martin N, Boomsma D, Machin G (1997) A twin-pronged attack on complex traits. Nat Genet 17:387–392 10.1038/ng1297-387 [DOI] [PubMed] [Google Scholar]
- Mathias RA, Freidhoff LR, Blumenthal MN, Meyers DA, Lester L, King R, Xu JF, Solway J, Barnes KC, Pierce J, Stine OC, Togias A, Oetting W, Marshik PL, Hetmanski JB, Huang SK, Ehrlich E, Dunston GM, Malveaux F, Banks-Schlegel S, Cox NJ, Bleecker E, Ober C, Beaty TH, Rich SS (2001) Genome-wide linkage analyses of total serum IgE using variance components analysis in asthmatic families. Genet Epidemiol 20:340–355 10.1002/gepi.5 [DOI] [PubMed] [Google Scholar]
- Meyers DA, Postma DS, Stine OC, Koppelman GH, Ampleford EJ, Jongepier H, Howard TD, Bleecker ER (2005) Genome screen for asthma and bronchial hyperresponsiveness: interactions with passive smoke exposure. J Allergy Clin Immunol 115:1169–1175 10.1016/j.jaci.2005.01.070 [DOI] [PubMed] [Google Scholar]
- Nicolae D, Cox NJ, Lester LA, Schneider D, Tan Z, Billstrand C, Kuldanek S, Donfack J, Kogut P, Patel NM, Goodenbour J, Howard T, Wolf R, Koppelman GH, White SR, Parry R, Postma DS, Meyers D, Bleecker ER, Hunt JS, Solway J, Ober C (2005) Fine mapping and positional candidate studies identify HLA-G as an asthma susceptibility gene on chromosome 6p21. Am J Hum Genet 76:349–357 [DOI] [PMC free article] [PubMed] [Google Scholar]
- Noguchi E, Yokouchi Y, Zhang J, Shibuya K, Shibuya A, Bannai M, Tokunaga K, Doi H, Tamari M, Shimizu M, Shirakawa T, Shibasaki M, Ichikawa K, Arinami T (2005) Positional identification of an asthma susceptibility gene on human chromosome 5q33. Am J Respir Crit Care Med 172:183–188 10.1164/rccm.200409-1223OC [DOI] [PubMed] [Google Scholar]
- Ober C, Tsalenko A, Parry R, Cox NJ (2000) A second-generation genomewide screen for asthma-susceptibility alleles in a founder population. Am J Hum Genet 67:1154–1162 [DOI] [PMC free article] [PubMed] [Google Scholar]
- Olswold C, de Andrade M (2003) Localization of genes involved in the metabolic syndrome using multivariate linkage analysis. BMC Genet Suppl 1 4:S57 10.1186/1471-2156-4-S1-S57 [DOI] [PMC free article] [PubMed] [Google Scholar]
- Postma DS, Meyers DA, Jongepier H, Howard TD, Koppelman GH, Bleecker ER (2005) Genomewide screen for pulmonary function in 200 families ascertained for asthma. Am J Respir Crit Care Med 172:446–452 10.1164/rccm.200407-864OC [DOI] [PMC free article] [PubMed] [Google Scholar]
- Shao C, Suzuki Y, Kamada F, Kanno K, Tamari M, Hasegawa K, Aoki Y, Kure S, Yang X, Endo H, Takayanagi R, Nakazawa C, Morikawa T, Morikawa M, Miyabayashi S, Chiba Y, Karahashi M, Saito S, Tamura G, Shirakawa T, Matsubara Y (2004) Linkage and association of childhood asthma with the chromosome 12 genes. J Hum Genet 49:115–122 10.1007/s10038-003-0118-z [DOI] [PubMed] [Google Scholar]
- Van Eerdewegh P, Little RD, Dupuis J, Del Mastro RG, Falls K, Simon J, Torrey D, et al (2002) Association of the ADAM33 gene with asthma and bronchial hyperresponsiveness. Nature 418:426–430 10.1038/nature00878 [DOI] [PubMed] [Google Scholar]
- Wechsler ME, Grasemann H, Deykin A, Silverman EK, Yandava CN, Israel E, Wand M, Drazen JM (2000) Exhaled nitric oxide in patients with asthma: association with NOS1 genotype. Am J Respir Crit Care Med 162:2043–2047 [DOI] [PubMed] [Google Scholar]
- Whitfield JB, Cullen LM, Jazwinska EC, Powell LW, Heath AC, Zhu G, Duffy DL, Martin NG (2000) Effects of HFE C282Y and H63D polymorphisms and polygenic background on iron stores in a large community sample of twins. Am J Hum Genet 66:1246–1258 [DOI] [PMC free article] [PubMed] [Google Scholar]
- Whittemore AS, Halpern J (1994) A class of tests for linkage using affected pedigree members. Biometrics 50:118–127 [PubMed] [Google Scholar]
- Williams JT, Begleiter H, Porjesz B, Edenberg HJ, Foroud T, Reich T, Goate A, Van Eerdewegh P, Almasy L, Blangero J (1999a) Joint multipoint linkage analysis of multivariate qualitative and quantitative traits. II. Alcoholism and event-related potentials. Am J Hum Genet 65:1148–1160 [DOI] [PMC free article] [PubMed] [Google Scholar]
- Williams JT, Van Eerdewegh P, Almasy L, Blangero J (1999b) Joint multipoint linkage analysis of multivariate qualitative and quantitative traits. I. Likelihood formulation and simulation results. Am J Hum Genet 65:1134–1147 [DOI] [PMC free article] [PubMed] [Google Scholar]
- Wjst M, Fischer G, Immervoll T, Jung M, Saar K, Rueschendorf F, Reis A, et al, for German Asthma Genetics Group (1999) A genome-wide search for linkage to asthma. Genomics 58:1–8 10.1006/geno.1999.5806 [DOI] [PubMed] [Google Scholar]
- Xu J, Meyers DA, Ober C, Blumenthal MN, Mellen B, Barnes KC, King RA, Lester LA, Howard TD, Solway J, Langefeld CD, Beaty TH, Rich SS, Bleecker ER, Cox NJ (2001a) Genomewide screen and identification of gene-gene interactions for asthma-susceptibility loci in three U.S. populations: collaborative study on the genetics of asthma. Am J Hum Genet 68:1437–1446 [DOI] [PMC free article] [PubMed] [Google Scholar]
- Xu J, Postma DS, Howard TD, Koppelman GH, Zheng SL, Stine OC, Bleecker ER, Meyers DA (2000) Major genes regulating total serum immunoglobulin E levels in families with asthma. Am J Hum Genet 67:1163–1173 [DOI] [PMC free article] [PubMed] [Google Scholar]
- Xu X, Fang Z, Wang B, Chen C, Guang W, Jin Y, Yang J, Lewitzky S, Aelony A, Parker A, Meyer J, Weiss ST (2001b) A genomewide search for quantitative-trait loci underlying asthma. Am J Hum Genet 69:1271–1277 [DOI] [PMC free article] [PubMed] [Google Scholar]
- Yokouchi Y, Nukaga Y, Shibasaki M, Noguchi E, Kimura K, Ito S, Nishihara M, Yamakawa-Kobayashi K, Takeda K, Imoto N, Ichikawa K, Matsui A, Hamaguchi H, Arinami T (2000) Significant evidence for linkage of mite-sensitive childhood asthma to chromosome 5q31-q33 near the interleukin 12 B locus by a genome-wide search in Japanese families. Genomics 66:152–160 10.1006/geno.2000.6201 [DOI] [PubMed] [Google Scholar]
- Yokouchi Y, Shibasaki M, Noguchi E, Nakayama J, Ohtsuki T, Kamioka M, Yamakawa-Kobayashi K, Ito S, Takeda K, Ichikawa K, Nukaga Y, Matsui A, Hamaguchi H, Arinami T (2002) A genome-wide linkage analysis of orchard grass-sensitive childhood seasonal allergic rhinitis in Japanese families. Genes Immun 3:9–13 10.1038/sj.gene.6363815 [DOI] [PubMed] [Google Scholar]
- Zhang Y, Leaves NI, Anderson GG, Ponting CP, Broxholme J, Holt R, Edser P, Bhattacharyya S, Dunham A, Adcock IM, Pulleyn L, Barnes PJ, Harper JI, Abecasis G, Cardon L, White M, Burton J, Matthews L, Mott R, Ross M, Cox R, Moffatt MF, Cookson WO (2003) Positional cloning of a quantitative trait locus on chromosome 13q14 that influences immunoglobulin E levels and asthma. Nat Genet 34:181–186 [DOI] [PubMed] [Google Scholar]