Abstract
We present the findings of a large linkage study of bipolar affective disorder (BPAD) that involved genomewide analysis of 52 families (448 genotyped individuals) of Spanish, Romany, and Bulgarian descent and further fine mapping of the 1p34-p36, 4q28-q31, and 6q15-q24 regions. An additional sample of 56 German families (280 individuals) was included for this fine-mapping step. The highest nonparametric linkage scores obtained in the fine mapping were 5.49 for 4q31 and 4.87 for 6q24 in the Romany families and 3.97 for 1p35-p36 in the Spanish sample. MOD-score (LOD scores maximized over genetic model parameters) analysis provided significant evidence of linkage to 4q31 and at least borderline significance for the 1p and 6q regions. On the basis of these results and previous positive research findings, 4q31 and 6q24 should now be considered confirmed BPAD susceptibility loci, and 1p35-p36 is proposed as a new putative locus that requires confirmation in replication studies.
Bipolar affective disorder (BPAD [MIM 125480]) is a major psychiatric disorder characterized by episodes of mania and depression. It affects 0.5%–1.5% of the world population and constitutes a major public health problem, with significant morbidity and mortality (World Health Organization 2002). Family, twin, and adoption studies have provided strong evidence of a major genetic contribution to the etiology of BPAD (Craddock and Jones 1999). The pattern of inheritance is complex, suggesting the involvement of both multiple genes and environmental factors. Although linkage analysis of BPAD has been an unsurprisingly challenging endeavor (Schulze and McMahon 2003), some genomic regions have gained consistent support from different studies and are therefore likely to contain BPAD susceptibility loci (Badner and Gershon 2002; Segurado et al. 2003).
Here, we present new data from a genomewide linkage analysis and subsequent fine-mapping analysis conducted in one of the largest collections of BPAD-affected families to date. The genome scan was performed on 52 families (Spanish, Bulgarian, and Romany, the latter recruited in Bulgaria) consisting of 448 subjects, of whom 260 were affected (according to the broad phenotype definition, ASDIII [described below]). An additional sample of 56 German families with 280 members (117 affected) for which a previously completed genome scan produced overlapping results (Cichon et al. 2001) was included for the fine-mapping stage. The characteristics of these families are summarized in table 1. Informed consent was obtained from all participating subjects. The study complies with all ethical guidelines of the institutions involved.
Table 1.
Overview of the Samples Studied in the Genomewide Scan and Fine-Mapping Linkage Analysis[Note]
|
No. of Affected/Mean No. Affected per Family |
|||||
| Sample | No. of Families | No. of Family Members | ASDI | ASDII | ASDIII |
| Spanish | 42a | 357 | 103/2.4 | 144/3.4 | 209/5 |
| Bulgarian | 7a | 32 | 14/2 | 15/2.1 | 16/2.3 |
| Romany | 3a | 59 | 13/4.3 | 17/5.7 | 35/11.7 |
| German | 56b | 280 | 92/1.6 | 101/1.8 | 117/2.1 |
| All: | |||||
| Genomewide scan | 52 | 448 | 130/2.5 | 176/3.4 | 260/5 |
| Fine-mapping linkage analysis | 108 | 728 | 222/2 | 277/2.6 | 377/3.5 |
Note.— ASDI includes BPI; ASDII includes BPI, BPII, or SA/BP; ASDIII includes BPI, BPII, SA/BP, or UPR.
Determined by genomewide scan and fine-mapping linkage analysis.
Determined by fine-mapping linkage analysis.
Phenotype evaluation (Fangerau et al. 2004) was based on DSM-IV criteria (American Psychiatric Association 1994). The inclusion criteria for BPAD-affected families were the presence of (1) a proband with bipolar I disorder (BPI) and (2) a secondary affected sibling with either BPI, bipolar II (BPII), schizoaffective disorder bipolar type (SA/BP), or unipolar recurrent depression (UPR). All individuals were interviewed by an experienced psychiatrist. The Schedule for Affective Disorders and Schizophrenia–Lifetime Version (SADS-L) (Endicott and Spitzer 1978) was used for the German and Spanish families. The Schedules for Clinical Assessment in Neuropsychiatry (Wing et al. 1990) was used for the Bulgarian and Romany families. The affected status definitions (ASD) used in the linkage analysis were as follows: ASDI (narrow) includes individuals with BPI only, with all other psychiatric diagnoses coded as “unknown”; ASDII (medium) includes all individuals who received a diagnosis of BPI, BPII, or SA/BP; and ASDIII (broad) also includes individuals with UPR.
The genome scan was conducted at the Gene Mapping Center in Berlin, with use of procedures described by Lee et al. (2000). The 448 DNA samples were genotyped for 435 STRs, with an average intermarker distance of 8.3 cM (range 0–25.4 cM) (deCODE Genetics). An average heterozygosity of 0.77 was observed.
Nonparametric linkage (NPL) analysis of the genome scan data was performed using the current version of GENEHUNTER, version 2.1 release 5 (Kruglyak et al. 1996; Kruglyak and Lander 1998; Markianos et al. 2001). Marker-allele frequencies were estimated for all samples by a maximum-likelihood procedure with use of the program MENDEL (version 5.5). Identical-by-descent allele sharing among all affected family members was calculated for the narrow, medium, and broad affection–status definition with use of the GENEHUNTER score function SALL.
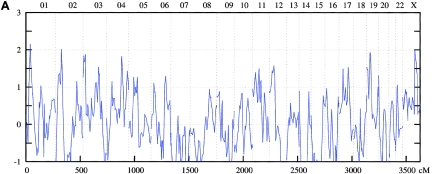
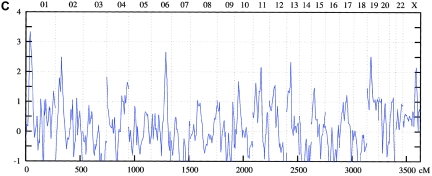
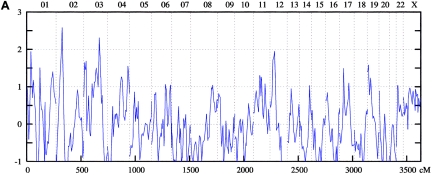
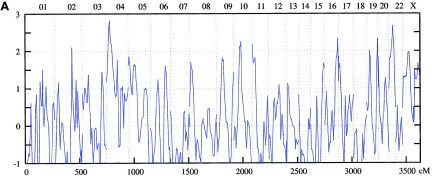
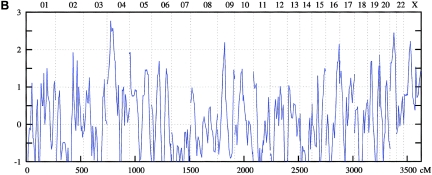
The genomewide linkage analysis (see detailed results in table 2 and figs. 1–4) produced nominal evidence of linkage (P<.05) to 17 chromosomal regions: 1p34-p36, 2p16-p25, 3p25, 4p16, 4q25-q31, 4q35, 6q21-q24, 10p13, 11p15, 11p13-q13, 12p11-p13, 13q12-q13, 15q14, 15q26, 17p12, 19p12-p13, and Xq23-q25. Strongest support was obtained for the 1p34-p36, 4q25-q31, and 6q21-q24 regions.
Table 2.
Genomewide Scan: Multipoint NPL Analysis (Nominal P<.05) of the Entire Linkage Sample and Each Subsample[Note]
| Sample and Chromosomal Region | Genomic Linkage Intervala(cM) | Position(cM) | NPL Score | Pb | Phenotypec |
| All: | |||||
| 1p34-p36 | 25.9–64.1 | 38.9 | 3.34 | .002 | ASDIII |
| 2p16-p25 | 30.5–70.1 | 57.0 | 2.49 | .007 | ASDIII |
| 3p25 | 15.9–23.9 | 21.2 | 2.07 | .022 | ASDII |
| 4p16 | .0–6.6 | .0 | 1.83 | .023 | ASDIII |
| 4q25-q31 | 110.3–148.3 | 138.7 | 2.89 | .004 | ASDII |
| 4q35 | 185.3–194.0 | 188.0 | 1.76 | .041 | ASDII |
| 6q21-q24 | 120.0–147.3 | 134.2 | 2.66 | .005 | ASDIII |
| 10p13 | 34.5–44.9 | 38.2 | 1.68 | .030 | ASDIII |
| 11p15 | 20.4–32.9 | 25.6 | 1.64 | .032 | ASDIII |
| 11p13-q13 | 49.9–81.7 | 76.8 | 2.53 | .008 | ASDII |
| 12p11-p13 | 16.9–51.6 | 38.9 | 2.04 | .024 | ASDII |
| 13q12-q13 | 10.4–41.7 | 35.5 | 2.34 | .010 | ASDIII |
| 15q14 | 21.4–26.1 | 28.4 | 1.48 | .042 | ASDIII |
| 15q26 | 109.5–112.2 | 110.7 | 1.75 | .042 | ASDII |
| 17p12 | 34.6–37.2 | 35.6 | 1.75 | .042 | ASDII |
| 19p12-p13 | .0–43.8 | 29.6 | 2.58 | .007 | ASDII |
| Xq23-q25 | 109.5–128.4 | 111.2 | 1.99 | .017 | ASDI |
| Spanish: | |||||
| 1p34-p36 | 27.6–66.2 | 37.7 | 3.36 | .002 | ASDIII |
| 2p16-p25 | 30.5–68.5 | 57.0 | 2.65 | .006 | ASDIII |
| 3p25 | 15.9–23.9 | 21.2 | 2.12 | .020 | ASDII |
| 3q21-q24 | 129.2–151.1 | 143.2 | 2.33 | .013 | ASDII |
| 4p16 | .0–4.4 | .0 | 1.68 | .031 | ASDIII |
| 4q25-q31 | 108.3–143.5 | 136.5 | 2.75 | .005 | ASDII |
| 4q35 | 180.1–203.1 | 188.0 | 2.25 | .015 | ASDII |
| 6q23 | 120.0–138.5 | 125.4 | 2.25 | .015 | ASDII |
| 10p12-p14 | 30.7–49.5 | 38.2 | 1.98 | .019 | ASDIII |
| 11p12-q13 | 54.6–81.7 | 76.8 | 2.75 | .005 | ASDII |
| 12p11-p13 | 16.9–51.6 | 42.0 | 2.57 | .008 | ASDII |
| 13q12-q13 | 24.2–41.7 | 35.5 | 2.79 | .004 | ASDIII |
| 17q12 | 66.7–70.4 | 68.5 | 1.40 | .048 | ASDIII |
| 19p12-p13 | .0–46.7 | 35.1 | 1.96 | .019 | ASDIII |
| 19q13 | 62.8–80.4 | 73.5 | 1.68 | .030 | ASDIII |
| 22q11 | 14.5–18.6 | 15.8 | 1.69 | .048 | ASDII |
| Xq24 | 119.2–123.6 | 121.2 | 1.71 | .049 | ASDIII |
| Romany: | |||||
| 1p36 | 22.6–41.5 | 27.6 | 2.28 | .025 | ASDI |
| 1q31 | 181.6–185.4 | 184.0 | 2.09 | .031 | ASDIII |
| 2p14-p22 | 55.3–91.1 | 87.5 | 2.53 | .018 | ASDIII |
| 2q37 | 233.3–250.0 | 242.0 | 2.78 | .012 | ASDI |
| 3p13 | 78.7–84.3 | 80.5 | 1.81 | .044 | ASDIII |
| 4q31 | 145.9–152.8 | 150.8 | 1.94 | .040 | ASDII |
| 6p22 | 35.0–39.6 | 37.1 | 1.97 | .036 | ASDIII |
| 6q23-q24 | 138.5–152.0 | 145.0 | 3.65 | .010 | ASDIII |
| 8p11-q21 | 62.5–102.6 | 66.9 | 2.48 | .019 | ASDIII |
| 9p24 | 19.3–29.3 | 24.3 | 2.65 | .016 | ASDIII |
| 10q23 | 114.4–117.9 | 115.7 | 1.84 | .046 | ASDI |
| 11p12-p13 | 47.8–58.8 | 50.6 | 2.47 | .019 | ASDI |
| 12p13 | .0–22.2 | .0 | 2.23 | .026 | ASDII |
| 13q31 | 62.2–85.3 | 71.9 | 2.90 | .010 | ASDII |
| 15q14 | 26.8–32.5 | 28.4 | 1.95 | .037 | ASDIII |
| 17p12-q12 | 32.6–61.3 | 44.4 | 2.52 | .026 | ASDII |
| 18q12 | 54.4–64.6 | 59.4 | 3.17 | .008 | ASDI |
| 19q13 | 78.7–108.5 | 82.2 | 2.14 | .030 | ASDI |
| 20p12 | 21.9–26.5 | 24.8 | 1.84 | .043 | ASDIII |
| Xq24-q25 | 113.2–123.6 | 121.2 | 2.52 | .024 | ASDIII |
| Bulgarian: | |||||
| 1q31-q41 | 188.2–194.5 | 191.0 | 1.95 | .030 | ASDIII |
| 2q21-q33 | 157.2–201.8 | 160.3 | 2.35 | .008 | ASDIII |
| 4p15-p16 | 13.9–61.2 | 32.9 | 2.83 | .001 | ASDI |
| 4q22 | 101.4–104.3 | 102.4 | 1.78 | .042 | ASDI |
| 5p15 | .0–10.8 | 9.2 | 1.93 | .022 | ASDII |
| 6p12 | 67.2–70.8 | 69.3 | 1.69 | .043 | ASDII |
| 6q23-q24 | 130.6–147.3 | 134.2 | 1.89 | .030 | ASDIII |
| 8p23 | 8.9–13.4 | 11.1 | 1.71 | .042 | ASDI |
| 9p21-q21 | 54.5–69.9 | 67.0 | 2.19 | .015 | ASDII |
| 10p11-q21 | 49.5–71.4 | 66.8 | 2.26 | .012 | ASDI |
| 11p15 | .0–29.2 | .0 | 2.18 | .012 | ASDI |
| 15q26 | 116.8–120.2 | 118.3 | 1.68 | .042 | ASDI |
| 16q24 | 102.5–128.9 | 121.4 | 2.35 | .009 | ASDI |
| 17p13 | 7.8–12.5 | 9.7 | 1.67 | .042 | ASDI |
| 19p13 | 24.3–38.0 | 28.3 | 2.02 | .023 | ASDI |
| 19q13 | 88.9–106.2 | 102.8 | 2.35 | .009 | ASDI |
| 20p13 | .0–6.4 | .0 | 2.10 | .020 | ASDIII |
| 21q21-q22 | 6.7–52.9 | 36.9 | 2.69 | .003 | ASDI |
| Xp11-p21 | 44.7–72.8 | 59.3 | 2.23 | .016 | ASDII |
| Xq23-q27 | 110.3–156.1 | 141.7 | 1.68 | .031 | ASDI |
Note.— Positions were determined from the deCODE Genetics sex-averaged map.
Genomic linkage interval with P values <.05.
Nominal P value.
ASDI includes BPI; ASDII includes BPI, BPII, or SA/BP; ASDIII includes BPI, BPII, SA/BP, or UPR.
Figure 1.
Genomewide scan: multipoint NPL analysis of ASDI (A), ASDII (B), and ASDIII (C), across all chromosomes in the entire linkage sample.
Figure 2.
Genomewide scan: multipoint NPL analysis of ASDI (A), ASDII (B), and ASDIII (C), across all chromosomes in the Spanish linkage sample.
Figure 3.
Genomewide scan: multipoint NPL analysis of ASDI (A), ASDII (B), and ASDIII (C), across all chromosomes in the Romany linkage sample.
Figure 4.
Genomewide scan: multipoint NPL analysis of ASDI (A), ASDII (B), and ASDIII (C), across all chromosomes in the Bulgarian linkage sample.
On chromosome 1p34-p36, the maximum NPL score for the combined sample was 3.34 at 38.9 cM under the broad phenotype (ASDIII) definition. Nominally significant results were obtained in the Spanish (ASDIII: NPL=3.36 at 37.78 cM) and the Romany (ASDI: NPL=2.28 at 27.6 cM) samples. For 4q25-q31, for the entire sample, an NPL score of 2.89 was found at 138.7 cM for ASDII. Nominally significant results were obtained for the Spanish (ASDII: NPL=2.75 at 136.5 cM) and the Romany (ASDII: NPL=1.94 at 150.8 cM) families. In the 6q21-q24 region, the maximum NPL score for the combined sample was 2.66 at 134.2 cM for ASDIII. The breakdown showed nominally significant results in all subsamples: Romany (ASDIII: NPL=3.65 at 145.0 cM), Spanish (ASDII: NPL=2.25 at 125.4 cM), and Bulgarian (ASDIII: NPL=1.89 at 134.2 cM).
Fine-mapping analysis of these three regions was performed for those family subsets demonstrating the strongest evidence of linkage: Spanish, Romany, and Bulgarian for chromosome 1p; Romany, Bulgarian, and German (Cichon et al. 2001) for chromosome 4q; and Spanish, Romany, Bulgarian, and German for chromosome 6q. The genotyping was performed by deCODE Genetics, with use of procedures described elsewhere (Björnsson et al. 2003). A total of 91 additional STR markers were analyzed, distributed by regions as follows: chromosome 1p34-p36, interval D1S2672–D1S2741 (27.8–86.1 cM), 27 STRs, average intermarker distance 2.1 cM; chromosome 4q28-q31, interval D4S1615–D4S2982 (129.7 cM–157.5 cM), 13 STRs, average intermarker distance 2.1 cM; chromosome 6q15-q24, interval D6S1570–D6S1633 (101.5–170.2 cM), 51 STRs, average intermarker distance 1.3 cM. To determine the inferential validity of the maximum NPL scores that were obtained using the fine-mapping data and the program GENEHUNTER, we performed systematic simulations under the null hypothesis of no linkage. Because of insufficient computation time, we generated either 500 or 1,000 replicates, depending on the magnitude of the observed NPL score. The replicates were generated using MERLIN, version 0.10.2 (Abecasis et al. 2002). Each replicate was generated under the assumption of random segregation, with use of identical pedigree structure, affection status, marker spacing, allele frequencies, and patterns of the missing data in the real data set. Each replicate was analyzed, using MERLIN, in the same way as was the original data set, with computation of the Zmean score, which is equivalent to the NPL score in GENEHUNTER. The empirical P value was calculated as the portion of all replicates showing an NPL score equal to or higher than the one observed in the real data set.
In parametric linkage analysis, the trait model must be specified prior to analysis. This is a disadvantage when the true disease model parameters are unknown, since the power to detect linkage decreases when the specified model is not sufficiently close to the true mode of inheritance (Clerget-Darpoux et al. 1986). Therefore, in addition to the NPL analyses, we performed multipoint LOD scores maximized over genetic model parameters (MOD)–score analyses in the fine-mapping linkage study, and we maximized parametric LOD scores with respect to the disease-model parameters. We used the new program GENEHUNTER-MODSCORE (Strauch 2003), which calculates MOD scores by automatically varying the disease-allele frequency and three penetrances. The program is a further development of GENEHUNTER-IMPRINTING (Strauch et al. 2000), which is based on the original GENEHUNTER, version 2.1 (Kruglyak et al. 1996; Kruglyak and Lander 1998; Markianos et al. 2001). We used the “modcalc single” option, under which GENEHUNTER-MODSCORE performs a separate maximization for each genetic position assumed for the putative disease locus. This procedure yields the MOD score in conjunction with the best-fitting penetrance and disease-allele frequency at each genetic position of a prespecified grid. The parameters can be considered an effect estimate for the particular locus. Given the nature of our large data set and its many extended pedigrees, a further reduction in the number of chromosomal regions to be analyzed was necessary for reasons of acceptable computation time. The intervals analyzed in this manner were D1S2672–D1S1598 (27.82–65.0 cM) on 1p; D4S1527–D4S2982 (134.67–157.54 cM) on 4q, and D6S270–D6S1633 (138.78–170.24 cM) on chromosome 6q. For all regions and disease definitions, the analyses were run for the pooled set of populations.
Detailed results of fine mapping for both the combined sample and for the subsamples (Spanish, Romany, Bulgarian, and German) are presented in table 3.
Table 3.
Fine-Mapping Linkage Analysis: Multipoint NPL Analysis in the Fine-Mapping Linkage Sample (108 Families) and Each Subsample[Note]
|
NPL (Empirical Pb) |
||||
| Chromosome Regionand Sample | Positiona(cM) | ASDI | ASDII | ASDIII |
| 1p35-p36: | ||||
| Fine-mapping sample | 45.97 | 1.93 (.128) | 2.65 (.020) | 3.69 (.003)c |
| Spanish subsample | 45.97 | 1.44 (.294) | 2.06 (.116) | 3.97 (.005)c |
| Romany subsample | 45.97 | 3.21 (.034) | 2.70 (.064) | 1.78 (.184) |
| Bulgarian subsample | 45.97 | 1.26 (.418) | 1.26 (.416) | … |
| 4q31: | ||||
| Fine-mapping sample | 151.16 | 2.85 (.010) | 3.18 (.004)c | 2.36 (.016) |
| Romany subsample | 148.44 | 3.52 (.014) | 3.34 (.016) | 5.49 (.015)c |
| German subsample | 151.16 | 2.15 (.038) | 2.58 (.012) | 1.61 (.244) |
| Bulgarian subsample | 151.16 | 1.29 (.258) | 1.28 (.244) | … |
| 6q16: | ||||
| Fine-mapping sample | 112.06 | … | 1.42 (.358) | 1.24 (.468) |
| German subsample | 112.06 | 2.42 (.058) | 2.55 (.052) | 2.15 (.104) |
| 6q23: | ||||
| Fine-mapping sample | 135.15 | 1.75 (.246) | 2.85 (.022) | 2.59 (.054) |
| Bulgarian subsample | 136.08 | 2.69 (.026) | 2.69 (.026) | 2.42 (.044) |
| Spanish subsample | 135.15 | … | 2.08 (.150) | … |
| 6q24: | ||||
| Fine-mapping sample | 147.68 | 2.27 (.096) | 3.18 (.008) | 2.53 (.060) |
| Romany subsample: peak I | 147.75 | 2.99 (.058) | 3.21 (.040) | 3.46 (.071)c |
| Romany subsample: peak II | 152.00 | 2.52 (.096) | 2.69 (.062) | 4.87 (.044)c |
| German subsample | 147.75 | 1.23 (.470) | 1.76 (.230) | … |
| Bulgarian subsample | 147.68 | 1.43 (.430) | 1.43 (.444) | 1.85 (.044) |
Note.— ASDI includes BPI; ASDII includes BPI, BPII, or SA/BP; ASDIII includes BPI, BPII, SA/BP, or UPR.
Determined from the deCODE Genetics sex-averaged map.
Empirical P value based on 500 simulations unless otherwise noted.
Empirical P values are based on 1,000 simulations.
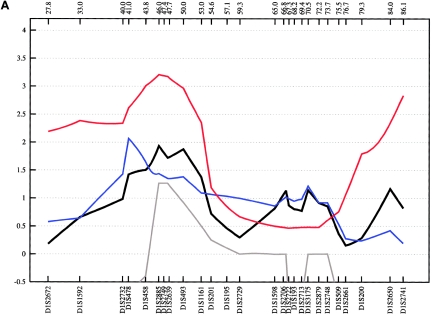
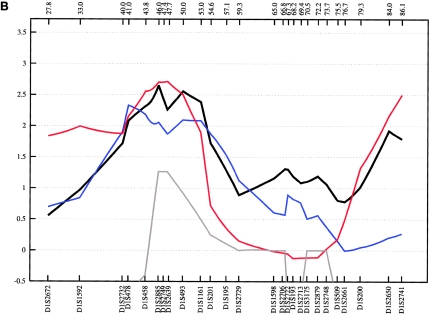
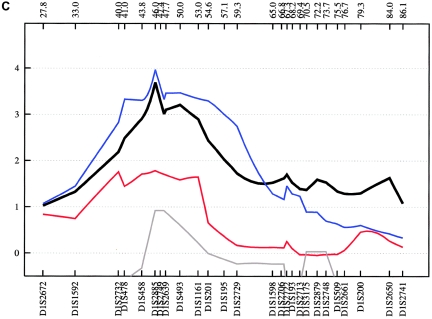
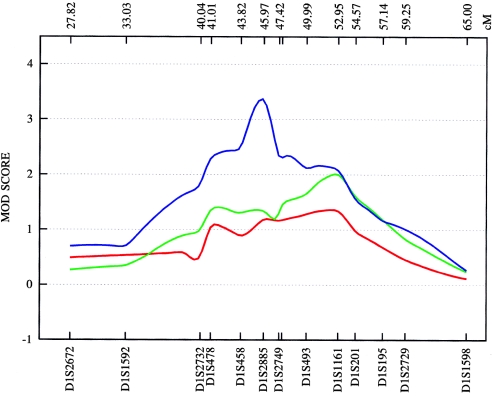
On chromosome 1p34-p36, we genotyped 27 additional STR markers, which covered a region of 58.3 cM. In the combined sample, an NPL score of 3.69 (empirical P=.003) was obtained at 45.9 cM for ASDIII. The best subsample score was observed in the Spanish families (ASDIII: NPL=3.97 at 45.9 cM; empirical P=.005) (see fig. 5). The highest MOD score value, 3.40, was obtained in the combined sample at 45.9 cM for ASDIII and a near-dominant mode of inheritance (fig. 6). The data suggest that the susceptibility allele at this locus has a high frequency (16%) and incomplete penetrance (53%). The results for ASDI and ASDII were weaker, with MOD scores of 2.02 and of 1.36, respectively (fig. 6). The linkage region defined by the NPL and MOD-score analyses is well circumscribed and covers <5 cM between markers D1S478 and D1S493 on chromosome 1p35-p36. This region has not been proposed previously as a BPAD locus. However, review of published data shows that Curtis et al. (2003) observed a LOD score of 3.10 at D1S432 in one large pedigree with BPAD. This marker is not, however, listed by the deCODE Genetics map. According to National Center for Biotechnology Information (NCBI) Build 35, D1S432 is located <9 Mb centromeric of the linkage region implicated by our study. In addition, ∼23 cM more telomeric, at marker D1S1597 (23.2 cM), Zubenko et al. (2003) obtained a multipoint LOD score of 3.60 in a sample of 81 families with UPR. The fact that the most significant P value in our study was obtained with use of a phenotype definition that includes UPR may suggest the existence of a susceptibility locus on chromosome 1p35-p36 that contributes to a broad spectrum of affective disorders. According to the University of California–Santa Cruz (UCSC) RefSeq Genes track (UCSC Genome Bioinformatics), which assembles all known protein-coding genes taken from the NCBI mRNA reference sequences collection (RefSeq), the genomic interval on chromosome 1p identified by our fine-mapping analysis contains 129 genes.
Figure 5.
Fine-mapping linkage analysis: chromosomal 1p34-p36 multipoint NPL results in the fine-mapping sample (black) and in the Spanish (blue), Romany (red), and Bulgarian (gray) subsamples of ASDI (A), ASDII (B), and ASDIII (C). Distances on the X-axis are in centimorgans and are determined from the deCODE Genetics sex-averaged map.
Figure 6.
Plot of the MOD score for chromosome 1p35-p36, with a separate maximization over trait-model parameters for each genetic position assumed for the trait locus. ASDI (red) position of the maximum MOD score: 52.34 cM; penetrances {0.00; 0.49; 0.49}; disease-allele frequency 0.050. ASDII (green) position of the maximum MOD score: 52.63 cM; penetrances {0.00; 0.50; 0.50}; disease-allele frequency 0.040. ASDIII (blue) position of the maximum MOD score: 45.95 cM; penetrances {0.00; 0.53; 0.53}; disease-allele frequency 0.160. MOD scores are determined from the deCODE Genetics sex-averaged map. The penetrance of the disease models is obtained by MOD-score analysis and given in order {f+/+; fm/+; fm/m}. A plus sign (+) indicates the wild-type allele; “m” indicates the mutant allele.
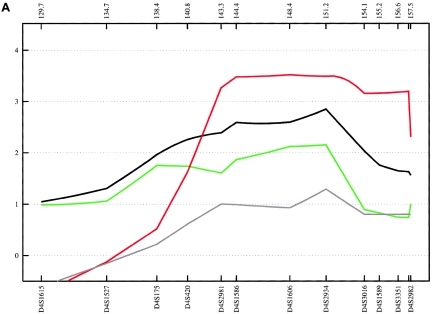
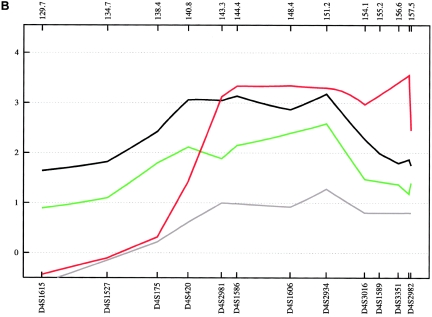
On chromosome 4q28-q31, we analyzed 13 additional STR markers between D4S1615 (129.7 cM) and D4S2982 (157.5 cM). In the entire fine-mapping sample, we obtained evidence of linkage at 151.1 cM, with an NPL score of 3.18 (empirical P=.004) for ASDII (table 3 and fig. 7). The strongest evidence was produced by the Romany subsample (ASDIII: NPL=5.49 at 148.4 cM; empirical P=.015). Also, the German subsample contributed to the chromosome 4 finding (ASDII: NPL=2.58 at 151.1 cM; empirical P=.012). In the MOD-score analysis of the combined sample—including the Romany, German, and Bulgarian families—a MOD score of 4.24 was obtained at 147.2 cM for ASDII, with a disease-allele frequency of 4.5% and a near-additive mode of inheritance (fig. 8). Application of the two other phenotype definitions supported this region, with a MOD score of 3.22 at 147.6 cM for ASDI and of 2.76 for ASDIII (fig. 8). Our findings confirm the findings of genomewide analyses of other investigators. Using a dominant model of inheritance and a broad diagnostic definition, Ekholm et al. (2003) observed a 3-point LOD score of 3.60 at 152 cM (at marker D4S1629) in a sample of 41 BPAD-affected families from an isolated Finnish population. In another genomewide scan of 65 American families of European descent with BPAD, an NPL of 2.80 and a LOD score of 1.9 were reported, again at 152 cM (marker D4S1629) under a broad phenotype model (McInnis et al. 2003). A genomewide study of 40 pedigrees with BPAD from the United States and Israel obtained a 2-point LOD score of 3.16 under a dominant model and broad phenotype definition, with a maximum at 140 cM (marker D4S1625) (Liu et al. 2003). The peak identified in our fine-mapping NPL and MOD-score analysis spans ∼10 cM and is situated precisely in the D4S1625–D4S1629 interval supported by the above-mentioned genomewide analyses. The UCSC RefSeq Genes track (UCSC Genome Bioinformatics) lists 58 protein-coding genes as present in this genomic linkage interval on chromosome 4q.
Figure 7.
Fine-mapping linkage analysis: chromosomal 4q28-4q31 multipoint NPL results in the fine-mapping sample (black) and in the German (green), Romany (red), and Bulgarian (gray) subsamples of ASDI (A), ASDII (B), and ASDIII (C). Distances on the X-axis are in centimorgans and are determined from the deCODE Genetics sex-averaged map.
Figure 8.
Plot of the MOD score for chromosome 4q31, with a separate maximization over trait-model parameters for each genetic position assumed for the trait locus. ASDI (red) position of the maximum MOD score: 147.64 cM; penetrances {0.00; 0.30; 0.92}; disease-allele frequency 0.025. ASDII (green) position of the maximum MOD score: 147.23 cM; penetrances {0.00; 0.33; 0.99}; disease-allele frequency 0.045. ASDIII (blue) position of the maximum MOD score: 148.44 cM; penetrances {0.00; 0.49; 0.96}; disease-allele frequency 0.040. MOD scores are determined from the deCODE Genetics sex-averaged map. The penetrance of the disease models is obtained by MOD-score analysis and given in order {f+/+; fm/+; fm/m}. A plus sign (+) indicates the wild-type allele; “m” indicates the mutant allele.
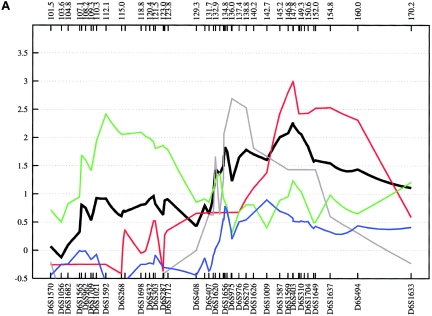
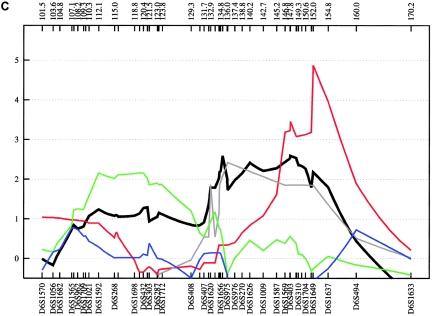
Fine mapping of the 6q15-q24 region, flanked by D6S1570 (101.5 cM) and D6S1633 (170.2 cM), was performed with 51 additional STRs. This large region is of particular interest, since several previous studies have reported “suggestive” and “significant” evidence of linkage to BPAD. Rather than narrowing the region, the fine-mapping analysis led to the identification of three well-defined positive areas in each subsample, all of which have been reported elsewhere for BPAD—namely, 6q16, 6q23, and 6q24 (see fig. 9).
Figure 9.
Fine-mapping linkage analysis: chromosomal 6q15-q24 multipoint NPL results in the fine-mapping sample (black) and in the German (green), Romany (red), Spanish (blue), and Bulgarian (gray) subsamples of ASDI (A), ASDII (B), and ASDIII (C). Distances on the X-axis are in centimorgans and are determined from the deCODE Genetics sex-averaged map.
Evidence supporting 6q16 was obtained mainly from the German subsample, with an NPL score of 2.55 (empirical P=.052) at 112.0 cM for ASDII (table 3). Although, our results for 6q16 are not strong in terms of empirical P values, involvement of this region is supported by findings from independent linkage studies. The large National Institute of Mental Health study, which included a sample of 250 families, reported a LOD score of 2.26 at D6S1021 (107 cM), with use of a broad disease definition (Dick et al. 2003; Schulze et al. 2004). At the same marker, Ewald et al. (2002) found a LOD score of 2.59 in two multiplex BPAD-affected families from Denmark with a narrow phenotype definition, and Pato et al. (2004) observed an NPL score of 2.59 in 16 Portuguese BPAD-affected families.
We also obtained evidence of linkage to 6q23 (full fine-mapping sample for ASDII: NPL=2.85 at 135.1 cM; empirical P=.022 [table 3]), a region that was implicated in the Danish BPAD study (Ewald et al. 2002), with a 2-point LOD score of 2.49 at D6S1009 (139 cM) with a narrow disease definition. At the same marker, Rice et al. (1997) found a 2-point LOD score of 2.08 in 97 American families of European descent. In the latter study, all markers on 6q between 112 cM and 155 cM yielded positive LOD scores for a broad affected-status model. Furthermore, this region was implicated by the genomewide study of Middleton et al. (2004), in which they investigated 25 multiplex BPAD-affected families of Portuguese origin, using the GeneChip Human Mapping 10K Array (HMA10K). They observed an NPL score of 4.20 at 125.8 Mb, which is located ∼6 Mb centromeric of our strongest linkage finding within this chromosomal region.
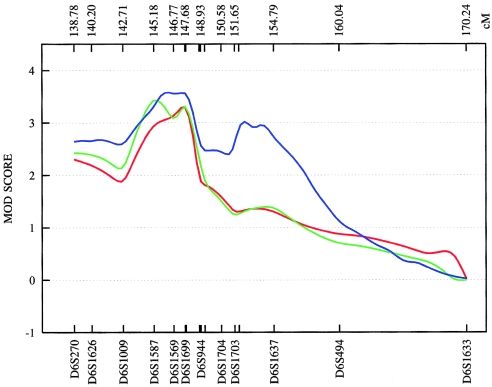
The third linkage region, 6q24, was supported by the combined sample, which produced an NPL of 3.18 (empirical P=.008) at 147.68 cM for ASDII. The Romany subsample produced the second-highest NPL score observed in our study (ASDIII: NPL=4.87 at 152.0 cM; empirical P=.044). Given computational constraints and because the 6q24 results were the best finding in this chromosomal region, MOD-score analysis was restricted to this particular locus only. In the combined sample, this analysis identified two peaks, at 146.1 and 152.5 cM, with MOD scores 3.59 and 3.10 for ASDIII (fig. 10). For both peaks, the best genetic model was nearly additive, with low disease-allele frequencies and low penetrance. Using the medium and narrow phenotype definitions, we obtained MOD scores of 3.46 at 145.2 cM (for ASDII) and of 3.32 at 147.6 cM (for ASDI) (fig. 10). Although previous support for this region has been modest (Rice et al. 1997; see above), strong evidence of a 6q24 BPAD susceptibility locus was provided recently by a genomewide linkage study of an isolated population in northern Sweden (Venken et al. 2005). The study identified a 29-cM region on 6q (133–162 cM), with a multipoint LOD score of 2.48. Follow-up fine mapping analysis, under a recessive, affected-only model, led to a 3-cM candidate region (144–147 cM) and a multipoint LOD score of 3.25 at 146 cM, which matches the peak identified by our MOD-score analysis for the narrow and medium phenotype definitions (fig. 10). Collectively, the data provide strong support for the existence of a BPAD susceptibility locus on 6q24, a chromosomal region with relatively sparse gene entries. According to the RefSeq Genes track (UCSC Genome Bioinformatics), the genomic interval analyzed by our MOD-score analysis contains 32 genes.
Figure 10.
Plot of the MOD score for chromosome 6q24, with a separate maximization over trait-model parameters for each genetic position assumed for the trait locus. ASDI (red) position of the maximum MOD score: 147.68 cM; penetrances {0.00; 0.50; 0.50}; disease-allele frequency 0.005. ASDII (green) position of the maximum MOD score: 145.18 cM; penetrances {0.00; 0.52; 0.52}; disease-allele frequency 0.010. ASDIII (blue) position of the maximum MOD score: 146.13 cM; penetrances {0.00; 0.11; 0.26}; disease-allele frequency 0.005. MOD scores are determined from the deCODE Genetics sex-averaged map. The penetrance of the disease models is obtained by MOD-score analysis and given in order {f+/+; fm/+; fm/m}. A plus sign (+) indicates the wild-type allele; “m” indicates the mutant allele.
The 108 affected families included in this study originate from four different European populations and represent one of the largest BPAD samples investigated to date. The fact that the extended Romany families produced the highest NPL scores, together with the findings of previous genome scans for BPAD in isolated populations, emphasizes the potential of such populations to facilitate gene identification in complex disorders. Although the number of susceptibility loci for BPAD in these isolated populations may not be substantially different from those of other populations, as suggested by our results and those of other studies (Fallin et al. 2004; Venken et al. 2005), isolated populations still offer advantages for genetic studies because of their limited diversity and presumed strong founder effects.
Our genomewide scan identified several genomic regions likely to contain BPAD-susceptibility loci, some of which overlap with and provide further support for previous findings. Our subsequent fine-mapping linkage analysis led to substantially better results in all of the investigated regions and shaped the linkage peaks (e.g., in the Romany subsample, the NPL scores increased from 2.28 to 3.21 for chromosome 1p, from 1.65 to 5.49 for 4q, and from 3.65 to 4.87 for 6q, whereas, in the Spanish subsample, the NPL scores for 1p increased from 3.36 to 3.97). In addition, we applied parametric multipoint MOD-score analysis to the fine-mapping linkage data. Since the power to detect linkage is reduced when the trait model specified for a parametric (LOD score) analysis is not close to the true underlying model (Clerget-Darpoux et al. 1986), MOD-score analysis is a promising strategy for analysis of linkage data for complex traits. Although applied only to those chromosomal regions identified by the preceding NPL analysis, this approach is clearly explorative and thus does not allow stringent control of type I error. In principle, P values of MOD scores can be obtained by performing simulations for the investigated data set under the null hypothesis of no linkage. For our BPAD-affected family sample, a substantial amount for computation time is already required for the MOD-score analysis of the original data set. Analysis of many replicates for each of the loci identified here would therefore not be feasible; we relied instead on the criteria of Weeks et al. (1990) and Hodge et al. (1997). By performing simulations, they have found that, for MOD scores, a critical LOD score of 3 should be adjusted by a value in the range of 0.3–1.0 to maintain a comparable type I error, with a conservative upper boundary. When applied to the results of our study, that means that we have obtained “significant” evidence of a susceptibility locus in the 4q region and at least “borderline significance” for the regions on chromosomes 1p and 6q.
On the basis of our findings in two independent family samples, we propose the 1p35-p36 locus as a new susceptibility locus for BPAD. Chromosomal regions 4q31 and 6q24 have already been implicated in previous studies and, in the light of our results, should now be considered to be true-positive findings. The present study is the first application of the newly developed GENEHUNTER-MODSCORE program to BPAD, which allows a more precise definition of linkage peaks and estimation of disease inheritance parameters. The different pattern of linkage findings observed in the comparison of the individual subsamples in our study is not surprising. This phenomenon is to be expected with a genetically complex disorder (Suarez et al. 1994), since factors such as the structure and size of the family samples, incomplete penetrance, and locus heterogeneity influence the linkage results and may lead to interstudy differences (Terwilliger et al. 1997). Thus, our results reflect and support the opinion that BPAD is caused by multiple genes, with presumed genetic heterogeneity and with different combinations of predisposing genes segregating in different families and populations. Some of these were found within those regions identified by our extensive fine-mapping NPL and MOD-score analyses. The next step will be systematic linkage disequilibrium mapping in these identified regions, followed by the application of positional cloning methods.
Acknowledgments
The authors are grateful to the patients and their families for their cooperation and blood samples. This study was supported by Deutsche Forschungsgemeinschaft grants SFB 400 and GRK 246 and by the National Genomic Network of the Bundesministerium für Bildung und Forschung (to P.P., T.F.W., and M.R.). The collection of families from Bulgaria was supported by the National Science Fund. The contribution of Dr. T. Milenska and the Mental Health Services in Kjustendil, Bulgaria, to the collection of Romany families is gratefully acknowledged. We thank Prof. Wolfgang Maier, Dr. Dirk Lichtermann, Dr. Jürgen Minges, Prof. Margot Albus, Dr. Margitta Borrmann-Hassenbach, Dr. Mario Lanczik, Prof. Ernst Franzek, Prof. Jürgen Fritze, Dr. Ulrike Reuner, Dr. Bettina Weigelt, and Dr. Roland Kreiner for their contribution to the collection of German families. M.M.N. received support for this work from the Alfried Krupp von Bohlen und Halbach-Stiftung. TGS was supported by a Young Investigator Award from the National Alliance for Research on Schizophrenia and Depression. R.K. was a research fellow of the Alexander von Humboldt Foundation. L.K. and A.J. acknowledge support from the Australian National Health and Medical Research Council. We thank Dr. Christine Schmael for help preparing the manuscript.
Web Resources
The URLs for data presented herein are as follows:
- deCODE Genetics, http://www.decode.com/ (for information about the genetic map)
- NCBI, http://www.ncbi.nih.gov/ (for BPAD)
- Online Mendelian Inheritance in Man (OMIM), http://www.ncbi.nlm.nih.gov/Omim/ (for BPAD) [PubMed]
- UCSC Genome Bioinformatics, http://genome.ucsc.edu/ (for marker positions and the RefSeq Genes track)
References
- Abecasis GR, Cherny SS, Cookson WO, Cardon LR (2002) Merlin—rapid analysis of dense genetic maps using sparse gene flow trees. Nat Genet 30:97–1001 10.1038/ng786 [DOI] [PubMed] [Google Scholar]
- American Psychiatric Association (1994) DSM-IV: diagnostic and statistical manual of mental disorders, 4th ed. American Psychiatric Association, Washington, DC [Google Scholar]
- Badner JA, Gershon ES (2002) Meta-analysis of whole-genome linkage scans of bipolar disorder and schizophrenia. Mol Psychiatry 7:405–411 10.1038/sj.mp.4001012 [DOI] [PubMed] [Google Scholar]
- Björnsson Á, Gudmundsson G, Gudfinnsson E, Hrafnsdóttir M, Benedikz J, Skúladóttir S, Kristjánsson K, Frigge ML, Kong A, Stefánsson K, Gulcher JR (2003) Localization of a gene for migraine without aura to chromosome 4q21. Am J Hum Genet 73:986–993 (erratum 76:715) [DOI] [PMC free article] [PubMed] [Google Scholar]
- Cichon S, Schumacher J, Müller DJ, Hürter M, Windemuth C, Strauch K, Hemmer S, et al (2001) A genome screen for genes predisposing to bipolar affective disorder detects a new susceptibility locus on 8q. Hum Mol Genet 25:2933–2944 10.1093/hmg/10.25.2933 [DOI] [PubMed] [Google Scholar]
- Clerget-Darpoux F, Bonaiti-Pellie C, Hochez J (1986) Effects of misspecifying genetic parameters in lod score analysis. Biometrics 42:393–399 [PubMed] [Google Scholar]
- Craddock N, Jones I (1999) Genetics of bipolar disorder. J Med Genet 36:585–594 [DOI] [PMC free article] [PubMed] [Google Scholar]
- Curtis D, Kalsi G, Brynjolfsson J, McInnis M, O’Neill J, Smyth C, Moloney E, Murphy P, McQuillin A, Petursson H, Gurling H (2003) Genome scan of pedigrees multiply affected with bipolar disorder provides further support for the presence of a susceptibility locus on chromosome 12q23-q24, and suggests the presence of additional loci on 1p and 1q. Psychiatr Genet 13:77–84 10.1097/00041444-200306000-00004 [DOI] [PubMed] [Google Scholar]
- Dick DM, Foroud T, Flury L, Bowman ES, Miller MJ, Rau NL, Moe PR, et al (2003) Genomewide linkage analyses of bipolar disorder: a new sample of 250 pedigrees from the National Institute of Mental Health Genetics Initiative. Am J Hum Genet 73:107–114 [DOI] [PMC free article] [PubMed] [Google Scholar]
- Ekholm JM, Kieseppa T, Hiekkalinna T, Partonen T, Paunio T, Perola M, Ekelund J, Lonnqvist J, Pekkarinen-Ijas P, Peltonen L (2003) Evidence of susceptibility loci on 4q32 and 16p12 for bipolar disorder. Hum Mol Genet 12:1907–1915 10.1093/hmg/ddg199 [DOI] [PubMed] [Google Scholar]
- Endicott J, Spitzer RL (1978) A diagnostic interview: the schedule for affective disorders and schizophrenia. Arch Gen Psychiatry 35:837–844 [DOI] [PubMed] [Google Scholar]
- Ewald H, Flint T, Kruse TA, Mors O (2002) A genome-wide scan shows significant linkage between bipolar disorder and chromosome 12q24.3 and suggestive linkage to chromosomes 1p22-21, 4p16, 6q14-22, 10q26 and 16p13.3. Mol Psychiatry 7:734–744 10.1038/sj.mp.4001074 [DOI] [PubMed] [Google Scholar]
- Fallin MD, Lasseter VK, Wolyniec PS, McGrath JA, Nestadt G, Valle D, Liang K-Y, Pulver AE (2004) Genomewide linkage scan for bipolar-disorder susceptibility loci among Ashkenazi Jewish families. Am J Hum Genet 75:204–219 [DOI] [PMC free article] [PubMed] [Google Scholar]
- Fangerau H, Ohlraun S, Granath RO, Nöthen MM, Rietschel M, Schulze TG (2004) Computer-assisted phenotype characterization for genetic research in psychiatry. Hum Heredity 58:122–130 10.1159/000083538 [DOI] [PubMed] [Google Scholar]
- Hodge SE, Abreu PC, Greenberg DA (1997) Magnitude of type I error when single-locus linkage analysis is maximized over models: a simulation study. Am J Hum Genet 60:217–227 [PMC free article] [PubMed] [Google Scholar]
- Kruglyak L, Daly MF, Reeve-Daly MP, Lander ES (1996) Parametric and nonparametric linkage analysis: a unified multipoint approach. Am J Hum Genet 58:1347–1363 [PMC free article] [PubMed] [Google Scholar]
- Kruglyak L, Lander ES (1998) Faster multipoint linkage analysis using Fourier transforms. J Comput Biol 5:1–7 [DOI] [PubMed] [Google Scholar]
- Lee Y-A, Rüschendorf F, Windemuth C, Schmitt-Egenolf M, Stadelmann A, Nüurnberg G, Ständer M, Wienker TF, Reis A, Traupe H (2000) Genomewide scan in German families reveals evidence for a novel psoriasis-susceptibility locus on chromosome 19p13. Am J Hum Genet 67:1020–1024 [DOI] [PMC free article] [PubMed] [Google Scholar]
- Liu J, Juo SH, Dewan A, Grunn A, Tong X, Brito M, Park N, Loth JE, Kanyas K, Lerer B, Endicott J, Penchaszadeh G, Knowles JA, Ott J, Gilliam TC, Baron M (2003) Evidence for a putative bipolar disorder locus on 2p13-16 and other potential loci on 4q31, 7q34, 8q13, 9q31, 10q21-24, 13q32, 14q21 and 17q11-12. Mol Psychiatry 8:333–342 10.1038/sj.mp.4001254 [DOI] [PubMed] [Google Scholar]
- Markianos K, Daly MJ, Kruglyak L (2001) Efficient multipoint linkage analysis through reduction of inheritance space. Am J Hum Genet 68:963–977 [DOI] [PMC free article] [PubMed] [Google Scholar]
- McInnis MG, Dick DM, Willour VL, Avramopoulos D, MacKinnon DF, Simpson SG, Potash JB, et al (2003) Genome-wide scan and conditional analysis in bipolar disorder: evidence for genomic interaction in the National Institute of Mental Health Genetics Initiative bipolar pedigrees. Biol Psychiatry 54:1265–1273 10.1016/j.biopsych.2003.08.001 [DOI] [PubMed] [Google Scholar]
- Middleton FA, Pato MT, Gentile KL, Morley CP, Zhao X, Eisener AF, Brown A, Petryshen TL, Kirby AN, Medeiros H, Carvalho C, Macedo A, Dourado A, Coelho I, Valente J, Soares MJ, Ferreira CP, Lei M, Azevedo MH, Kennedy JL, Daly MJ, Sklar P, Pato CN (2004) Genomewide linkage analysis of bipolar disorder by use of a high-density single-nucleotide–polymorphism (SNP) genotyping assay: a comparison with microsatellite marker assays and finding of significant linkage to chromosome 6q22. Am J Hum Genet 74:886–897 [DOI] [PMC free article] [PubMed] [Google Scholar]
- Pato CN, Pato MT, Kirby A, Petryshen TL, Medeiros H, Carvalho C, Macedo A, Dourado A, Coelho I, Valente J, Soares MJ, Ferreira CP, Lei M, Verner A, Hudson TJ, Morley CP, Kennedy JL, Azevedo MH, Daly MJ, Sklar P (2004) Genome-wide scan in Portuguese Island families implicates multiple loci in bipolar disorder: fine mapping adds support on chromosomes 6 and 11. Am J Med Genet B Neuropsychiatr Genet 127:30–34 10.1002/ajmg.b.30001 [DOI] [PubMed] [Google Scholar]
- Rice JP, Goate A, Williams JT, Bierut L, Dorr D, Wu W, Shears S, Gopalakrishnan G, Edenberg HJ, Foroud T, Nurnberger J Jr, Gershon ES, Detera-Wadleigh SD, Goldin LR, Guroff JJ, McMahon FJ, Simpson S, MacKinnon D, McInnis M, Stine OC, DePaulo JR, Blehar MC, Reich T (1997) Initial genome scan of the NIMH genetics initiative bipolar pedigrees: chromosomes 1, 6, 8, 10, and 12. Am J Med Genet 74:247–253 [DOI] [PubMed] [Google Scholar]
- Schulze TG, McMahon FJ (2003) Genetic linkage and association studies in bipolar affective disorder: a time for optimism. Am J Med Genet C Semin Med Genet 123:36–47 10.1002/ajmg.c.20012 [DOI] [PubMed] [Google Scholar]
- Schulze TG, Buervenich S, Badner JA, Steele CJ, Detera-Wadleigh SD, Dick D, Foroud T, Cox NJ, MacKinnon DF, Potash JB, Berrettini WH, Byerley W, Coryell W, DePaulo JR Jr, Gershon ES, Kelsoe JR, McInnis MG, Murphy DL, Reich T, Scheftner W, Nurnberger JI Jr, McMahon FJ (2004) Loci on chromosomes 6q and 6p interact to increase susceptibility to bipolar affective disorder in the National Institute of Mental Health Genetics Initiative pedigrees. Biol Psychiatry 56:18–23 10.1016/j.biopsych.2004.04.004 [DOI] [PubMed] [Google Scholar]
- Segurado R, Detera-Wadleigh SD, Levinson DF, Lewis CM, Gill M, Nurnberger JI Jr, Craddock N, et al (2003) Genome scan meta-analysis of schizophrenia and bipolar disorder, part III: bipolar disorder. Am J Hum Genet 73:49–62 [DOI] [PMC free article] [PubMed] [Google Scholar]
- Strauch K (2003) Parametric linkage analysis with automatic optimization of the disease model parameters. Am J Hum Genet Suppl 73:A2624 [Google Scholar]
- Strauch K, Fimmers R, Kurz T, Deichmann KA, Wienker TF, Baur MP (2000) Parametric and nonparametric multipoint linkage analysis with imprinting and two-locus–trait models: application to mite sensitization. Am J Hum Genet 66:1945–1957 [DOI] [PMC free article] [PubMed] [Google Scholar]
- Suarez BK, Hampe CL, van Eerdewegh P (1994) Problems of replicating linkage claims in psychiatry. In: Gershon ES, Cloninger CR, Genetic (eds) Approaches to mental disorders. American Psychiatric Press, Washington, DC, and London, pp 23–46 [Google Scholar]
- Terwilliger JD, Shannon WD, Lathrop GM, Nolan JP, Goldin LR, Chase GA, Weeks DE (1997) True and false positive peaks in genomewide scans: applications of length-biased sampling to linkage mapping. Am J Hum Genet 61:430–438 [DOI] [PMC free article] [PubMed] [Google Scholar]
- Venken T, Claes S, Sluijs S, Paterson AD, van Duijn C, Adolfsson R, Del-Favero J, Van Broeckhoven C (2005) Genomewide scan for affective disorder susceptibility loci in families of a northern Swedish isolated population. Am J Hum Genet 76:237–248 [DOI] [PMC free article] [PubMed] [Google Scholar]
- Weeks DE, Lehner T, Squires-Wheeler E, Kaufmann C, Ott J (1990) Measuring the inflation of the lod score due to its maximization over model parameter values in human linkage analysis. Genet Epidemiol 7:237–243 10.1002/gepi.1370070402 [DOI] [PubMed] [Google Scholar]
- Wing JK, Babor T, Brugha T, Burke J, Cooper JE, Giel T, Jablenski A, Regier D, Sartorius N (1990) SCAN: schedules for clinical assessment in neuropsychiatry. Arch Gen Psychiatry 47:589–592 [DOI] [PubMed] [Google Scholar]
- World Health Organization (2002) World Health Report 2002 (http://www.who.int/whr/2002/whr2002_annex3.pdf) (accessed October 19, 2005)
- Zubenko GS, Maher B, Hughes HB 3rd, Zubenko WN, Stiffler JS, Kaplan BB, Marazita ML (2003) Genome-wide linkage survey for genetic loci that influence the development of depressive disorders in families with recurrent, early-onset, major depression. Am J Med Genet B Neuropsychiatr Genet 123:1–18 10.1002/ajmg.b.20073 [DOI] [PubMed] [Google Scholar]


