Abstract
The metallorganic chemical vapor deposition method was successfully used to synthesize pure TiO2 and Nd3+-, Pd2+-, Pt4+-, and Fe3+-doped TiO2 nanoparticles. Polycrystalline TiO2 structure was verified with x-ray diffraction, which showed typical characteristic anatase reflections without any separate dopant-related peaks. Transmission electron microscopy observations confirmed the existence of homogeneously distributed 22 ± 3 nm TiO2 nanoparticles. The particle size remained the same for the doped samples. The doping level of transition metals was kept at ≈1 atomic percent, which was determined by x-ray photoelectron spectra and energy dispersive x-ray spectroscopy. The effects of different types of dopants on the photocatalytic activity were revealed by the degradation of 2-chlorophenols with an UV light source. The photocatalytic efficiency was remarkably enhanced by the introduction of Pd2+ and Nd3+. Nd3+-doped TiO2 showed the largest enhancement. However, Pt4+ changed the 2-chlorophenol degradation rate only slightly, and Fe3+ was detrimental to this process. These effects were related to the position of the dopants in the nanoparticles and the difference in their ionic radii with respect to that of Ti4+.
Titanium dioxide occurs in three forms (rutile, anatase, and brookite), among which anatase is believed to be the most efficient photocatalyst during chemical reactions (1, 2). It has been extensively investigated for its catalytic and electrochemical properties based on its wide applications as photocatalyst and gas sensor. Most of the studies were focused on the nanosized TiO2 with the purpose of improving the light absorption. The high surface-to-volume ratio, inherent in nanoparticles, was useful. Additionally, the small size of TiO2 crystals can make indirect band electron transition possible and increase the generation rate of electrons and holes. Increase of the generation rate of charge carriers is one way to enhance the photocatalytic activity. On the other hand, electron and hole trapping during their transportation from the interior of the particle to the surface is also very crucial to preventing the recombination of electron and hole pairs. Doping of TiO2 with transition metal ions offers a way to trap charge carriers and extend the lifetime of one or both of the charge carriers. Consequently, dopants enhance the efficiency of the photocatalyst.
The primary driving force in this research was to study the photocatalytic characteristics of TiO2 nanoparticles and the effect of transition metal dopants on TiO2 nanoparticles performance. In photocatalysis, it is the photon-generated electron-hole (e−/h+) pairs that can facilitate redox reactions on particle surface. The total number of free carriers on the surface determines the efficiency of catalysts. The number and the lifetime of free e−/h+ are particle size- and dopant-dependent. For large particles, the volume recombination of electrons and holes dominates. This condition largely reduces the number of free charges on the surface and deteriorates the photocatalytic activity. For nanoparticles, the transportation length of e−/h+ from crystal interface to the surface is short, which helps to accelerate the migration rate of e−/h+ to the surface of the nanoparticle to participate the reaction process. For optimal photocatalysis efficiency there is a critical particle size below which the surface recombination of electron and hole becomes dominant because of the increased surface-to-volume ratio (3).
Besides the effect of particle size on the photocatalytic activity, the role of dopant is important. Different dopants may not have the same effect on trapping electrons and/or holes on the surface or during interface charge transfer because of the different positions of the dopant in the host lattice. Consequently, the photocatalytic efficiency would be different for different types of dopants. In this article, we describe the synthesis of Pt4+ nanoparticles and the effect of transition metal ion Nd3+, Pd2+, Ti4+, and Fe3+ dopants on the photocatalytic activity of TiO2 nanoparticles. The photoactivity is investigated by performing the degradation experiments of 2-chlorophenols (2-CP). The comparison of photodegradation rates for TiO2 with and without dopants is presented.
Synthesis of TiO2 anatase nanocrystals has been achieved by several methods including impregnation (4), coprecipitation (5), sol-gel (6–8), hydrothermal method (9–11), and chemical vapor deposition (CVD) (12, 13). In our study, a metallorganic CVD (MOCVD) process was used to prepare TiO2 nanoparticles. MOCVD is preferred because it requires no postdeposition calcination, centrifugation, or hydrothermal processing to crystallize or refine particles. Also, the size distribution of particles can be simply controlled by the temperature of substrates and the flow rates of the precursors. The introduction of dopants into TiO2 nanoparticles can be realized either by a solid source, which is directly put in the proper position in the reactor, or by a solution mixed in with the liquid Ti precursor.
Experimental Procedures
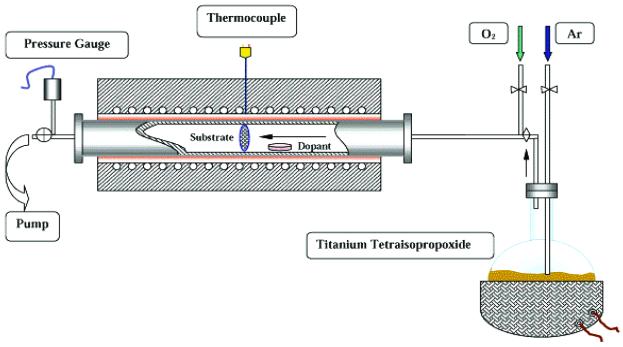
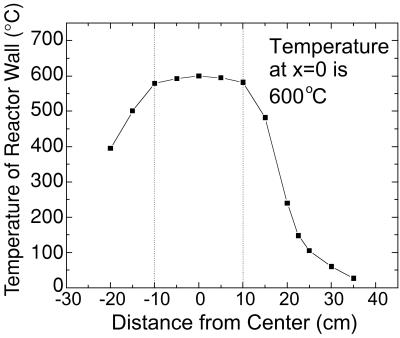
Fig. 1 shows the schematics of the MOCVD system used for the preparation of TiO2 nanoparticles. All powder samples were collected on 5-cm diameter discs made of several layers of 475-mesh stainless steel screen, which were designed to obtain high collection efficiency. Before deposition, acetone, methanol, and deionized water were used to remove any native contamination from the surface of the screens. The screens were held perpendicular to the flow of the reactants in the MOCVD chamber by a 3-cm diameter and 12.5-cm long quartz tube. The MOCVD chamber consisted of a 5-cm diameter and 75-cm length stainless steel tube with a central region that could be externally and uniformly heated to 1,000°C by a resistive heater. Fig. 2 shows the temperature profile of the reactor wall at 600°C. There is a 20-cm long central region and the temperature decreased toward both the ends of the reactor. The base pressure obtained by a mechanical pump was in the mTorr regime. The precursor used for Ti was Ti[OCH(CH3)2]4 (titanium tetraisopropoxide, TTIP, 97%). TTIP is a liquid at room temperature with a boiling point of about 232°C. TTIP was placed in a bubbling chamber that was supplied with 99.999% pure Ar as TTIP carrier gas. The temperature of the bubbling chamber and the flow rate of Ar determined the precursor flow rate, which was adjusted by changing the temperature of the bubbling chamber and/or the flow rate of the Ar through the bubbling chamber. In addition to Ar and TTIP, O2 was introduced in the MOCVD chamber to participate in the chemical reaction to form TiO2. For the purpose of doping, neodymium (III) acetylacetonate, palladium (II) acetylacetonate, platinum (IV) acetylacetonate, and iron (III) acetylacetonate in powder forms were used for Nd3+, Pd2+, Pt4+, and Fe3+ ion doping, respectively. These dopant precursors were put in a Cu container, which was directly placed in the chamber. No Cu-related contamination peak was observed during the x-ray photoelectron spectroscopy (XPS) analysis. The use of Cu container does not introduce any Cu impurity because the melting point of Cu and its related oxide is much higher than the temperature at which the Cu container is used during synthesis. The incorporation rate of dopant was determined by the vapor pressure of the dopant precursor. The dopant concentration as a function of the dopant precursor temperature was measured. Thus, to obtain certain desired dopant concentration in TiO2, dopant precursor can be placed at a predetermined position of the chamber. We used the same deposition conditions for all sample preparations in this study (see Table 1). The partial pressures of O2 and Ar were 10 Torr and 1 Torr, respectively. The temperatures for substrate and TTIP precursor were 600°C and 220°C, respectively.
Figure 1.
Schematics of MOCVD system.
Figure 2.
Temperature profile of the reactor wall at 600°C.
Table 1.
Deposition conditions, ionic radii of transition metals for a coordination number of 6(16), particle sizes obtained from XRD and TEM as well as its histogram, and photodegradation time to achieve 90% destruction of 2-CP for pure TiO2 and Nd3+-, Pd2+-, Pt4+-, Fe3+-doped TiO2 nanoparticles
| Sample | Pure TiO2 | TiO2(Pt4+) | TiO2(Fe3+) | TiO2(Pd2+) | TiO2(Nd3+) |
|---|---|---|---|---|---|
| Substrate temperature (°C) | 600 | 600 | 600 | 600 | 600 |
| TTIP temperature (°C) | 220 | 220 | 220 | 220 | 220 |
| O2 pressure (Torr) | 10 | 10 | 10 | 10 | 10 |
| Ar pressure (Torr) | 1.0 | 1.0 | 1.0 | 1.0 | 1.0 |
| Position of dopant precursor (cm)* | — | 18 | 20 | 19 | 21.5 |
| Dopant ionic radii (Å)† | — | 0.625 | 0.645 | 0.86 | 0.983 |
| Particle size from XRD (nm) | 27 ± 3 | 28 ± 3 | 28 ± 3 | 27 ± 3 | 27 ± 3 |
| Particle size from TEM (nm) | 23 ± 3 | 23 ± 3 | 24 ± 2 | 23 ± 3 | 22 ± 3 |
| Particle size from histogram (nm) | 23 | 23 | 23 | 22 | 22 |
| Time for destruction of 90% 2-CP (min) | 60 | 50 | 90 | 40 | 25 |
X-ray diffraction (XRD) analyses were carried out for all samples. XRD θ-2θ scans were recorded by using Cu Kα radiation in a Rigaku (Tokyo) D-Max B diffractometer equipped with a graphite crystal monochromator for structural characterization of the polycrystalline doped and undoped TiO2 samples. xfit software (freeware from http://www.ccp14.ac.uk/tutorial/xfit-95/) was used to measure the precise 2θ positions and the full width at half maxima of the diffraction peaks. XPS and energy dispersive x-ray spectroscopy were performed for composition determination of the samples. A SSI-M Probe XPS was used with Al Kα exciting radiation. High-resolution scans of the Ti 2p, dopant 3d, O 1s, and C 1s regions were obtained, in addition to the survey scans, to measure the composition of the nanoparticles and to verify the valance states of Ti and the dopants. Amray (Bedford, MA) 1810T scanning electron microscopy and a JEOL 2000 FX transmission electron microscopy (TEM) were used to observe the TiO2 surface morphology and to measure the average nanoparticle size and distribution, respectively.
Photodegradation experiments were performed in the photocatalytic reactor system. This bench-scale system consisted of a cylindrical Pyrex-glass cell 20 cm in diameter and 30 cm in height with an inside reflective surface. A 100-W Hg lamp was used and immersed in the solution. A cold air-cooling jacket cooled the cell. The maximum energy emission at the wavelength of 365 nm was achieved 4 min after the lamp was turned on. At the cooling jacket, an energy density of 5.3 mW/cm2 was measured. An aqueous solution (1,000 ml) of 2-CP and the stainless steel mesh with the TiO2 nanoparticles were placed in the photoreactor cell. After illumination, samples were collected at regular intervals in a test tube, and each sample solution was analyzed by HPLC (Waters model 6000 gradient system). The total organic carbon (TOC) of a sample solution was measured at constant irradiation time intervals by using a DC-190 high-temperature TOC analyzer. The Cl− ion was analyzed by ion chromatograph (Dionex) equipped with an electrochemical detector and a Dionex PAX-100 metal-free anion column (25 cm long, 4.6 mm i.d.). The eluent solution was a mixture of 80% H2O, 10% acetonitrile, and 10% 191-mM NaOH. The flow rate was 1 ml/min, and the injection loop volume was 50 μl.
The activity of the photocatalytic decomposition of 2-CP was again estimated from the yield of carbon dioxide, determined, gravimetrically as BaCO3, from the yield of carbon dioxide as decreasing results of electric conductivity for Ba(OH)2 solution. HCO3− in a sample solution was measured by ion and liquid chromatography.
Results
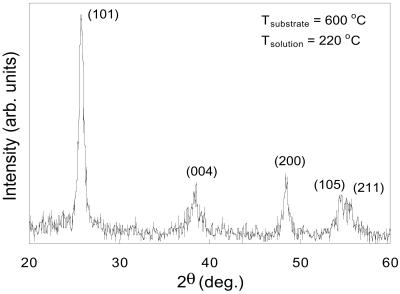
X-ray structure analysis for samples doped with different types of transition metal ions showed all of these samples had typical peaks of TiO2 polycrystalline anatase nanoparticle without any detectable dopant-related peaks. The dopants went either into the interstitial positions or substitutional sites of TiO2 crystal structure. Fig. 3 shows an x-ray diffraction pattern for Nd3+-doped TiO2 nanoparticles. The polycrystalline anatase structure was confirmed by (101) (004), (200), (105), and (211) diffraction peaks. Its tetragonal Bravais lattice type was also verified by lattice constant calculated from these peaks. Based on the full width at half maxima of the XRD peaks, the average particle diameter was calculated to be about 27 ± 3 nm by using Scherrer's formula. There was no measurable effect on the size of TiO2 nanoparticles with the addition of different types of dopants.
Figure 3.
XRD pattern of ND-doped polycrystalline TiO2 nanoparticles.
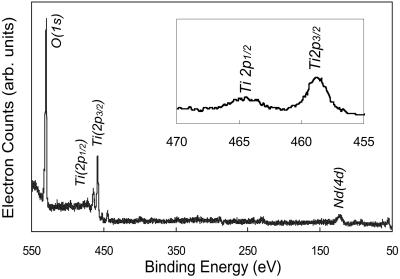
XPS survey spectra for the same sample with Nd doping is shown in Fig. 4. Only peaks associated with Ti, O, and Nd were observed. The relative cation composition in the particles was determined by XPS and energy dispersive x-ray spectroscopy. The Nd concentration was measured to be about 1 atomic percent (at%). The magnified Ti 2p region is presented in Fig. 4 Inset. Two peaks located at 458.4 eV and 464.1 eV were identified as Ti (2p3/2) and Ti (2p1/2) (14), respectively. For metallic Ti0 these two peaks are expected at 455 and 459 eV (16). The peak shifts in Ti (2p3/2) and Ti (2p1/2) peak positions and the change in the separation between these two peaks is caused by the presence of tetravalent Ti4+, which is consistent with TiO2 formation (14, 15).
Figure 4.
XPS survey spectra of Nd-doped TiO2 nanoparticles and the magnified Ti 2p region.
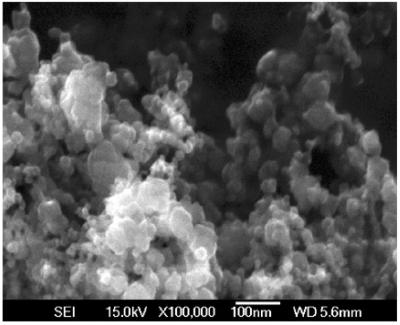
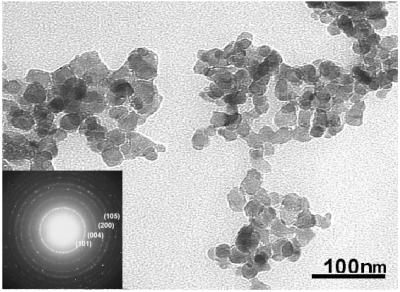
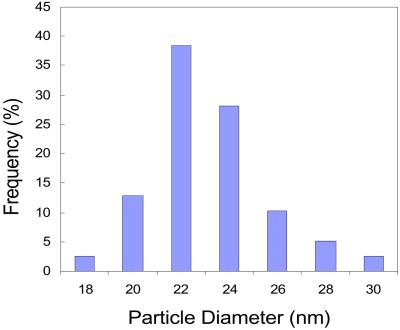
Fig. 5 shows a ×10,000-magnified scanning electron microscopy image of Nd-doped TiO2 nanoparticles. The TiO2 particles are aggregated together and the rough measurements from this image indicate that the size of particles is in the nanoscale range. More precise size and distribution measurements were performed by TEM. A TEM bright-field image with the diffraction pattern as an inset is shown in Fig. 6. The particle size measured was about 22 ± 3 nm, consistent with the grain size measured by XRD. The electron diffraction patterns correspond to that of anatase TiO2. Fig. 7 is the histogram of particle distribution. The distribution of the size of nearly spherical particles peaked at about 22 nm with a relatively small tail toward larger values.
Figure 5.
Scanning electron microscopy image of TiO2 nanoparticles.
Figure 6.
TEM bright-field image of nanosized polycrystalline TiO2 particles and their diffraction pattern.
Figure 7.
Size distribution histogram of TiO2 nanoparticles deposited at 600°C.
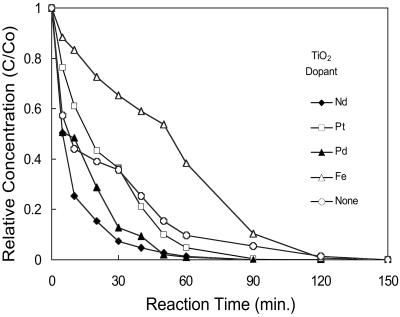
Fig. 8 is the comparison of the 2-CP photodegradation rates for pure TiO2 sample and Nd3+-, Pd2+-, Pt4+-, and Fe3+-doped TiO2 samples. In this study, the doping level in all four cases was kept constant at about 1 at%. The change of photocatalytic activity for doped samples is evident from the degradation curves. Moreover, the degradation rates for most doped samples have been enhanced with the exception of Fe3+-doped sample. The time for 90% destruction of 2-CP has been reduced from 60 min for undoped TiO2 to 25 min for Nd3+-doped TiO2 nanoparticles.
Figure 8.
Photodegradation of 2-CP with undoped TiO2 and transition metal ion- (Nd3+, Pd2+, Pt4+, and Fe3+) doped TiO2 under an UV light source. C0 = 50 mg in 1,000 ml at pH 9.5.
Discussion
The total number of free charge carriers on the TiO2 surface is determined by the rate of charge pair generation, charge trapping, charge release and migration, charge recombination as well as the rate of interfacial charge transfer. The complexities of the role of transition metal ion dopants are that they can participate in all of these processes. Acting as electron and/or hole traps is the most important function of dopants. The trap of charge carriers can decrease the recombination rate of e−/h+ pairs and consequently increase the lifetime of charge carriers. The process of charge trapping is as follows:
 |
where Mn+ is the metal ion dopant. The energy level of Mn+/M(n−1)+ lies below the conduction band edge and the energy level of Mn+/M(n+1)+ lies above the valence band edge. Thus, the energy level of transition metal ions affects the trapping efficiency. The trapping of electrons makes it easy for holes to transfer onto the surface of TiO2 and react with OH− in the 2-CP solution and form active OH⋅, hydroxyl radicals to participate the destruction of 2-CP.
2-CP degradation is an oxidation reaction for which the lifetime of the holes is critical. The lifetime of holes can be enhanced by trapping electrons, thereby reducing the recombination rate and allowing holes to diffuse to the particle surface and participate in the oxidation reaction. If the energy level of dopant ions moves toward the conduction band edge, the efficiency of trapping becomes higher. In that case, the traps have larger tendency to act as shallow traps so that the holes generated by following photons cannot recombine with the already trapped electrons. Consequently, the lifetime of free holes can be extended.
However, for transition metal ions in interstitial and substitutional positions, the change of their potential level is different and they have different trapping efficiencies for electrons. The effect of the interstitials in distorting the potential energy is larger than that of substitutional atoms. According to the XRD results of doped TiO2, only anatase phase was present in the TiO2 nanoparticles and no separate dopant-related phase was observed. This finding indicates that dopant ions Nd3+, Pd2+, Pt4+, and Fe3+ are either in the octahedral interstitial sites or the substitutional positions of TiO2. From the effective radii of ions for coordination number of 6 (16) in Table 1, one can see Fe3+ and Pt4+ have small ionic radii that are comparable to that of Ti4+, 0.605 Å. It is energetically favorable for these two ions to occupy Ti4+ sites. Nd3+, on the other hand, has an ionic radius that is much larger than that of Ti4+. It is energetically favorable for Nd3+ to reside in the octahedral interstitial site. The size of octahedral interstitial is large enough, 3.78 and 9.51 Å for a and c axes, respectively, to accommodate Nd3+. Pd2+ also has relatively larger ionic radius and can go into the interstitial positions. Substitutionally incorporated dopants are less useful for disturbing the dopant energy level, which in turn affects the electron trapping efficiency. Pt doping shows reduced enhancement compared with Nd and Pd doping, whereas Fe doping shows lack of enhancement. There have been previous studies that show similar results for Fe on the photodegradation of the vinyl chloride (5). Another contributing reason for the lack of photocatalytic activity enhancement by Fe may include nonoptimal valency of Fe. The accurate determination of the Fe oxidation state when it is present in such low concentrations is difficult because of the problem in satisfactorily resolving the Fe 3p region of the XPS spectrum. For the interstitial dopants, the situation is different and the potential energy level can be increased negatively toward the conduction band edge because of the oxygen affinity of dopant ions. This is the case for Nd3+ and Pd2+. The high oxygen affinities of interstitially located Nd3+ and Pd2+ ions effectively create a localized positive charge around Ti and/or form an oxygen vacancy. The potential energy of ion dopants was disturbed and electrons were efficiently trapped. Consequently, the oxidation process of chlorophenols was remarkably improved. Currently, the doped samples had 1 at% of dopant concentrations.
TiO2 nanoparticles have applications in photovoltaics, paints, etc. The enhanced performance of doped TiO2 as a photocatalyst suggests that its performance for other applications also may be improved. However, these particles have to be analyzed specifically for the pertinent application.
Conclusions
Crystalline doped and undoped TiO2 anatase nanoparticles (22 ± 3 nm) were successfully synthesized by using MOCVD at 600°C substrate temperature and 220°C precursor solution temperature. The effect of the different type dopants, Nd3+, Pd2+, Pt4+, and Fe3+, with similar concentration (≈1 at%) on the photocatalytic efficiency was investigated by performing the photodegradation of 2-CP under radiation of UV light. Results showed that the efficiency of photocatalyst was remarkably enhanced for Nd3+- and Pd2+-doped TiO2. In particular, the 90% destruction time of 2-CP was reduced from 60 min for the undoped TiO2 nanoparticles to 25 min for the 1 at% Nd-doped nano TiO2. On the other hand, Pt4+ caused only a slight decrease in the 2-CP oxidation time and Fe3+ did not help at all. Possible explanations could be based on the change of potential energy level for different positions of dopants in TiO2 lattice. The position of dopants is determined by the size differences between the host Ti4+ ionic radius and the dopant's ionic radii. Nd3+ and Pd2+ acted as interstitial dopants. Large disturbance of the potential energy resulted in the creation of localized positive charge around Ti and/or formation an oxygen vacancy, which consequently enhanced the electron trapping efficiency. However, Pt4+ and Fe3+ were presumably in substitutional positions with very little or no potential energy disturbance. They were less useful for the electron trapping. More experiments, including near edge x-ray absorption fine structure and XPS, are necessary to locate the position of dopants in TiO2 lattice.
Abbreviations
- e−/h+
electron-hole
- 2-CP
2-chlorophenols
- CVD
chemical vapor deposition
- MOCVD
metallorganic CVD
- TTIP
titanium tetraisopropoxide
- XPS
x-ray photoelectron spectroscopy
- XRD
x-ray diffraction
- TEM
transmission electron microscopy
- at%
atomic percent
Footnotes
This paper results from the Arthur M. Sackler Colloquium of the National Academy of Sciences, “Nanoscience: Underlying Physical Concepts and Phenomena,” held May 18–20, 2001, at the National Academy of Sciences in Washington, DC.
This paper was submitted directly (Track II) to the PNAS office.
References
- 1.Sclafani A, Palmisano L, Davi E. J Photochem Photobiol A. 1991;56:113–123. [Google Scholar]
- 2.Vidal A, Herrero J, Romero M, Sanchez B, Sanchez M. J Photochem Photobiol A. 1994;79:213–219. [Google Scholar]
- 3.Beydoun D, Amal R, Low G, McEvoy S. J Nanoparticle Res. 1999;1:439–458. [Google Scholar]
- 4.Litter M I, Navio J A. J Photochem Photobiol A. 1994;84:183–193. [Google Scholar]
- 5.Palmisano L, Augugliaro V, Sclafani A, Schiavello M. J Phys Chem. 1988;92:6710–6713. [Google Scholar]
- 6.Choi W, Termin A, Hoffermann M R. J Phys Chem. 1994;98:13669–13679. [Google Scholar]
- 7.Zhang Z, Wang C-C, Zakaria R, Ying J Y. J Phys Chem B. 1998;102:10871–10878. [Google Scholar]
- 8.Wang C-C, Zhang Z, Ying J Y. NanoStructured Mater. 1997;9:583–586. [Google Scholar]
- 9.Wang Y, Cheng H, Hao Y, Ma J, Li W, Cai S. J Mater Sci. 1999;34:3721–3729. [Google Scholar]
- 10.Cheng H, Ma J, Zhao Z, Qi L. Chem Mater. 1995;7:663–671. [Google Scholar]
- 11.Wang Y, Hao Y, Cheng H, Ma J, Xu B, Li W, Cai S. J Mater Sci. 1999;34:2773–2779. [Google Scholar]
- 12.Ding Z, Hu X, Lu G Q, Yue P-L, Greenfield P F. Langmuir. 2000;16:6216–6222. [Google Scholar]
- 13.Schrijnemakers K, Impens N R E N, Vansant E F. Langmuir. 1999;15:5807–5813. [Google Scholar]
- 14.Wagner C D, Riggs W M, Davis L E, Moulder J F, Muilenberg G E, editors. Handbook of X-Ray Photoelectron Spectroscopy. Eden Prairie, MN: Perkin–Elmer; 1979. [Google Scholar]
- 15.Sen S K, Riga J, Verbist J. Chem Phys Lett. 1976;39:560–564. [Google Scholar]
- 16.Shannon R D. Acta Crystallogr A. 1976;32:751–767. [Google Scholar]


