Abstract
The horizontal, shore-perpendicular change in shoreline position along the Outer Banks of North Carolina is found to be a self-affine signal. We measure shoreline change by determining the horizontal change in position of the 0.8-m contour sampled from shore-perpendicular profiles spaced at 20-m intervals along the coast. The profiles are obtained from two light detection and ranging surveys performed in September 1997 and September 1998. For six selected sections of coast, wavelet analysis of the shoreline change signal indicates the signal is self-affine with a scaling exponent that varies from 1.2 to 2.1. This self-affine behavior indicates that the shoreline change signal is nonstationary with long-range persistence. A stochastic diffusion model of sediment transport replicates the observed self-affine behavior observed south of Cape Hatteras (scaling exponent between 1.2 and 1.6) whereas a random walk model replicates the signal observed north of Cape Hatteras (scaling exponent ≈2.0). Because of the finite nature of the data set, there are limits in space and time to the power law behavior of the system. Characteristics of such systems can be described by upper-truncated power laws, which yield the upper limits of power law behavior. Applying an upper-truncated power law to the data for one section of coast, we find an upper limit of 7 km for the maximum continuous alongshore distance eroding or accreting. For the same section of coast, we find upper limits of 25 m for the maximum shore-perpendicular erosion and 11 m for the maximum shore-perpendicular accretion during the study period.
If one measures the length of a coastline by walking calipers along the coast and counting the number of steps necessary, the measured length increases as the opening of the calipers decreases (1, 2). The relationship between the number of steps and caliper width is a power law and the scaling exponent is the fractal dimension of the coastline (2). Although virtually all coastlines are fractal over some range of length scale, the change of shoreline position with time has not been previously examined. With the application of light detection and ranging (LIDAR) technology to surveys of coastal beaches, it is now possible to obtain high-resolution topography for hundreds of kilometers of beach in a single day. This article examines the pattern of shoreline change between two LIDAR surveys of the Outer Banks, NC collected in September 1997 and September 1998.
Study Site
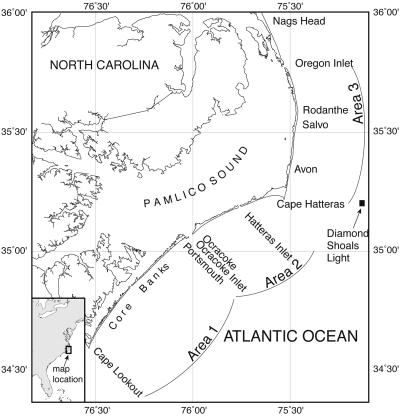
This work examines shoreline change along the Atlantic coast of the North Carolina Outer Banks from Cape Lookout to Oregon Inlet (Fig. 1). We divide the study region into three areas based on strike of the coast and dune stabilization history. Area 1 includes the region south of Ocracoke Inlet, which is nearly undeveloped with low-lying (generally less than 5 m) dunes and wide beaches. Areas 2 and 3 are north of Ocracoke Inlet. The dunes in areas 2 and 3 were actively stabilized by Works Progress Administration and Civilian Conservation Corps workers beginning in 1937 (3). A continuous vegetated line of dunes was created from Ocracoke inlet to the Virginia state line with dune heights ranging from 3 to 8 m and dune base widths of 25–100 m. The dunes were then planted with grass, trees, and shrubs. Stabilization efforts continued at irregular intervals throughout areas 2 and 3 until the mid-1970s (3). Since that time, stabilization efforts have decreased but have not completely stopped in the more-developed regions, particularly north of Cape Hatteras (area 3). Area 2 is the dune-stabilized region south of the bend at Cape Hatteras, where the coast strikes roughly northeast. Area 3 is north of Cape Hatteras, where the coast strikes roughly north-south.
Fig 1.
Map showing the location of study areas 1, 2, and 3 along the Outer Banks of North Carolina. The location of National Oceanographic and Atmospheric Administration's Diamond Shoals Light buoy, which records wave heights, is shown.
During the study interval, there were five storms during which wave heights over 4 m were recorded at Diamond Shoals Light off Cape Hatteras (Fig. 1). In area 1, the dunes are sufficiently low-lying that the largest storm waves during the study interval apparently washed over the island (4). In areas 2 and 3, it appears that the largest storm waves reached the dunes and were reflected back toward the ocean (4).
Data
This study examines LIDAR data collected by using the National Aeronautics and Space Administration (NASA) Airborne Topographic Mapper (ATM) as part of a collaborative project between NASA, the National Oceanographic and Atmospheric Administration, and the U.S. Geological Survey. The ATM can survey beach topography along hundreds of kilometers of coast in a single day with data densities that far exceed traditional survey technologies. Each swath is typically 375 m wide and continuous along the aircraft flight line. The aircraft pitch, roll, and heading were obtained with an inertial navigation system. The position of the aircraft was determined by using a kinematic global positioning system (5).
The LIDAR instrument transmits light to a target where it is reflected/scattered back to the instrument (e.g., ref. 6). The travel time is measured and used to determine the distance to the target, from which a topographic map can be created with a vertical accuracy of roughly 15 cm (7). The footprint of the laser is about 0.5 m, with a geographic (i.e., latitude and longitude) location accuracy of roughly 1 m (7).
In September 1997 and 1998, Airborne Topographic Mapper LIDAR surveys were conducted along major portions of the eastern United States, including the study region. The first survey of the study region was collected on September 26, 27, and 29, 1997. Before the 1997 survey, the last major storm was 14 months earlier, in July 1996 when hurricane Bertha made landfall 230 km southwest of Cape Hatteras. In August 1998, hurricane Bonnie made landfall 280 km southwest of Cape Hatteras and passed over the mainland, roughly parallel to the Outer Banks, causing minimal storm impact to the study region. A few days after hurricane Bonnie, the second LIDAR survey was collected on September 1 and 7, 1998. Comparison of these two LIDAR surveys allows quantification of the net shoreline change that occurred over a 12-month period.
Data Processing.
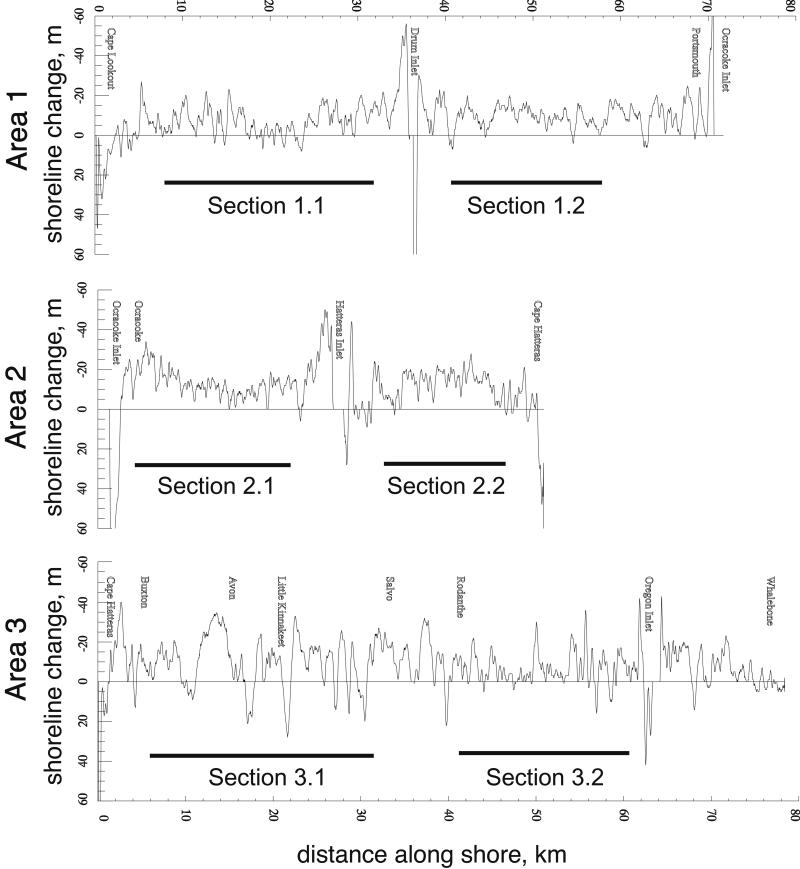
The Airborne Topographic Mapper obtained irregularly spaced measurements that were referenced spatially to the World Geodetic System 1984 (WGS84) ellipsoid model. The data were converted from WGS84 to North American Datum 1983 (NAD83) by using subroutines provided by the National Aeronautics and Space Administration/Wallops and the National Geodetic Survey of National Oceanographic and Atmospheric Administration. NAD83 is referenced to the Geodetic Reference System of 1980 ellipsoid. Using interactive data language (IDL), the data were filtered to remove all points higher than 20 m, which is taller than any dune elevation and probably represents return signals off birds, clouds, and tall buildings. The data were subdivided into 5-km sections along the coast and gridded at 1 square m by using the Delaunay triangulation function in IDL. A 3 × 3 median box filter was then applied to remove isolated high and low values. Gridded data points that differed by more than ±1 m vertically from the filtered values were replaced by the filtered values. The 0.8-m contour line was taken as a proxy for the shoreline. During data collection the highest tide never exceeded 0.76 m above mean sea level, thus, 0.8 m was the lowest elevation that could approximate the shoreline. A baseline, roughly parallel to and landward of the shoreline, was created and colocated for both years for each 5-km section. Shore-perpendicular profiles were sampled every 20 m along the baseline. The distance from the baseline to the 0.8-m contour was measured for each profile for each year. The difference in this distance between the two years yields the horizontal change in shoreline position (Fig. 2).
Fig 2.
Shore-perpendicular, horizontal change in position of the 0.8-m elevation for the three study areas shown in Fig. 1. Change values were determined every 20 m along the coast. Positive values represent horizontal accretion; negative values represent horizontal erosion. Sections used for wavelet analysis are shown.
Study Sections.
The locations of the six sections used for analysis are shown in Fig. 2. Although inlets are not sampled, inlets may have some influence on the study sections. For the Outer Banks, the maximum distance of inlet influence is 6.1 km updrift and 13.0 km downdrift from an inlet, whereas the coast may be dominated by inlet processes to a maximum distance of only 4.3 km (8). Although some sections under study probably are influenced by inlets, no portion of any section is dominated by inlet processes. The study sections were selected to be as long as possible without including regions of coast dominated by inlets, and range in length from 13.88 to 29.0 km (Table 1).
Table 1.
Summary of results
| Section number | Length, km | Δ area, m2/m | β value |
|---|---|---|---|
| 1.1 | 24.60 | −7.0 | 1.65 |
| 1.2 | 18.00 | −10.2 | 1.48 |
| 2.1 | 18.06 | −13.3 | 1.24 |
| 2.2 | 13.88 | −13.4 | 1.45 |
| 3.1 | 29.00 | −10.8 | 2.08 |
| 3.2 | 20.46 | −6.8 | 1.98 |
Methods
Wavelet Analysis.
Wavelet analysis (9) will be used to determine the frequency components of the shoreline change signal. Unlike Fourier analysis, wavelet analysis makes windowing and detrending of the signal unnecessary and provides spatial resolution of the frequency content. The wavelet method used in this article is based on Malamud and Turcotte (10). To perform a wavelet analysis, a signal, f(t′), is convolved with the wavelet transform filter g[(t′ − t)/a] where t′ is the variable of the signal, the filter is centered at t, and a is a scale parameter that determines the width of the filter (10). We used a filter that is the second derivative of the function that describes the Gaussian distribution with the form
 |
Because a graph of this function resembles a sombrero, it is called the Mexican hat wavelet. The wavelet is convolved with the time series to yield the wavelet transform
 |
We choose values for the scale parameter, a, of 1, 2, 4, 8, and 16. We define an effective wavelet width, λ, equal to π√ . If there is a power law relation between the variance of the wavelet transform, V, and the effective filter width, λ, the signal is self-affine. The scaling exponent of this power law is the scaling exponent of the signal, which is called β (10). Thus, for a self-affine signal, V ∼ λβ.
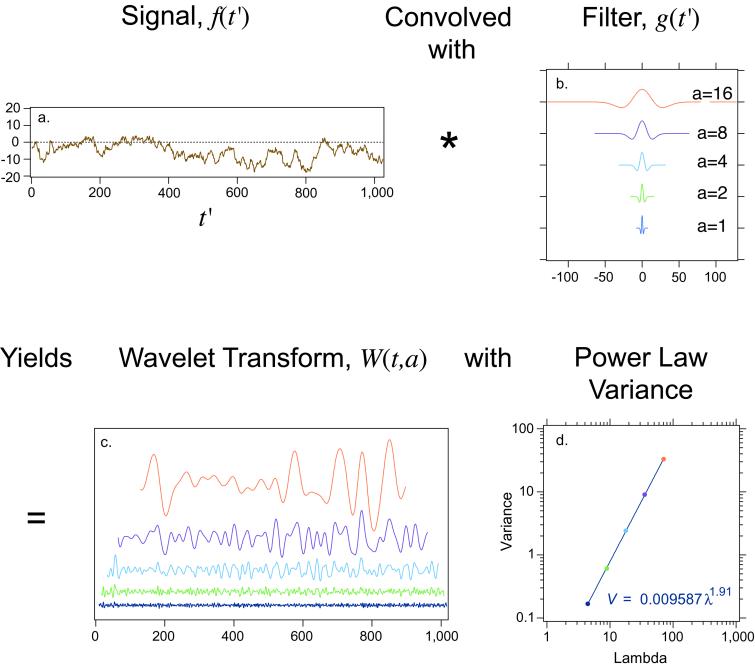
The wavelet analysis method is demonstrated by using a time series, f(t′), that is a Brownian motion for which β = 2 (10) (Fig. 3a). The time series, f(t′), is convolved with wavelets of different widths produced by using different values of a (Fig. 3b) to produce wavelet transforms, W(t,a) (Fig. 3c). The variance of each wavelet transform, V, is plotted against the effective filter width, λ (Fig. 3d). In the example shown in Fig. 3, there is a power law relation, V ∼ λβ, indicating the signal is self-affine. The scaling exponent, β, equals 1.9, approximately equal to the β value of a Brownian motion (10).
Fig 3.
Wavelet analysis method demonstrated for a Brownian motion. The signal f(t′) (a) is convolved with Mexican hat filters g(t′) (b) to yield the wavelet transforms W(t,a) (c). The filters were generated with scale parameters, a, from bottom to top, of 1, 2, 4, 8, and 16. There is a power law relationship between the variance of the transforms, V, and effective filter width, λ, indicating that the signal is self-affine with slope, β, equal to 1.9 (d).
Upper-Truncated Power Law.
An upper-truncated power law has been shown to describe cumulative distributions associated with several natural systems (11–13). An upper-truncated power law, NT(r), has the form
 |
where NT(r) is the number of objects with size greater than or equal to r, rT is the truncation size where the upper-truncated power law equals zero, and α is the scaling exponent. Because each value in a cumulative distribution includes all larger objects, upper truncation of the distribution decreases the cumulative number associated with each object size. In Eq. 3, the second term, C rT−α, represents this decrease from the power law, C r−α.
Results
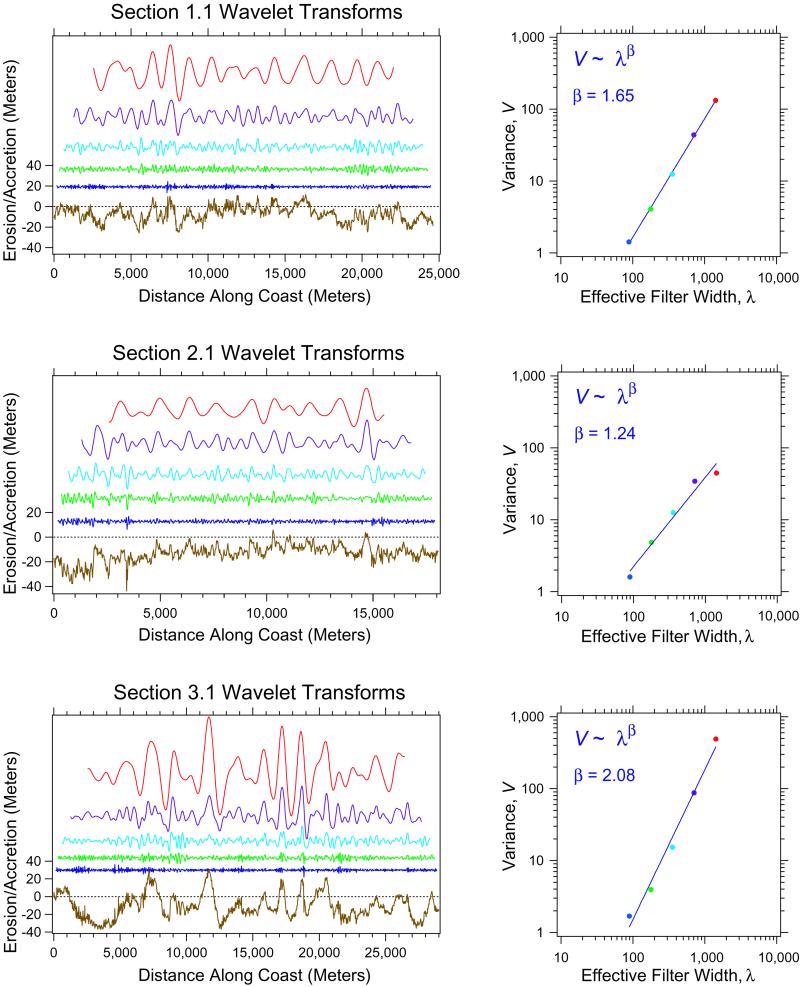
Following the method described above, we performed a wavelet analysis of shoreline change for six sections within the study region. For the six sections analyzed, the relationship between variance and λ is well described by a power law with scaling exponents, β, ranging from 1.2 to 2.0 (Table 1). Fig. 4 presents examples of the wavelet analysis for one section within each of the three areas. There is a spatial pattern to the scaling exponent, with β values of 1.2 to 1.65 south of Cape Hatteras, and 2.0 to 2.1 north of Cape Hatteras (Fig. 4, Table 1). For each section, we also calculated the average change in area shoreward of the 0.8-m contour for each meter of beach. This measurement was obtained by summing the shoreline change measurements in each section, multiplying the sum by the distance between each measurement, 20 m, and dividing this product by the length of the section (Table 1). All sections underwent net erosion during the study interval, ranging from 6.8 m2/m to 13.4 m2/m. There is no apparent correlation between average change in coastal land area and β (Table 1).
Fig 4.
Wavelet analysis of shore-perpendicular horizontal shoreline change for sections 1.1, 2.1, and 3.1 applying the wavelet method shown in Fig. 3. (Left) The shoreline change signal (bottom line) and five wavelet transforms of the obtained signal by using Mexican hat wavelets (from bottom to top, a is equal to 1, 2, 4, 8, and 16). (Right) A plot of variance of the wavelet transform, V, versus effective filter width, λ, for each transform. For all sections, the shoreline change signal exhibits power law scaling between V and λ with scaling exponents between 1.24 and 2.1, indicating that shoreline change is a self-affine signal.
Limits to Annual Shoreline Change.
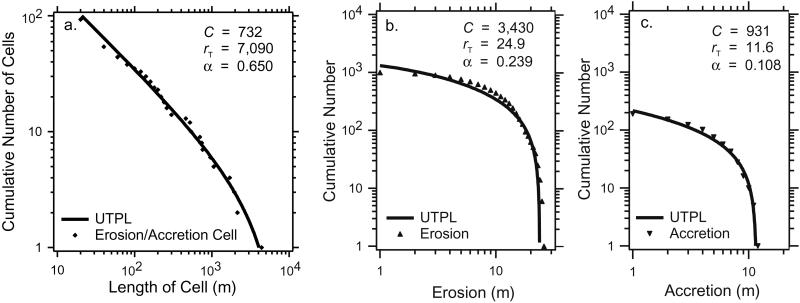
The shoreline change we observe has limits caused by the finite length of the coastline analyzed and the finite time interval between surveys. We can determine the limits of the shoreline change signal by applying an upper-truncated power law (Eq. 3) to cumulative distributions obtained from the time series. To determine the upper limit on the length of coast undergoing erosion or accretion, we measure the continuous shoreline lengths that experienced erosion (erosion cell) and accretion (accretion cell). We use section 1.1 as an example. The line of zero shoreline change (Fig. 4, section 1.1, dashed line) is used to obtain the distance between zero crossings. The cumulative number–size distribution of cell length is shown in Fig. 5a. This distribution is well described by an upper-truncated power law (Eq. 3) with truncation size, rT, equal to 7 km and scaling exponent, α, equal to 0.65 (Fig. 5a). Thus, within the 1-year interval studied along this section of coast, there is an upper limit of roughly 7 km for the maximum continuous length of beach eroding or accreting. In addition, the scaling exponent obtained from the upper-truncated power law may be compared with the result found by using wavelet analysis. A two-dimensional, self-similar object, when sampled along a line, should have a scaling exponent one unit less than the two-dimensional object. For section 1.1, the two-dimensional shoreline change signal has a scaling exponent of 1.65 (Fig. 4) whereas the zero crossing of the time series has a scaling exponent one unit less, 0.65, indicating that the results are consistent.
Fig 5.
Cumulative number-size distributions for characteristics of section 1.1. (a) The distribution of both erosion and accretion cell lengths. This distribution is well described by an upper-truncated power law (UTPL) (Eq. 3) with truncation size, rT, equal to 7 km and scaling exponent, α, equal to 0.65. (b) The distribution of erosion values. This distribution is consistent with an upper-truncated power law with upper truncation size, rT, equal to 25 m. (c) The distribution of accretion values. This distribution is consistent with an upper-truncated power law with upper truncation size, rT, equal to 12 m.
To determine the upper limit on the amount of erosion or accretion at any single location within each section of coast, we examine the cumulative distribution of all erosion and accretion measurements within each section. Erosion and accretion values each range over only about 1 order of magnitude and therefore could be well described by numerous functions. Because shoreline change is self-affine, erosion and accretion values may follow a power law. We examine the erosion and accretion distributions with an upper-truncated power law. The cumulative number-size distribution of all erosion measurements in section 1.1 is consistent with an upper-truncated power law with an upper truncation size, rT, equal to 25 m and a scaling exponent, α, equal to 0.24 (Fig. 5b). A cumulative number-size distribution of all accretion measurements in section 1.1 is consistent with an upper-truncated power law with an upper truncation size, rT, equal to 12 m and a scaling exponent, α, equal to 0.11 (Fig. 5c).
Significance of a Self-Affine Shoreline Change Signal.
The result that shoreline change is self-affine implies that shoreline change is a complex system with feedback mechanisms. There are at least two possible causes of nonlinear feedback, both related to wave action. First, wave heights have been shown to have a fractal distribution (14), which could lead to nonlinear forcing on the beach. Alternatively, wave refraction by a fractal pattern of offshore and nearshore bathymetry may produce a nonlinear distribution of wave energy along the shoreline. A mathematical model has been developed where oblique waves produce fractal coastlines (15), and further work may find that this model also produces nonlinear shoreline change dynamics.
For a self-affine signal with β between 1 and 3, low-frequency contributions dominate over high-frequency contributions (10). The observed shoreline change signal has β values within this range (see Table 1) and therefore can be described as having more power at the low frequency, corresponding to longer distances along shore. Thus, adjacent values are somewhat correlated and large abrupt changes in shoreline position over short distances are less common than gradual changes in shoreline position over long distances. In addition, signals with β values in this range (1 to 3) have long-range persistence (10) indicating long-range correlation within the signal. The autocorrelation of the signal at large lag may be small, but is non-zero (10). The value of shoreline change at one location affects values at both nearby locations and distant locations within the section.
A signal with β greater than one, as observed throughout the study region, is nonstationary (10). For a nonstationary signal, if the signal is subsampled the mean for the entire signal will differ from the means of each of the subsamples. Thus, mean horizontal shoreline change of a section does not describe horizontal shoreline change for shorter lengths of shoreline within the section. For this reason, although the mean changes in land area per meter of coast provided in Table 1 can be used to calculate net change in area within each section (by multiplying the result by the length of the section), these values should not be used to characterize a probable response for a location selected at random along the coast within the section. The cumulative distributions of the change in shoreline location are not Gaussians, with characteristic sizes, and instead are well described by upper-truncated power laws. As discussed above, the upper-truncated power law provides limits to the amount of shoreline change.
The β values change at Cape Hatteras, with β less than or equal to 1.65 in areas 1 and 2 south of Cape Hatteras, and β approximately equal to 2.0 in area 3 north of Cape Hatteras. All study sections have approximately the same variance for the smaller effective filter widths, with a variance between 1 and 2 for the smallest λ values (e.g., Fig. 4). At wider effective filter widths, the variance is greater for the sections in area 3 located north of Cape Hatteras, resulting in the increased β values (Fig. 4). The β values north of Cape Hatteras are essentially equal to those of a Brownian motion. Relative to areas 1 and 2, area 3 has greater persistence and increased long-range correlation. The change in response does not appear to be caused by the presence or absence of dunes, as area 1 has minimal dunes and area 2 has stabilized dunes, and both have β values well below 2.0. The cause for the higher β value in area 3, relative to areas 1 and 2, could be the different strike of the coast, although the difference in coastal process is not known.
Previous work has shown that self-affine signals can result from transport phenomena in which there is a random element and a diffusion element (16). Family (17) found that a random deposition model with surface diffusion produces atomic surface layers with scale-invariant variations of the surface in space and time. Pelletier and Turcotte (16) adopted this model to deposition in sedimentary basins. In their simple stochastic diffusion model, the location where material is introduced to the system is chosen at random. Diffusion occurs by allowing the added material to settle to the lowest adjacent grid site. Once the model reaches a dynamic steady state, the difference between the mean height of the landscape and the elevation of the central site is found to be a self-affine time series with β equal to 1.5 (16). This scaling exponent is similar to the results found south of Cape Hatteras where β ranges between 1.24 and 1.65 and suggests that shoreline change in this region may be modeled as a stochastic diffusion process.
An alternate model for elevation change presented by Pelletier and Turcotte (16) is that elevation of topography changes as a random walk. The deposition and erosion pattern at one point is a white noise. There is no diffusion. The elevation at a single location through time with this model is a signal with β equal to 2. This model was not appropriate for sedimentary basins (16), but is similar to the observations north of Cape Hatteras where β is equal to 1.98 and 2.08.
In conclusion, during the 12-month time interval of the study, the shore-perpendicular change in shoreline position is found to be self-affine for each of six sections analyzed along the Outer Banks of North Carolina. There is a spatial pattern to the scaling exponent, β, with values of 1.65 or less south of Cape Hatteras and values near 2.0 north of Cape Hatteras. Larger β values indicate greater persistence, stronger short range correlations, and a generally smoother signal. A stochastic diffusion model of sediment transport replicates the observed self-affine behavior observed south of Cape Hatteras, whereas a random walk model replicates the signal observed north of Cape Hatteras. Because of the finite nature of the natural system, there are limits in space and time to the self-affine behavior of the system. For example, in section 1.1 during the time interval of the study, the maximum continuous length of coast eroding or accreting is truncated at 7 km. For section 1.1, at any one location the maximum amount of shore-perpendicular erosion and accretion is truncated at 25 m and 12 m, respectively. Further work is needed to determine how these findings apply to different locations and to different sampling durations and climate conditions at the same location. We hypothesize that analysis of shorter or longer time intervals also will indicate that shoreline change is self-affine.
Acknowledgments
We thank Donald Turcotte for encouragement and discussions that improved this manuscript; Bruce Malamud for advice, including the relationship for the effective wavelet width, λ; and Chris Barton for stimulating discussions and thoughtful critical reviews of the manuscript. This work was supported by National Science Foundation Award OCE-9973848 (to S.F.T.), a University of South Florida College of Marine Science Knight Fellowship (to S.M.B.), and the U.S. Geological Survey (to E.E.N.).
Abbreviations
LIDAR, light detection and ranging
This paper results from the Arthur M. Sackler Colloquium of the National Academy of Sciences, “Self-Organized Complexity in the Physical, Biological, and Social Sciences,” held March 23–24, 2001, at the Arnold and Mabel Beckman Center of the National Academies of Science and Engineering in Irvine, CA.
References
- 1.Richardson L. F. (1961) General Systems Yearbook 6, 139-187. [Google Scholar]
- 2.Mandelbrot B. B. (1967) Science 156, 636-638. [DOI] [PubMed] [Google Scholar]
- 3.Berkemeier W., Dolan, R. & Fisher, N. (1984) Shore Beach 52, 3-12. [Google Scholar]
- 4.Nelson E. E., (2001) M.S. Thesis (Univ. of South Florida, St. Petersburg).
- 5.Krabill W. B. & Martin, C. F. (1987) Navigation 34, 1-21. [Google Scholar]
- 6.Flood M. & Gutelius, B. (1997) Photogrammetric Eng. Remote Sensing 63, 327-366. [Google Scholar]
- 7.Sallenger, A. H., Krabill, W., Swift, R., Brock, J., List, J., Hansen, M., Holman, R. A., Manizade, S., Sontag, J., Meredith, A., et al. (2001) J. Coastal Res., in press.
- 8.Fenster M. & Dolan, R. (1996) J. Coastal Res. 12, 294-310. [Google Scholar]
- 9.Grossman A. & Morlet, J. (1984) SIAM J. Math. Anal. 15, 723-736. [Google Scholar]
- 10.Malamud B. D. & Turcotte, D. L. (1999) Adv. Geophys. 40, 1-90. [Google Scholar]
- 11.Burroughs S. M. & Tebbens, S. F. (2001) Pure Appl. Geophys. 158, 741-757. [Google Scholar]
- 12.Burroughs S. M. & Tebbens, S. F. (2001) Fractals 9, 209-222. [Google Scholar]
- 13.Tebbens S. F. & Burroughs, S. M. (2001) Geophys. Res. Lett. 28, 2711-2714. [Google Scholar]
- 14.Feder J., (1988) Fractals (Plenum, New York).
- 15.Ashton A., Murray, A. B. & Arnoult, O. (2001) Nature (London) 414, 296-300. [DOI] [PubMed] [Google Scholar]
- 16.Pelletier J. D. & Turcotte, D. L. (1999) Adv. Geophys. 40, 91-166. [Google Scholar]
- 17.Family F. (1986) J. Phys. A Math. Gen. 19, L441-L446. [Google Scholar]


