

Abstract
Family-based tests of linkage disequilibrium typically are based on nuclear-family data including affected individuals and their parents or their unaffected siblings. A limitation of such tests is that they generally are not valid tests of association when data from related nuclear families from larger pedigrees are used. Standard methods require selection of a single nuclear family from any extended pedigrees when testing for linkage disequilibrium. Often data are available for larger pedigrees, and it would be desirable to have a valid test of linkage disequilibrium that can use all potentially informative data. In this study, we present the pedigree disequilibrium test (PDT) for analysis of linkage disequilibrium in general pedigrees. The PDT can use data from related nuclear families from extended pedigrees and is valid even when there is population substructure. Using computer simulations, we demonstrated validity of the test when the asymptotic distribution is used to assess the significance, and examined statistical power. Power simulations demonstrate that, when extended pedigree data are available, substantial gains in power can be attained by use of the PDT rather than existing methods that use only a subset of the data. Furthermore, the PDT remains more powerful even when there is misclassification of unaffected individuals. Our simulations suggest that there may be advantages to using the PDT even if the data consist of independent families without extended family information. Thus, the PDT provides a general test of linkage disequilibrium that can be widely applied to different data structures
Introduction
Family-based tests for linkage and allelic association (i.e., linkage disequilibrium) have received a great deal of attention in the past several years. The transmission/disequilibrium test (TDT) was proposed to test for linkage disequilibrium in family triads, containing two parents and an affected offspring (Spielman et al. 1993). The TDT was extended to allow for multiple affected offspring while remaining a valid test of linkage disequilibrium (Martin et al. 1997). For late-onset diseases for which parents may not be available, a battery of tests using phenotypically discordant sib pairs has been proposed (Curtis 1997; Boehnke and Langefeld 1998; Spielman and Ewens 1998). Recently, the sibship disequilibrium test (SDT) was proposed to allow for the use of discordant sibships of larger size (Horvath and Laird 1998). A limitation of these tests is that, although they remain valid tests of linkage, they are not valid tests of association if related nuclear families and/or sibships from larger pedigrees are used.
Often data are available for larger pedigrees with multiple nuclear families and/or discordant sibships, and it would be desirable to have a valid test of linkage disequilibrium that can use all potentially informative data, even from extended pedigrees. With this goal, we have developed the pedigree disequilibrium test (PDT) for analysis of linkage disequilibrium in general pedigrees. This test uses data from related nuclear families and discordant sibships from extended pedigrees. Furthermore, the test retains a key property of the TDT, in that it is valid even when there is population substructure.
The difficulty with testing for association with related families, is that genotypes of related individuals are correlated if there is linkage, even if there is no allelic association in the population. Thus, if there is linkage, it is incorrect to treat nuclear families or discordant sibships from extended pedigrees as independent when testing for association. An appropriate strategy is to base the test on a random variable measuring linkage disequilibrium for the entire pedigree, rather than treating related nuclear families or sibships as if they were independent. A measure of linkage disequilibrium is defined for each triad and each discordant sib pair within a pedigree, and the average of the quantities is the measure of linkage disequilibrium for the pedigree. It is these random variables for independent pedigrees that form the basis of the PDT.
In the following sections, we describe the statistic for the PDT. We use computer simulations to demonstrate the validity of the test when the asymptotic distribution is used to assess the significance of the test. We then compare the power of the PDT to the alternative of sampling a single nuclear family or discordant sibship from the pedigrees and applying existing methods. Finally, we examine issues such as robustness of normal approximation to small samples and effect of misclassification of unaffected siblings on power.
Methods
Test Statistic
There are two types of families that may give information about linkage disequilibrium. Informative nuclear families are ones in which there is at least one affected child, both parents genotyped at the marker and at least one parent heterozygous. Informative discordant sibships have at least one affected and one unaffected sibling (DSP) with different marker genotypes and may or may not have parental genotype data. Informative extended pedigrees contain at least one informative nuclear family and/or discordant sibship.
Consider a marker locus with two alleles, M1 and M2. For any family triad, there is a pair of alleles that has been transmitted to the affected child and a pair of alleles that has not been transmitted. Define a random variable for each triad within an informative nuclear family:XT=(#M1 transmitted)-(#M1 not transmitted). Similarly, define a random variable for each DSP within an informative discordant sibship: XS = (#M1 in affected sib) − (#M1 in unaffected sib). Finally, for a pedigree containing nT triads from informative nuclear families and nS DSPs from informative discordant sibships, define a summary random variable:
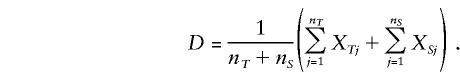 |
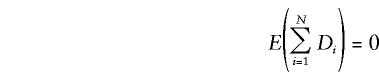
Note that all possible triads from informative nuclear families and all possible DSPs from informative discordant sibships from the pedigree are included in the average. Under the null hypothesis of no linkage disequilibrium, E(XT)=0 for all triads and E(XS)=0 for all DSPs and, consequently, E(D)=0 for any pedigree. If N is the total number of unrelated informative pedigrees in the sample and Di is the summary random variable for the ith pedigree, then, under the null hypothesis of no linkage disequilibrium,
 |
and
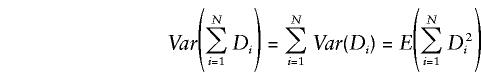 |
Hence, we would expect the statistic
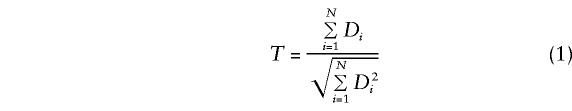 |
to be asymptotically normal, with mean 0 and variance 1, under the null hypothesis of no linkage disequilibrium. The PDT is based on this statistic, T.
Relationship to TDT and Sib-TDT
There are several cases that deserve mention. Suppose that the data consist only of independent family triads. In this case, the TDT can be used to test for linkage disequilibrium (Spielman et al. 1993). The TDT differs from the PDT in that it treats the contribution from heterozygous parents as independent. For the PDT, the triads are the independent units. It is of interest to know how these two tests compare in a sample of family triads.
For a biallelic marker locus, define a random variable for each heterozygous parent of an affected child, Yi = (#M1 transmitted) − (#M1 not transmitted), for i = 1, …, h heterozygous parents. The TDT statistic is
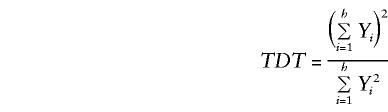 |
The numerators of the TDT statistic and T2 (from equation 1) are the same, but the variance estimates in the denominators differ. Families with a single heterozygous parent contribute equally to both statistics, but variances are estimated differently for families with two heterozygous parents. In particular,
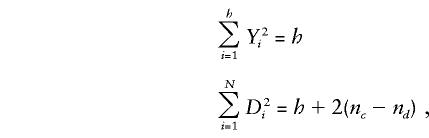 |
where nc is the number of times that two heterozygous parents in a triad transmit the same allele to the affected child (i.e., the number of concordant transmissions) and nd is the number of times that two heterozygous parents in a triad transmit different alleles to the affected child (i.e., the number of discordant transmissions). It follows that
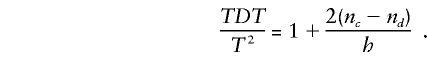 |
Under the null hypothesis of no linkage or no association, E(nc-nd)=0; thus, the two tests are asymptotically equivalent under the null hypothesis.
Under the alternative hypothesis, when there is both linkage and association, the two tests are not necessarily equivalent. For example, suppose that the marker and disease alleles are in complete linkage disequilibrium, so tests are effectively conducted at the disease locus itself. Consider the case of a rare recessive disease locus and no phenocopies such that most affected children have two heterozygous parents and all transmissions are concordant for the disease allele. Then the TDT can be as much as 2 times the size of the PDT statistic, T2, depending on the proportion of families with two heterozygous parents. For a dominant disease model with no phenocopies, families with two heterozygous parents have an affected child homozygous for the disease allele with probability 1/3 or heterozygous with probability 2/3. Thus, discordant transmissions are expected to occur twice as frequently as concordant transmissions, and the PDT statistic will be larger, on average, than the TDT statistic. We have constructed examples in which each test is more powerful than the other. However, in less extreme, and probably more realistic, examples there is likely to be little difference between the outcomes of the two tests.
The second case to consider is if the data consist of nuclear families with multiple affected offspring. The Tsp statistic is an extension of the TDT that allows for multiple affected children (Martin et al. 1997). Calculation of the Tsp statistic requires that one know whether a parent has transmitted the same or different marker alleles to each of their affected children. If both parents have the same heterozygous genotype and there is more than one affected child also having the same heterozygous genotype as the parents, then it is impossible to tell which parent transmitted which allele to each of those children. A strategy that leads to a conservative test is to assume, for these families, that each parent transmitted the same marker allele to each of the affected children having the same genotype as the parents, which provides an upper bound for the estimate of variance (Martin et al. 1997). These families cause no difficulty in the calculation of the PDT statistic, since there is no need to know the transmissions from an individual parent.
A third case that deserves mention is when the sample consists of independent discordant sib pairs. In this case, the PDT is the same as the Sib-TDT and the test of Curtis for a marker locus with two alleles (Curtis 1997; Spielman and Ewens 1998). For a sample of larger discordant sibships, the PDT is equivalent to the Weighted Sibship Disequilibrium Test (WSDT) (Martin et al. 1999).
Population Substructure
One of the motivations behind the development of the original TDT, was the desire to have a test that is valid as a test of allelic association when there is population substructure. Consider a stratified population composed of two or more random mating subpopulations, in which there is no allelic association between marker and disease alleles in the subpopulations. However, there may be differences in disease prevalence and marker allele frequencies that lead to associations in the population at large if the substructure is ignored. The within-family nature of the TDT and the appropriate construction of the variance estimator guarantee that the TDT has the correct significance level provided there is no allelic association within the subpopulations. Similarly, the PDT is also valid as a test of association even if there is population stratification. To see that this is the case, consider the PDT statistic in equation (1). For any pedigree in the sample, E(Di)=0 if there is no allelic association in any of the subpopulations. Thus, for a sample of N pedigrees from the population at large,
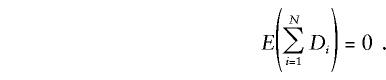 |
The
 |
can be partitioned into the sum of the variances of sums of Di for each of the subpopulations, and each variance is estimated by the sum of squared values for Di for pedigrees in the subpopulation. Thus, as long as there is no allelic association (or no linkage) within each subpopulation, then the PDT statistic is asymptotically normal with mean 0 and variance 1.
Computer Simulations
We used computer simulations to examine the type I error and power of the PDT. Simulations were conducted using the program G.A.S.P. (Wilson et al. 1996) to simulate marker and disease locus genotypes for pedigree members. Both marker and disease loci were assumed to be biallelic, and the loci were assumed to be in linkage equilibrium. Disease phenotypes were simulated based on disease locus genotypes according to a set of specified penetrances: f11, f12, and f22, where fij is the probability that an individual is affected with the disease, given that they carry genotype ij at the disease locus. We considered six genetic models, which are given in table 1. For each model, we assumed that we were looking at a common disease polymorphism having frequency p=0.3. We considered two values for disease prevalence: 30% and 15%. For each value of prevalence, we varied the penetrances to vary the genetic effect; the gene will have the largest effect for models 1 and 4 and smallest for models 3 and 6. In all cases, the disease-locus alleles were assumed to act additively on the penetrance scale. A linked but unassociated marker locus with allele frequency q=0.3 was simulated for type I error analyses. Since we are primarily interested in the properties of the test as a test for association in the presence of linkage, all simulations assumed zero recombination between the marker and disease loci. Type I error tests used data from the marker locus, thus there is no allelic association. Power simulations used data from the disease locus itself, thus there is both complete linkage and association.
Table 1.
Disease Models for Simulations: Penetrances (f11, f12, and f22) and Disease Prevalence
| Model | f11 | f12 | f22 | Prevalence |
| 1 | .39 | .330 | .26 | .30 |
| 2 | .37 | .320 | .27 | .30 |
| 3 | .35 | .315 | .28 | .30 |
| 4 | .22 | .170 | .12 | .15 |
| 5 | .20 | .165 | .13 | .15 |
| 6 | .17 | .155 | .14 | .15 |
Results
The first issue that we examined was how the PDT compares, in extended pedigrees, to standard methods which sample only a single nuclear family or discordant sibship from larger pedigrees to maintain validity as tests of linkage disequilibrium. In particular, we compared the type I error rate and power of the PDT to those of the Sib-TDT (Curtis 1997; Spielman and Ewens 1998), the SDT (Horvath and Laird 1998), and the Tsp test (Martin et al. 1997). The Sib-TDT uses only a single discordant sib pair from each pedigree. To improve power, the pair with maximally different genotypes was chosen for each pedigree (Curtis 1997). The SDT uses data from informative discordant sibships, but only one sibship from each pedigree can be used to ensure validity as a test of association. For our simulations, a random informative discordant sibship was chosen from each pedigree. The Tsp test uses data from informative nuclear families with an arbitrary number of affected offspring. In extended pedigrees, only one nuclear family can be used in a test of linkage disequilibrium, so we selected a random informative nuclear family from each pedigree for analysis in our simulations. Note that, when testing for association, the Tsp test is at least as powerful as the TDT, which can use only one affected offspring per family (Martin et al. 1997). Therefore, we consider only the Tsp test for comparison with the PDT.
For each model, we simulated 5,000 data sets, each of 250 families with structure given in figure 1. Pedigrees with three generations were simulated. Grandparental genotypes were scored as missing, but all other individuals were assumed to have genotypes and phenotypes known. Affection status of pedigree members was random conditional on disease genotype, thus the number of discordant sibships and nuclear families with affected children was variable. Type I error and power comparisons are shown in tables 2 and 3, respectively. In each case, the tests were conducted using the appropriate normal or χ2 critical values for a test with nominal significance level 0.05. A significance level of 0.05 was used in our simulations, merely for convenience. In practice, a more stringent significance level may be desired, particularly when tests are conducted at multiple marker loci. On the basis of 5,000 repetitions, the approximate standard error for the estimate of type I error rate is 0.003, assuming that the tests are estimating a type I error rate close to 0.05. The standard errors for estimates of power depend on the true power being estimated, but, for general reference, an upper bound can be obtained by assuming a power of 0.5. For our simulations, this upper bound for standard error is 0.007.
Figure 1.

Structure of extended pedigrees used in simulations.
Table 2.
Estimates of Type I Error for Four Different Tests with Nominal Significance Level .05, on the Basis of 5,000 Replicates of 250 Extended Pedigrees
|
Estimated Type I Error of |
||||
| Model | Sib-TDTa | Sib-TDTb | Tspb | PDT |
| 1 | .0456 | .0482 | .0328 | .0566 |
| 2 | .0508 | .0478 | .0318 | .0464 |
| 3 | .0538 | .0480 | .0338 | .0480 |
| 4 | .0534 | .0514 | .0416 | .0490 |
| 5 | .0494 | .0474 | .0424 | .0478 |
| 6 | .0570 | .0496 | .0404 | .0510 |
Sampling the most genotypically different DSP from each pedigree.
Sampling a single nuclear family/sibship randomly from each pedigree.
Table 3.
Estimates of Power for Four Different Tests with Nominal Significance Level .05, on the Basis of 5,000 Replicates of 250 Extended Pedigrees
|
Estimated Power of |
|||||
| Model | No. of Affected Sibs per Pedigree | Sib-TDTa | Sib-TDTb | Tspb | PDT |
| 1 | 4.5 | .6626 | .4814 | .6042 | .9064 |
| 2 | 4.5 | .4348 | .2816 | .3788 | .6764 |
| 3 | 4.5 | .2408 | .1600 | .1972 | .3960 |
| 4 | 2.5 | .7538 | .6240 | .7264 | .8996 |
| 5 | 2.5 | .4480 | .3420 | .4270 | .5944 |
| 6 | 2.5 | .1172 | .1018 | .1198 | .1616 |
Sampling the most genotypically different DSP from each pedigree.
Sampling a single nuclear family/sibship randomly from each pedigree.
The type I error estimates are close to the nominal level for the Sib-TDT, SDT, and PDT tests. However, the Tsp test is consistently conservative. This was expected, since the Tsp test was constructed to be conservative to deal with ambiguity of transmissions from parents to multiple affected children, as discussed previously. For the models with lower prevalence, the test is less conservative, which is the result of having fewer nuclear families with multiple affected children.
Power estimates in table 3 show that the PDT is more powerful than the other tests for all of the models examined. For models 1, 2, and 3, the PDT is substantially more powerful than the other tests, with the greatest differences in powers being between the PDT and the SDT. For models 4, 5, and 6, the PDT was still more powerful than the other tests, but the gains were less than in the higher-prevalence models. We show in table 3, the average number of affected siblings in each pedigree from our simulations. As would be expected, the higher-prevalence models (1, 2, and 3) have, on average, more affected siblings in each pedigree than do the lower-prevalence models (4, 5, and 6); thus, there is more extended-family data for the PDT to take advantage of.
Although the prevalences used in our simulations admittedly are high for most diseases, they are not unrealistic for common diseases such as osteoarthritis and cardiovascular disease among older individuals. Use of high prevalence allows us to model a common susceptibility allele with low penetrance and a high phenocopy rate, as is expected for complex diseases, while assuring that many families will contain multiple affected individuals. As is demonstrated in table 3, as prevalence decreases, the average number of affected individuals in each pedigree decreases and the power of the PDT becomes more similar to the other tests. Unless the recurrence risk to relatives is high or families are ascertained on the basis of having multiple affecteds, one is unlikely to find multiple affected relatives in an extended pedigree for diseases with low prevalence, and consequently there will be fewer additional data for use in the PDT.
It makes sense that the PDT is more powerful than the other tests examined here in extended families when there are additional data for the PDT to use. However, it is not clear how the PDT compares to the other tests when there is not extended-family data, but only data on independent nuclear families or sibships. Would we do well to use the PDT in this situation? To begin to examine this question, we simulated nuclear families with parents and two or five offspring in each family. The data were analyzed by means of the Tsp test and the PDT, using the parental transmission information. To address the case in which parental data are unavailable, we also analyzed the sib data with the Sib-TDT, SDT, and PDT assuming that there were no parental data. Simulations were conducted under models 1 and 4 and are based on data sets of 500 nuclear families in each of 5,000 replicates. All tests used the asymptotic approximations to assess significance, assuming a nominal significance level of 0.05.
Estimates of power for the different tests in nuclear families are shown in table 4. The first two rows present the cases for which there are only two siblings in each family. It can be seen that, in this case, if parental genotype data are available, use of the parental data in the Tsp test or the PDT gives higher power than the sib-based tests (SDT or Sib-TDT) or the PDT not using the parental data. Furthermore, with parental data, the Tsp test and PDT have comparable power. It is important to note that our previous simulations showed that generally the Tsp test will be conservative and may have lower type I error than the PDT (table 2), although for families with only two offspring, we found that type I error is very close to the nominal level (data not shown). If parental genotype data are unavailable, then, with two sibs per family, the PDT is equivalent to the Sib-TDT, and the SDT has comparable power. This case of two sibs per family is that examined theoretically by Horvath and Laird (1998), in which they showed that the SDT and Sib-TDT often had similar powers, with neither being uniformly more powerful than the other.
Table 4.
Estimates of Power for Different Tests with Nominal Significance Level .05 on the Basis of 5,000 Replicates of 500 Nuclear Families Having Two and Five Offspring, Using Models 1 and 4. Analysis Conducted with and without Parental Genotype Information
|
Estimated Power for Test |
||||||
| With Parents |
Without Parents |
|||||
| No. ofSibs and Model | No. of Affected Sibs per Pedigree | Tsp | PDT | Sib-TDTa | SDT | PDT |
| 2: | ||||||
| 1 | 1.2 | .3988 | .3858 | .3032 | .3000 | .3032 |
| 4 | 1.1 | .4412 | .4398 | .2844 | .2798 | .2844 |
| 5: | ||||||
| 1 | 1.8 | .7462 | .8134 | .6730 | .7054 | .8294 |
| 4 | 1.4 | .7926 | .7920 | .6948 | .6986 | .7820 |
Sampling the most genotypically different DSP from each pedigree.
For families with five siblings, when parents are used, the estimate of power for the PDT is larger than for the Tsp test for model 1, but the estimate of powers for the two tests are similar for model 4. Again, it is important to keep in mind that the Tsp test is expected to have lower type I error than the PDT, particularly when there are many families with multiple affected siblings. For example, in simulations of five siblings per family for model 1, we obtained an estimate of type I error of ∼0.034 for the Tsp test, using a nominal level of 0.05. Thus, the lower power of the Tsp test compared with that of the PDT, for model 1, with an average of about two affected siblings per family, may be the result of the Tsp test being conservative. For analyses that do not use parental data, the powers of the Sib-TDT and the SDT are similar, and the PDT is more powerful than both of those tests. It is not surprising that the Sib-TDT is less powerful when there are multiple sibs, since it can only use a single discordant pair from a sibship. However, the SDT was specifically constructed to use multiple siblings. The SDT is based on the sign of the difference between the number of times a particular allele occurs in affected siblings and the number of times it occurs in unaffected siblings; however, using the sign of this difference alone may not capture all of the information. The PDT uses the magnitude as well as the sign, which can increase power. This has been noted previously for the WSDT, which is equivalent to the PDT in independent discordant sibships (Martin et al. 1999). These results demonstrate that even if there are no extended pedigrees so that the same data are used in the different tests, it may still be preferable to use the PDT. Interestingly, for the larger sibships, it appears to make little difference in the power of the PDT if parental data are used or not, which suggests that if parents are unavailable, this can be compensated for by sampling large sibships. Similar observations have been made also for application of family-based tests to quantitative traits (Monks and Kaplan 2000).
Type I error estimates for the PDT based on 250 extended pedigrees were all close to the nominal level (table 2); however it is important to examine the validity of the test for smaller samples when the asymptotic distribution is assumed. This is particularly important for the PDT in extended pedigrees, since the random variables, Di, will not necessarily have the same variances if pedigrees have different structures. Thus, one might question the accuracy of the variance estimate used in the PDT statistic. To examine this, we simulated 10,000 data sets with N=250, 100, 50, and 25 families, with structure given in figure 1 and using model 1. Recall that affection status is random conditional on disease locus genotype for our simulations, so the simulated pedigrees will have variable structure with regard to the number and relationships of informative nuclear families and discordant sibships.
Table 5 shows estimates of type I error for the PDT and other tests using the asymptotic critical values for nominal significance level 0.05 for different sample sizes. It can be seen that the asymptotic approximations are quite robust, even for samples as small as 25 pedigrees. The exception is the Tsp test, which is conservative, even for large samples. For these simulations, there were about 4.5 affected sibs per pedigree on average, so there is potentially a fair amount of information in each pedigree. However, the independent units are the pedigrees; thus, there are few independent observations that go into the statistic, and the robustness is somewhat surprising. It is noteworthy that use of the lower-prevalence model (model 4) gave similar results, although the estimates of type I error are somewhat smaller than the nominal level for small numbers of families (data not shown). This shows that, even with only about three affected sibs per pedigree, the asymptotic approximations work well, being only slightly conservative for small samples.
Table 5.
Estimates of Type I Error for Four Different Tests with Nominal Significance Level .05 on the Basis of 10,000 Replicates of 25, 50, 100, and 250 Extended Pedigrees
|
Estimated Type I Error for |
||||
| No. of Extended Pedigrees | Sib-TDTa | SDTb | Tspb | PDT |
| 25 | .0477 | .0498 | .0344 | .0490 |
| 50 | .0517 | .0504 | .0356 | .0500 |
| 100 | .0504 | .0516 | .0300 | .0488 |
| 250 | .0556 | .0485 | .0338 | .0512 |
Sampling the most genotypically different DSP from each pedigree.
Sampling a single nuclear family/sibship randomly from each pedigree.
Because age at onset is variable, one runs the risk of misclassifying individuals as unaffecteds, because they may later become affected. We conducted simulations to examine the impact of such misclassification on the power of the PDT and other tests considered here. Misclassification was introduced into our simulations by allowing affected individuals to be misclassified as unaffected with probability ρ. Misclassification was independent of genotype and has the effect of reducing the penetrances by a factor of (1−ρ). Table 6 shows estimates of power for the PDT and other tests for models 1 and 4. Estimates were based on 5,000 replicate data sets with extended pedigrees with the structure given in figure 1. The total number of pedigrees simulated for each model was chosen so that we would generate an average of 150 pedigrees having at least one affected sibling.
Table 6.
Estimates of Power for Four Tests Allowing for Misclassification of Affecteds as Unaffecteds with Probability ρ. Nominal Significance Level is .05, and Estimates are Based on 5,000 Replicates with an Average of 150 Extended Pedigrees with at Least One Affected Sibling
|
Estimated Power for |
||||||
| Model | ρ | No. of Affected Sibs per Pedigree | Sib-TDTa | SDTb | Tspb | PDT |
| 1 | 0 | 4.5 | .4526 | .3058 | .3828 | .7088 |
| .1 | 4.1 | .4078 | .2872 | .3654 | .6480 | |
| .3 | 3.3 | .3424 | .2724 | .3236 | .5296 | |
| .5 | 2.5 | .2948 | .2314 | .2674 | .4134 | |
| 4 | 0 | 2.5 | .5718 | .4528 | .5406 | .7438 |
| .1 | 2.3 | .5384 | .4290 | .5026 | .6848 | |
| .3 | 2.0 | .4978 | .4132 | .4520 | .6164 | |
| .5 | 1.6 | .4622 | .4024 | .4174 | .5634 | |
Sampling the most genotypically different DSP from each pedigree.
Sampling a single nuclear family/sibship randomly from each pedigree.
In table 6, we see that all the tests lose power as the rate of misclassification increases; however, the PDT remains more powerful than the other tests that we consider. It is important to notice that even the Tsp test, which does not use unaffected siblings, loses power when there is misclassification. Misclassification has two effects on the makeup of the samples that influence power. One effect is that, as misclassification increases, the number of affected individuals in our samples decreases. This results in fewer affected individuals per pedigree. The reduction in the number of affecteds causes power to decrease for all of the tests, including the Tsp test. Power decreases more rapidly for the higher-prevalence model (model 1) than for the lower-prevalence model (model 4), since the number of affected siblings per pedigree decreases more dramatically for the higher-prevalence model. For example, the average number of affected siblings per pedigree decreases from 4.5 to 2.5 for model 1 and from 2.5 to 1.6 for model 4 as ρ goes from 0 to 0.5. The second effect of the misclassification is that some of the unaffecteds are actually misclassified affecteds, and, hence, tests comparing genotypes of affected and unaffected siblings will be biased toward the null hypothesis. It is clear that substantial misclassification can have a serious impact on the power of family-based association tests, but our simulations demonstrate that, even with misclassification, it is still desirable to use the PDT to take advantage of extended-family data.
Discussion
The motivation for developing the PDT was that, often, extended pedigree data are available to us, and it would be desirable to use all of that data in a test for marker/disease association. Although there are many good tests available for use in independent nuclear families, there has been little discussion of association testing in larger pedigrees. Standard tests require selection of a single nuclear family or discordant sibship from extended pedigrees. Clearly, this is less than optimal, since it discards data. Furthermore, results for a data set may vary, because of the random selection of nuclear families or sibships for inclusion. The PDT is a test for linkage disequilibrium that uses all of the informative data in pedigrees, regardless of their size.
Our intention was to provide a test to take advantage of the pedigree data that we may be collecting for use in other analyses, such as testing for linkage. We are not necessarily advocating the collection of large pedigrees for association studies. Though optimal family size is an important question, we have not addressed the issue of study design in this work. The choice between large and small families depends on many factors. Not only is relative statistical power a consideration, but factors such as ease in ascertainment, disease prevalence, age of onset, and other types of analyses to be conducted must be taken into account.
We demonstrated that when affecteds are misclassified as unaffecteds, the PDT and the other family-based tests of association examined here lose power. However, we found that the PDT still remains more powerful than the other tests when extended family data is available. There are steps one can take to improve one's chances of using true unaffecteds; for example, one could analyze only older unaffected individuals. The PDT is constructed to give equal weight to informative triads and discordant sib pairs. If misclassification of unaffecteds is a large concern for the disease under study, it may be wise to give a smaller weight to the discordant sib pairs than to triads. The PDT statistic is easily modified by use of a weighted average of contributions of triads and discordant sib pairs within a pedigree.
Although we did not address it here, it is possible that misclassification may go in the other direction, with unaffecteds being misclassified as affecteds. This might happen if, for example, different syndromes have similar symptoms, making differentiating diagnoses difficult. It is expected that this type of misclassification would also lead to a loss of power—and the loss may be even greater, since families are ascertained through affected individuals. Here, again, it may be possible to apply a weighting function to the PDT, giving lower weight to DSPs in which the diagnosis of the affected sibling is uncertain.
As it is constructed, the PDT gives larger weight to larger sibships and nuclear families within a pedigree. Nuclear families with more triads or discordant sibships with more DSPs contribute more to the summary random variable for the pedigree than do smaller nuclear families or sibships within the pedigree. However, there is no adjustment in the PDT for different-sized pedigrees that may be used in the analysis. It may be desirable to give more weight to larger pedigrees containing more information in the calculation of the statistic. One possibility would be to base a test on the weighted average of the pedigree summary random variables, where the weight for a pedigree is some increasing function of triads and DSPs contributed by that pedigree. Of course, if one believes that the underlying disease mechanism may be different in multiplex families with many affecteds than in families with smaller numbers of affecteds, then a stratified analysis among the large and small families may be in order.
Although our simulations demonstrate that using the asymptotic approximations to evaluate significance is quite robust, it would be desirable to have a permutation procedure that allows us to derive empirical P values when the appropriateness of asymptotic distributions may be in question. It is simple to see how one might permute the data to derive a test of linkage in larger pedigrees simply by randomly permuting which allele is transmitted from parents to children. However, it is not clear how to permute the data to simulate the null hypothesis of no allelic association. It is essential that a test of allelic association allow for the possibility that there is linkage; thus, the permutation procedure must correctly preserve correlations between transmissions of individuals within a pedigree. It is not clear whether a simple permutation procedure can be developed for this purpose in general pedigrees.
All of the simulations presented here considered a marker locus with two alleles. Such explorations are appropriate, given the emphasis on developing single nucleotide polymorphisms for use in association studies. However, this does not mean that multiallelic markers will not be used as well. We propose two extensions of the PDT for use with multiallelic markers that are commonly used in multiallelic versions of related tests. The first is to consider each allele versus all of the others and calculate a value for the PDT statistic for each allele. Multiple testing will be an issue since a test is conducted for each allele, and this should be accounted for in assessing significance. Alternatively, one can construct a global test by summing the squared PDT statistics for each of the alleles and multiplying the sum by (m-1)/m, where m is the number of marker alleles. Arguments similar to those used for other multiallelic extensions can be used to show that this statistic is approximately chi-squared with m-1 degrees of freedom (Spielman and Ewens 1996; Martin et al. 1997; Monks et al. 1998). Simulations have shown that the approximation does provide a test with type I error close to the nominal level (data not shown).
The PDT was constructed assuming that an informative family triad has genotype data available for both parents, with at least one heterozygous. For markers with multiple alleles, it may be possible to gain information from triads in which there is only a single heterozygous parent and the genotype of the other parent unknown. Curtis and Sham (1995) showed for the TDT that using triads with only one heterozygous parent genotyped could lead to bias, resulting in an inflated type I error rate. This same potential bias applies to the PDT. To avoid bias, Curtis and Sham (1995) suggested to use these triads in the TDT only when the affected offspring has a heterozygous genotype different from the parent. This rule could also be used with the PDT to gain extra information from triads with missing parental data. It may also be possible to implement the method proposed by Knapp (1999) to make inference about missing parental data.
In summary, the PDT provides a simple test for linkage disequilibrium that is valid in general pedigrees. It was our desire to develop a test that is similar in spirit to the original TDT. Like the TDT, the PDT is theoretically intuitive and is not computationally demanding. The test does retain the properties of the original TDT and Sib-TDT; specifically, it is valid as a test of both linkage and association, even when there is population stratification. Our simulations have shown that, when extended-pedigree data are available, substantial gains in power can be attained by using the PDT rather than existing methods that use only a subset of the data. In fact, our simulations suggest that there may be advantages to using the PDT even if the data consist of independent families without extended-family information. Thus, the PDT provides a general test of linkage disequilibrium that can be widely applied to different data structures.
Software for conducting the PDT in general pedigrees is available from http://wwwchg.mc.duke.edu.
Acknowledgments
We are grateful for the support and encouragement of Dr. Margaret Pericak-Vance and for the many discussions of this work with Drs. Bill Scott and Beth Hauser at Duke Center for Human Genetics. We also thank two anonymous reviewers for their insightful comments, which helped to make this a better manuscript.
References
- Boehnke M, Langefeld CD (1998) Genetic association mapping based on discordant sib pairs: the discordant alleles test (DAT). Am J Hum Genet 62:950–961 [DOI] [PMC free article] [PubMed] [Google Scholar]
- Curtis D (1997) Use of siblings as controls in case-control association studies. Ann Hum Genet 61:319–333 [DOI] [PubMed] [Google Scholar]
- Curtis D, Sham PC (1995) A note on the application of the transmission disequilibrium test when a parent is missing. Am J Hum Genet 56:811–812 [PMC free article] [PubMed] [Google Scholar]
- Horvath SM, Laird NM (1998) A discordant-sibship test for disequilibrium and linkage: no need for parental data. Am J Hum Genet 63:1886–1897 [DOI] [PMC free article] [PubMed] [Google Scholar]
- Knapp M (1999) The transmission/disequilibrium test and parental-genotype reconstruction: The reconstruction-combined transmission/disequilibrium test. Am J Hum Genet 64:861–870 [DOI] [PMC free article] [PubMed] [Google Scholar]
- Martin ER, Kaplan NL, Weir BS (1997) Tests for linkage and association in nuclear families. Am J Hum Genet 61:439–448 [DOI] [PMC free article] [PubMed] [Google Scholar]
- Martin ER, Monks SA, Warren LL, Kaplan N L (1999) A weighted sibship disequilibrium test for linkage and association in discordant sibships. Am J Hum Genet Suppl 65:A434 [DOI] [PMC free article] [PubMed] [Google Scholar]
- Monks SA, Kaplan NL (2000) Removing the sampling restrictions from family-based tests of association for a quantitative trait locus. Am J Hum Genet 66:576–592 [DOI] [PMC free article] [PubMed] [Google Scholar]
- Monks SA, Kaplan NL, Weir BS (1998) A comparative study of sibship tests of linkage and/or association. Am J Hum Genet 63:1507–1516 [DOI] [PMC free article] [PubMed] [Google Scholar]
- Spielman RS, Ewens WJ (1996) The TDT and other family-based tests for linkage disequilibrium and association. Am J Hum Genet 59:983–989 [PMC free article] [PubMed] [Google Scholar]
- Spielman RS, McGinnis RE, Ewens WJ (1993) Transmission test for linkage disequilibrium: the insulin gene region and insulin-dependent diabetes mellitus (IDDM). Am J Hum Genet 52:506–516 [PMC free article] [PubMed] [Google Scholar]
- Spielman R, Ewens W (1998) A sibship test for linkage in the presence of association: The sib transmission/disequilibrium test. Am J Hum Genet 62:450–458 [DOI] [PMC free article] [PubMed] [Google Scholar]
- Wilson AF, Bailey-Wilson JE, Pugh EW, Sorant AJM (1996) The genometric analysis simulation program (G.A.S.P.): a software tool for testing and investigating methods in statistical genetics. Am J Hum Genet Suppl 59:A193 [Google Scholar]