Abstract
Affected sibling pairs are often the design of choice in linkage-analysis studies with the goal of identifying the genes that increase susceptibility to complex diseases. Methods for multipoint analysis based on sibling amount of sharing that is identical by descent are widely available, for both autosomal and X-linked markers. Such methods have the advantage of making few assumptions about the mode of inheritance of the disease. However, with this approach, data from the pseudoautosomal regions on the X chromosome pose special challenges. Same-sex sibling pairs will share, in that region of the genome, more genetic material identical by descent, with and without the presence of a disease-susceptibility gene. This increased sharing will be more pronounced for markers closely linked to the sex-specific region. For the same reason, opposite-sex sibling pairs will share fewer alleles identical by descent. Failure to take this inequality in sharing into account may result in a false declaration of linkage if the study sample contains an excess of sex-concordant pairs, or a linkage may be missed when an excess of sex-discordant pairs is present. We propose a method to take into account this expected increase/decrease in sharing when markers in the pseudoautosomal region are analyzed. For quantitative traits, we demonstrate, using the Haseman-Elston method, (1) the same inflation in type I error, in the absence of an appropriate correction, and (2) the inadequacy of permutation tests to estimate levels of significance when all phenotypic values are permuted, irrespective of gender. The proposed method is illustrated with a genome screen on 350 sibling pairs affected with type I diabetes.
Introduction
In recent years, many genes causing or increasing susceptibility to diseases have been identified. Although most successes have been for Mendelian disorders, more investigators are performing genomewide screening to detect genes associated with complex traits (e.g., see Blouin et al. 1998; Cornelis and al. 1998; Hager et al. 1998; Mein et al. 1998; Reich et al. 1998; Ghosh et al. 1999; Kehoe et al. 1999; Philippe and al. 1999). In a genome scan, a large set of markers is typed on all 22 autosomal chromosomes, in addition to some markers on the X and Y chromosomes. Methods to perform multipoint analysis of genome-scan data are widely available (Kruglyak and Lander 1995; O’Connell and Weeks 1995; Kruglyak et al. 1996; Morton 1996; Kong and Cox 1997; Almasy and Blangero 1998; ASPEX), both for autosomal and for X-linked markers. However, markers in the pseudoautosomal regions (Strachan and Read 1996) pose a special challenge. Even though their transmission is similar to that of markers in the autosomal regions, males are more likely to receive the allele linked to the Y chromosome from their father, whereas females are more likely to receive the allele linked to the father's X chromosome; this is most extreme for markers nearer to the sex-specific region. Therefore, one would expect an increased identity-by-descent (IBD) sharing among same-sex pairs, whereas opposite-sex pairs should be expected to show a decreased sharing, regardless of whether a disease-susceptibility gene is present in the pseudoautosomal (XY) regions. Traditional sib-pair methods for qualitative traits compare the average IBD sharing between affected relatives; a sharing greater than that expected under the hypothesis of no linkage indicates the possible presence of a disease-susceptibility gene. When analyzing the pseudoautosomal regions, one must take into consideration that the expected sharing depends on the following: the sex of the siblings forming the pair; θm, the male recombination fraction between the marker and the sex-specific region; and the presence or absence of a disease-susceptibility gene in the pseudoautosomal region. Failure to take the sex into consideration may lead to false-positive or false-negative results; for example, if the study sample has an excess of sex-concordant pairs, an increased sharing might be interpreted as indicating the presence of a disease-susceptibility gene. The opposite scenario also is true; if an excess of sex-discordant pairs are present, one may fail to detect a gene by using methods for autosomal markers without taking into account that the markers are located on the pseudoautosome. Ott (1986) proposed ways of using parametric-linkage software to correctly analyze pseudoautosomal data, but no nonparametric equivalent for allele-sharing methods is available. The need for such methods is apparent from the numerous studies of schizophrenia that look at potential association with the XY region (Collinge et al. 1991; Asherson et al. 1992; Gorwood et al. 1992; Wang et al. 1993; Barr et al. 1994; Crow et al. 1994; d’Amato et al. 1994; Maier et al. 1994; Kalsi et al. 1995); an excess of same-sex affected pairs has been observed in a few studies (Collinge et al. 1991; Asherson et al. 1992; Gotwood et al. 1992), which has been interpreted as an indication of the presence of a schizophrenia-susceptibility locus in the pseudoautosomal region. Although parametric methods have been used in this context, when affected sibling pairs and nonparametric analysis were used, it was usually under the assumption that the marker was unlinked to the sex-specific region (Collinge et al. 1991), thus “justifying” the use of methods for autosomal data. However, failure to take into account the fact that the markers analyzed are linked to the sex region in a sample with excess sex concordance leads to inflation in the LOD score. Therefore, it is not surprising that many linkage studies (Asherson et al. 1992; Wang et al. 1993; Barr et al. 1994; Maier et al. 1994; Kalsi et al. 1995), with and without excess sex concordance among sibling pairs, have failed to replicate significant results found by other groups. The pseudoautosomal region also has been implicated in male homosexuality, by Hamer et al. (1993). In their article, they analyzed only the maternal transmissions, to avoid bias. This is a valid method, but it ignores valuable information from the paternal transmissions, which leads to a less powerful approach. We present in this article methods to properly account for the inequality in sharing among same- and opposite-sex sibling pairs when one is analyzing pseudoautosomal markers, using both paternal and maternal genetic information.
Methods
A common approach to linkage analysis using affected sibling pairs involves comparing the number of alleles shared IBD between affected siblings versus the expected sharing under the null hypothesis that there is no linkage to a disease-susceptibility locus. For an autosomal marker unlinked to any disease loci, siblings will share either zero alleles or one allele maternally (paternally), with probability 1/2. Therefore, siblings will share zero, one, or two alleles IBD with probabilities 1/4, 1/2, and 1/4, respectively. An increase in IBD sharing over what is expected under the null hypothesis is taken as evidence for linkage to a disease-susceptibility locus. For markers on the X chromosome outside the pseudoautosomal regions, same-sex pairs will share one allele IBD paternally whereas opposite-sex pairs will share no paternal alleles. Hence, same-(opposite-)sex pairs will share either one or two (zero or one) alleles IBD, with probability 1/2 each. Again, a sharing greater than what would be expected is taken as evidence for an X-linked locus affecting the trait of interest.
A similar approach, with modifications, can be applied to the pseudoautosomal regions. We develop a likelihood framework to test for the presence of a disease-susceptibility locus in the XY regions. The likelihoods of the observed IBD sharing under the null and alternative hypotheses are derived below, to form a likelihood-ratio test. Under the hypothesis that there are no disease-susceptibility genes in the XY region, the probability that a pair shares either zero alleles or one allele IBD from the maternally transmitted chromosome in the XY portion of the genome is 1/2. However, the probability of sharing either zero alleles or one allele on the paternally transmitted chromosome depends on the θm value between the marker and the sex-specific region and on the sex of the members of the pair; for same- and opposite-sex pairs, the probability of sharing one allele IBD from the father is Ψ2 and 1-Ψ2 respectively, where Ψ2=θ2m+(1-θm)2 . If we let αij be the null-hypothesis probability of sharing i paternal and j maternal alleles IBD, and let the superscripts “S” and “O” denote “same sex” and “opposite sex,” respectively, we can rewrite (in notation similar to that of Risch [1990b]) the probabilities, as follows:
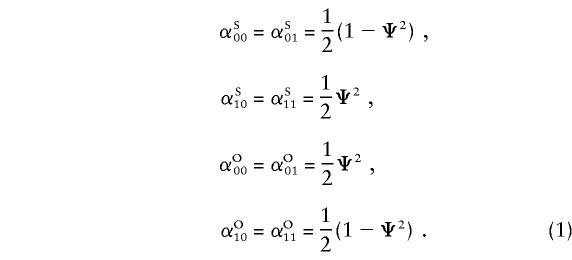 |
The number of same-sex pairs sharing i paternal alleles and j maternal alleles follows a multinomial distribution, with parameters αSij; the same holds true for opposite-sex pairs, with parameters αOij.
Single Major Locus
We use the notation of Risch (1990a) to define the alternative hypothesis. We assume a single major locus influencing the trait and located on the pseudoautosomal regions, with genetic effect λR=KR/K, where KR denotes the recurrence risk to a type-R relative (R = “S,” for siblings; “M,” for MZ twins; and “O,” for parent/offspring) of an affected individual and where K is the population prevalence. In the following subsections, the assumption of a single locus will be relaxed, and equivalent methodology will be derived for a general multilocus model.
For a trait linked to the pseudoautosome, the recurrence risk for siblings of an affected individual depends on the sex of the pair members, since same-sex sibling pairs are more likely to share the disease-influencing alleles IBD than are opposite sex-pairs. Hence, λSS≠λOS ; again, the superscripts “S” and “O” denote same- and opposite-sex pairs, respectively. The relationship between λSS and λOS depends on the θm value between the trait locus and the sex-specific region and is defined in Appendix A. Let λO and λM be the ratio of the recurrence risk to the prevalence, for offspring and monozygotic twins, respectively. Then, under the alternative hypothesis, the number of pairs sharing i paternal and j maternal alleles is still multinomial, but with the following parameters (see Appendix A):
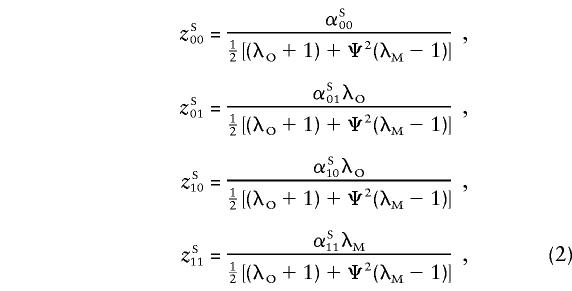 |
and
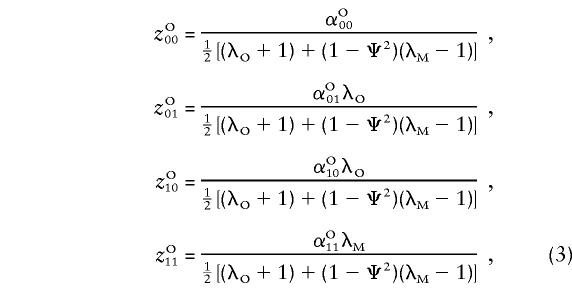 |
where  and
and  .
.
For the simpler case of no dominance variance, λM-1=2(λO-1), and the equations above depend on only two parameters, λO and Ψ2 (or θm).
A likelihood ratio is formed to test the following hypotheses: H0:λO=λM=1, H1:λO>1 or λM>1, λM⩾λO⩾1.
Let wk=1 if pair k is of the same sex and 0 otherwise, and let  be the probability that the kth pair shares i paternal and j maternal alleles IBD, as based on the genotyping data and with the sex of the pair members being taken into account. If the data consist of N sibling pairs, the LOD score or logarithm base 10 of the likelihood ratio can be written as
 |
One can calculate  from pkij, where pkij is computed under the assumption that the marker is unlinked to the sex-specific region (θm=.5 or Ψ2=.5), with the following equation (see Appendix B):
 |
The equivalent expression holds true for opposite-sex pairs, with αOij replacing αSij. Note that αij without a superscript is the probability that i paternal and j maternal alleles will be shared IBD for an autosome marker under the null hypothesis and is equal to 1/4 for i=0,1 and j=0,1. If we assume that the distance from the locus being tested and the sex-specific region is known from other sources (Broman et al. 1998), we can maximize the log10 likelihood ratio over all values of λM and λO. Holmans' (1993) triangle constraints reduce to λM⩾λO⩾1and λM⩾(2λO-1). For the case of no dominance variance, λM-1=2(λO-1) and the maximization is computed over a single parameter, λO.
Note that the maximum-likelihood parameters  and
and  obtained via equation (4) estimate the risk, to offspring and an MZ twin of an affected individual, that is attributable to a locus in the XY regions. A significant difference between
  and
and  and other estimates based on epidemiological samples would indicate that a single locus in the pseudoautosomal region does not, by itself, explain the observed familial risks.
The primary purpose of this report is not to estimate λO and λM per se but to provide a model-free approach to the analysis of affected sib pairs, by testing for a significant difference between the sharing probabilities zSij and zOij and their null values αSij and αOij when there is no linkage to the pseudoautosomal regions. As exemplified in the single-locus model, the sharing probabilities in equations (2) and (3) are mathematically related to each other and depend on only two parameters. This is true for all genetic models, and the following reparameterization will be useful for the multilocus model:
 |
The sharing probabilities can be rewritten as
 |
and
 |
The probabilities above can be substituted in equation (4), and the likelihood can be maximized over ξ and η, subject to the constraint η⩾2ξ⩾0, to test the null hypothesis η=ξ=0. In the case of no dominance variance, η=2ξ, and only one parameter needs to be estimated, if it is assumed that Ψ2 is known.
Multilocus Models
The LOD score in the first two lines of equation (4) is valid for any multilocus genetic model having one locus on the pseudoautosomal region. We demonstrate in Appendix C that equations (6) and (7) for the sharing probabilities zSij and zOij are still valid for multilocus models. Accordingly, the approach is model free and, for known θm (or Ψ2), depends only on two parameters, ξ and η. This situation is entirely similar to the analysis of autosomal markers with affected sibling pairs, where the LOD score also depends on two parameters (Risch 1990b; Kruglyak and Lander 1995). The detection of linkage is model free, but, if one wishes to estimate some genetic parameters, such as λS or the risk attributable to a specific locus, a genetic model needs to be assumed. In the pseudoautosomal case, the detection of linkage is model free, and the interpretation of ξ and η is model dependent.
In the case of a single major locus, ξ and η are defined by equation (5). For the multilocus multiplicative model, introduced, by Risch (1990a), as an approximation to genetic epistasis, the overall ratio of the recurrence risk to prevalence is written in terms of the locus specific λ’s, λR=i=1∞λiR. If we assume that locus 1 is on a pseudoautosomal region and that all other loci are unlinked, the parameters can be written as
 |
and
 |
See Appendix D. Note that those parameters are identical to those in equation (5), after the locus-specific λ1O and λ1M are substituted for the overall λO and λM. For the additive model, an approximation to genetic heterogeneity, the overall ratio of the recurrence risk to prevalence is written as the weighted sum of the λ’s at contributing loci:  , where
  . As for the multiplicative model, if it is assumed that the first contributing locus is on a pseudoautosomal region and that all other loci are unlinked, the interpretation of the estimated parameters is as follows:
 |
and
 |
A similar model, which Risch (1990a) has called the “heterogeneity model,” is defined by the following equations: (1-2K+KKR)=i=1L(1-2Ki+KiKiR) and 1-K=i=1L(1-Ki). For such a model, the estimated parameters are
 |
and
 |
The derivations of these equations can be found in Appendix D.
Quantitative Traits
When the phenotype is quantitative, the same inflation of the LOD score can be observed when the Haseman-Elston (HE) method of analysis is used for sibling pairs (Haseman and Elston 1972). This will occur when the mean of the trait of interest differs by gender, with or without the presence of an excess of same-sex pairs. As an example, let the phenotypes for the siblings in pair j be defined as x1j=μ+f1j+e1j and x2j=μ+f2j+e2j, where fij=f if sibling i in pair j is a female, 0 if male. The trait is unlinked to the XY regions but is sex dependent. We will show through simulations as well as analytically that this scenario can lead to the false conclusion of XY linkage for such a trait. Let Yj=(x1j-x2j)2 and let ej=(e1j-e2j)2, with Var(ej)=σ2e. For the traditional HE method, the squared phenotype differences (Y’s) are regressed on the IBD status at one or more markers, to find the trait influencing loci. A statistically significant negative slope is indicative of linkage. Let πj be the IBD status of pair j at a marker located on the XY region at distance Ψ2 from the sex-specific region. If the probability that a sex-concordant pair will be sampled is τ, then, under the assumption that there are no XY-linked susceptibility loci, we can show that
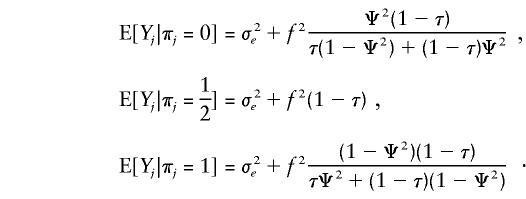 |
Hence, E[Yj|πj] is strictly decreasing in πj, for Ψ2>.5 (XY-linked markers) and f≠0 (sex-dependent trait), so that a linear regression of the Y’s on the π’s would yield a negative slope, which could be falsely interpreted as an indication of XY linkage. In the case of no excess of same-sex pairs (τ= 1/2), the equations reduce to
and β⩽0, with equality holding only if Ψ2=.5 or f=0. Hence, the false conclusion of XY linkage could be reached even in the absence of an excess of same-sex pairs. A simple solution to prevent an excess of false-positive results consists of the use of sex-adjusted phenotypes, since, then, by definition, f=0. Although this adjustment would seem natural with regard to a quantitative trait, the same problem applies to the use of the traditional HE for a qualitative phenotype when affected individuals receive a score of 1 while unaffected have a score of 0. The existence of unequal sex-specific prevalences would again give β<0 under H0, for a marker in the pseudoautosomal regions. Another alternative, which would work well with both qualitative and quantitative phenotypes, is to assess the statistical significance, by means of a permutation test. However, permuting all phenotype values irrespective of sex, as is often done in the literature, would yield an incorrect estimate of the P value, since the sex effect would be destroyed by such a permutation scheme. The correct way to assess the significance of a result would be by permuting the phenotype values within sex categories, to preserve the sex effect. This is illustrated by simulation studies in the Results section.
Results
Simulation Study—Qualitative Traits
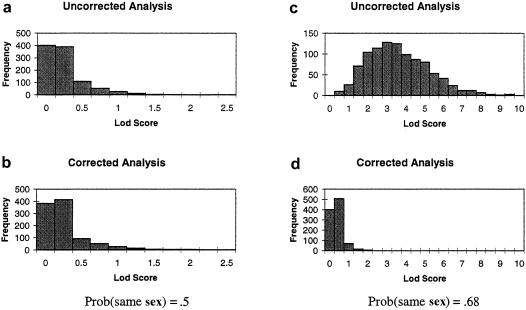
To assess the impact of using the corrected likelihood versus ignoring the sex inequalities in sharing, as is often done in the literature, a simulation study was performed. The transmission of a marker in the XY regions was simulated for 500 nuclear families with two affected offspring each, under the null and the alternative hypotheses of a single major locus in the XY regions. We picked a marker with 10 alleles with frequencies described, in The Genome Database, for DXYS154, an informative marker in the pseudoautosomal regions. To evaluate the LOD-score inflation that can occur when there is an excess of same-sex pairs, the probability of sampling a sex-concordant pair was set to 68% in the second set of simulations. This probability would be achieved if males were four times more likely to be ascertained than females, or vice versa. Each simulation consisted of 1,000 replicates, and the LOD score for each replicate was computed two ways: either under the assumption that the data were autosomal or by use of the corrected method for pseudoautosomal markers that has been described in the present paper. Results are presented in figure 1. When there are no susceptibility loci and the sample has similar numbers of same- and opposite-sex pairs (fig. 1a and b), the corrected-LOD-score (LODc) distribution does not differ much from the uncorrected distribution. However, when an excess of same-sex pairs is present, the uncorrected LOD score (LODu) is in the range 0.2–9.4 (fig. 1c), with 54.7% of the replicates yielding LOD scores >3. On the other hand, none of the 1,000 corrected LOD scores (fig. 1d) in the presence of an excess of same-sex pairs had a LOD score >3.
Figure 1.
Results from 1,000 replicates of a simulated marker on the pseudoautosomal regions unlinked to the disease locus, for LODu and LODc, when no excess sex concordance is present (a and b) and when the probability of sampling a sex-concordant pair is set at 68% (c and d).
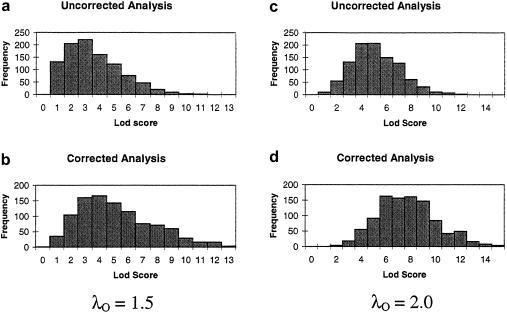
When there is no sex distortion, even though the type-I error will not be inflated, the power can be improved by using the corrected-LOD-score method. To illustrate this point, the simulations under the alternative hypothesis were performed under the assumption that there was no excess of same-sex pairs; that is, the probability of sampling a sex-concordant pair was set to 1/2. The dominance variance for the single-locus model was set to 0. Two sets of 1,000 simulations were done, one with λO=1.5 and the other with λO=2.0. Results are presented in figure 2. When the corrected method was used, the probability of a LOD score >3.0 increased from 44.2% to 70.0%, in the case of λO=1.5, and from 80.3% to 97.8%, in the case of λO=2.0.
Figure 2.
Results from 1,000 replicates of a simulated marker on the pseudoautosomal regions linked to the disease locus, at a distance of 5 cM, for uncorrected and corrected LOD scores for recurrence risks of λO=1.5 (a and b) and λO=2.0 (c and d). For both simulations, there is no excess of same-sex pairs.
Analysis of 350 Sibling Pairs Affected with Type I Diabetes
Mein et al. (1998) published the results of a genome scan of a set of 356 sibling pairs from the United Kingdom that were affected with type I diabetes, and both a description of the data and the results for all autosomes and the X chromosome can be found in their article. We present here the analysis of five pseudoautosomal region markers, using MAPMAKER/SIBS (this analysis is the LODu method) and the corrected method described in the present article (the LODc method). The θm values for the markers were taken from the genetic maps of the Center for Medical Genetics, Marshfield Medical Research Foundation, and the Cooperative Human Linkage Center; the results are given in table 1. Of the 350 sibling pairs for which genotyping data on the XY-region markers were available, 181 were same-sex pairs and 169 were opposite-sex pairs. Because the numbers of same- and opposite-sex pairs are similar, the multipoint LOD scores obtained from both methods are comparable. For illustration purposes, we computed the LOD score for the 181 same-sex pairs only (table 2). For the four markers closely linked to the sex-specific regions, LODu=23.9–25.8, whereas LODc=0.1–2.6. Using the proper method is crucial when the number of same- and opposite-sex pairs is unbalanced.
Table 1.
Analysis of All 350 Sibling Pairs Affected with Type I Diabetes
| Marker | Ψ2 | LODu | LODc |
| DXYS218 | .600 | .0 | .0 |
| DXYS228 | .998 | .5 | .5 |
| DXYS230 | .998 | .4 | .3 |
| DXYS231 | .998 | .4 | .4 |
| DXYS154 | .906 | 1.2 | 1.3 |
Table 2.
Analysis of 181 Same-Sex Pairs Affected with Type I Diabetes
| Marker | Ψ2 | LODu | LODc |
| DXYS218 | .600 | .9 | .1 |
| DXYS228 | .998 | 23.9 | .3 |
| DXYS230 | .998 | 25.8 | .2 |
| DXYS231 | .998 | 25.7 | .2 |
| DXYS154 | .906 | 25.6 | 2.6 |
Simulation Study—Quantitative Traits
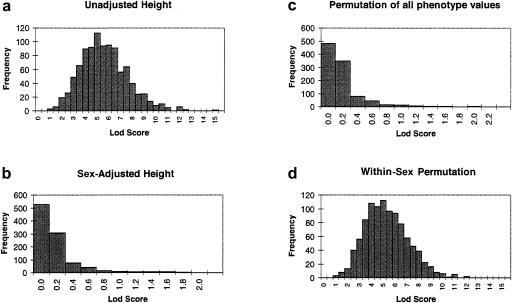
We generated the quantitative phenotype “height” for 500 sibling pairs and a fully informative marker located in the XY region, with θm=.05 but unlinked to the phenotype. The mean heights for males and females were 69 inches (SD = 3) and 63.5 inches (SD = 2.5), respectively. We used the HE method to compute a t-statistic, which we then converted to a LOD score. For 1,000 iterations, the null distribution of the LOD score was in the range 0.77–14.63, with a median of 5.19 (fig. 3a); 89.7% of the replicates gave LOD scores >3, which is an extremely high number of false-positive results. One possible correction involves regressing the trait values on sex, to produce sex-adjusted phenotypes, which are then substituted in the analysis. In the 1,000 replicates, no LOD scores >3 were observed when this correction method was used, indicating an appropriate type-I error rate; see figure 3b.
Figure 3.
Results from 1,000 replicates of a simulated marker on the pseudoautosomal regions unlinked to the quantitative trait “height,” for unadjusted analysis (a), analysis of sex-adjusted phenotypes (b), and for each of 1,000 permutations of the phenotypes, irrespective of sex (c). As can be seen, this estimated null distribution is incorrect, since panel a represents the true null distribution. Results obtained from permutation of the phenotypes within sex (d) give a more appropriate null-distribution reference, which is very similar to the null distribution in panel a.
For the second correction, a permutation test was implemented in two ways, as a nonparametric way of evaluating the statistical significance. Figure 3c shows the values obtained from the common approach of permuting all phenotypes, irrespective of the sex of the pair, from the last replicate of the simulated distribution of the unadjusted score.
Under the null hypothesis of no linkage, LOD-score values in the range of 0.77–14.63 would be compared with this null distribution and would lead to a gross underestimation of the P values and to the conclusion that a gene for height is located in the XY region. A better approach would be to permute the phenotypes within sex groups (fig. 3d). This would lead to more-realistic estimates of both the null distribution and the significance of the observed LOD score.
Discussion
The simulation studies were limited to two-point analyses at the disease-susceptibility loci, with no missing genotyping data. However, the method was applied more generally to multiple markers in the XY regions, to perform multipoint analyses, using five markers from a genomewide screen for type I diabetes. The multipoint-sharing probabilities for the XY regions,  , were computed from the multipoint sharing probabilities, pkij, under the assumption of autosomal linkage (Kruglyak and Lander 1995), and were replaced in the likelihood equations, to yield multipoint LOD scores.
When the sibship size is >2, the corrected LOD score can be computed by using all possible sibling pairs in the likelihood, with or without weighting the pairs by 2/nk, where nk is the size of sibship k. Significance levels may have to be assessed via permutation tests. When, compared with other siblings in the sibship, the proband is more likely to possess susceptibility genes, one may wish to use all independent pairs containing the proband. However, when there is no reason to differentiate between affected individuals, using only independent sibling pairs in which a random index case is used is not recommended, since this method has been shown to be highly dependent on the choice of index cases (Van Eerdewegh et al. 1999).
In the XY regions, the recombination frequencies are much higher in males than in females (Rouyer et al. 1986). Although some genetic software can allow for different male and female recombination fractions, the modified version of MAPMAKER/SIBS that was used for the simulations in the present study assumed equal recombination fractions for males and females in the estimation of pkij. However, the approach proposed here already breaks down the maternal and paternal inheritance and depends only on θm, the genetic distance between the markers and the sex-specific region. Therefore, it could be applied to IBD probabilities obtained by using sex-specific maps. It is to be hoped that software that, in the computation of IBD sharing, takes into account the different recombination rates for females versus males will soon be available.
Sibling-pair methods are now widely used to map complex traits. Markers in the XY region routinely are included in genome scans. An excess of sex-concordant affected sibling pairs is often taken as suggestive of XY linkage. However, the analysis of studies with an excess of same-sex pairs will lead to the conclusion of XY linkage if the proper method is not used. Therefore, it is of the utmost importance to properly account for the expected increased sharing, among same-sex pairs, in the XY region, in order to reach the correct conclusions.
Acknowledgments
We would like to thank Prof. John Todd for making the type 1 diabetes data available to us, and we thank two referees for their constructive comments.
Appendix A:
Let us consider a marker locus in the pseudoautosomal regions. Males will receive the allele linked to the Y chromosome, from their father, whereas females will receive the allele on the X chromosome, unless a recombination occurs. Therefore, under the null hypothesis of no linkage between the trait and that locus, same-sex pairs will share their paternal allele IBD unless there occurs a recombination during meiosis in one of the offspring, but not in both. If the male recombination fraction between the marker and the sex-specific region is θm, we can write the probability of sharing a paternally inherited allele IBD as
where the superscript “S” indicates that the probability holds for same-sex pairs. On the other hand, opposite-sex pairs will share their allele IBD from the father only if one of the offspring, but not the other, is a recombinant; hence, PO(IBD=1)=2θm(1-θm)=1-Ψ2, with the superscript “O” denoting opposite-sex pairs. The probability of sharing zero alleles or one allele from the maternal chromosome is independent of θm and is 1/2. Combining the probability of maternal and paternal IBD sharing yields equations (1). Under the alternative hypothesis that there exists a single major disease-susceptibility gene in the XY region, located at θm from the sex-specific region and with effects λO and λM, we can compute the sharing probabilities at the trait locus, as follows (Risch 1990b):
 |
where λO is the ratio of the recurrence risks to offspring to the population prevalence, λM is the ratio of the recurrence risks to MZ twins, and λSS is the equivalent ratio for siblings, in same-sex pairs. These equations hold true for opposite-sex pairs, with the superscript “O” replacing “S.” Note that λO=λSO=λOO, so that the superscript has been omitted. However, λSS≠λOS under the hypothesis that there exists, in the XY region, a gene influencing the disease. Let fk be the penetrance of genotype k. Then, λR=ΣkΣlpkfkτRklfl/K2, where K=Σkpkfk, pk is the frequency of genotype k, and τRkl is the conditional probability that a relative of type R will have genotype l at the trait locus, given that the index individual has genotype k. Note that τMkl=1 if k=l and 0 otherwise, whereas τOkl>0 only if genotypes k and l share at least one allele in common. This mathematically convenient notation allows one to establish a relation between λSS and λOS, in the following manner. Since, for XY linked loci,
 |
and
 |
we can rewrite
 |
and
 |
Therefore, λSS can be rewritten as
 |
and
 |
Substitution of λSS and λOS in equation (A1), by use of the expressions above, yields the sharing probabilities under the alternative hypothesis. In addition, one obtains λOS=λSS+( 1/2-Ψ2)(λM-1).
Appendix B:
Let  be the probability that the kth pair shares i paternal and j maternal alleles IBD, on the basis of the genotyping data, with the pair members' sex being taken into account, and let pkij be the same probability computed under the assumption that the marker is unlinked to the sex-specific region (θm=.5 or Ψ2=.5). Let αij be the null-hypothesis probability that i paternal and j maternal alleles are shared IBD for an autosomal marker, whereas αSij and αOij are the equivalent probabilities for same- and opposite-sex pairs, for a pseudoautosomal marker (which will depend on the marker distance Ψ2 from the sex-specific region). Then, one can write
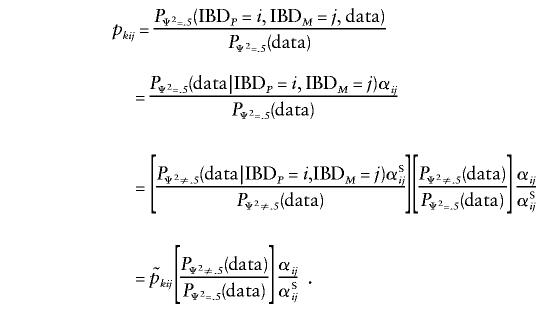 |
The value of the ratio of probabilities (second term) is not known; however, since the probabilities have to sum to 1, we can rewrite this expression as follows:
 |
The equivalent expression holds true for opposite-sex pairs, with αOij replacing αSij. Note that pkij is computed by using multipoint information if available.
Appendix C:
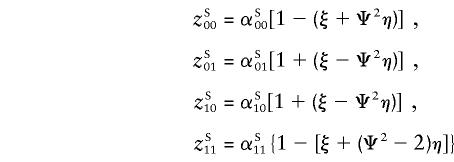
In this appendix, we show that, for general multilocus models, the probability of sharing i paternal and j maternal alleles IBD (zij) for same-sex (superscript “S”) and opposite-sex (superscript “O”) pairs can be expressed as
 |
and
 |
Accordingly, for known θm (or Ψ2), these probabilities depend on only two parameters, ξ and η.
James (1971) introduced a general multilocus model that applies to any number of loci. The model is expressed in terms of additive, dominance, and epistatic sources of variance on an incidence [0,1] scale, sometimes called the “penetrance scale.” Let ViAjD be the variance due to an ith-order interaction of additive components and an jth-order interaction of dominance components (Kempthorne 1957). For two relatives of type R, cR is defined as twice the probability that two alleles drawn at random, one from each of the individuals, will be IBD, and uR is the probability that the relatives share two alleles IBD. For a trait not influenced by genes on the pseudoautosomal regions, the recurrence risk to a relative of type R can be written as (Risch 1990a)
 |
For siblings, cS= 1/2 and uS= 1/4. We can obtain a similar expression if one of the loci affecting the trait of interest, say, locus 1, is on the pseudoautosomal regions and all other loci are unlinked. Let cSS be twice the probability that two alleles drawn at random from the pseudoautosomal locus affecting the trait, one allele from each of the same-sex siblings, will be IBD, and let uSS be the probability that the same-sex siblings share two alleles IBD at the pseudoautosomal locus. Then,
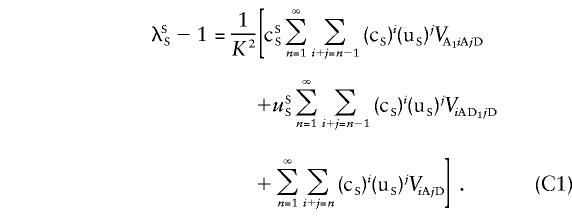 |
All summations  in the previous and subsequent expressions are over all loci except locus 1. In equation (C1), the first term is the covariance between two siblings that involves the additive effect at locus 1, the second term involves the dominance deviation at locus 1, and the last term is the covariance due to all loci other than locus 1. As a shorthand notation, we rewrite equation (C1) as
 |
For opposite-sex siblings, the equation holds when the superscript “S” is replaced by “O.” Note that
 |
and
 |
For opposite-sex pairs, Ψ2 is replaced by 1-Ψ2. If we adopt Risch's (1990a) notation and let Xi=1 if sibling i is affected and 0 otherwise, and if we define IBD=ij to mean that the pairs share i paternal and j maternal alleles IBD at the pseudoautosomal locus, then the sharing probabilities can be written as
 |
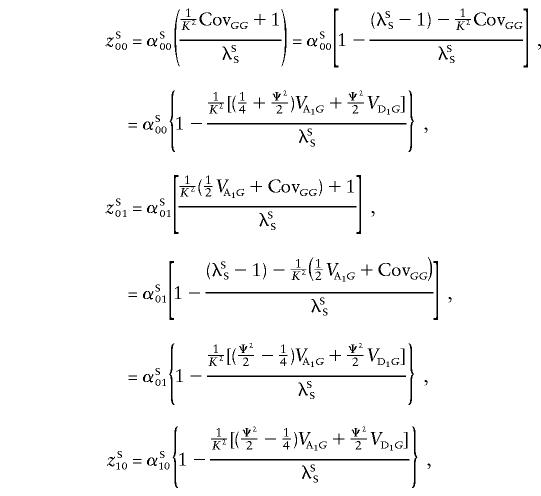
with a similar expression for opposite-sex pairs, with the appropriate superscripts. We note that, given IBD=00, cSS=cOS=uSS=uOS=0; that, given IBD=01 or IBD=10, cSS=cOS= 1/2,uSS=uOS=0; and that, given IBD=11, cSS=cOS=uSS=uOS=1. Accordingly,
 |
and
 |
If we substitute ξ= 1/K2( 1/4VA1G)/λSS and η= 1/K2( 1/2VA1G+ 1/2VD1G)/λSS in the equations for the sharing probabilities above, we get equations (6). To get similar equations for opposite-sex pairs, we note that
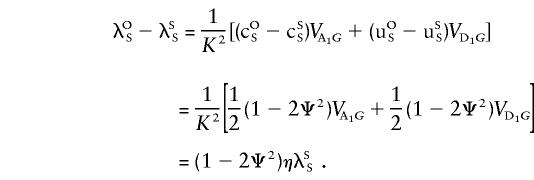 |
Hence, equations (7) are obtained by substituting λSS with λOS=λSS[1+(1-2Ψ2)η] in the sharing probabilities above and by substituting 1-Ψ2 for Ψ2 in the numerators.
Appendix D:
Multilocus Multiplicative Model
The multilocus multiplicative model was introduced by Risch (1990a) as an approximation to genetic epistasis. For such a model with L loci, the overall ratio of the recurrence risk to prevalence is written in terms of the locus-specific λ's, λR=i=1LλiR. If it is assumed that locus 1 is on the pseudoautosomal regions and that all other loci are unlinked, it is easy to see that λSiS=λOiS for i≠1 and λS1S≠λO1S. Following Risch (1990a), we see that equations (2) and (3) still hold but that λS1R and λO1R are substituted for λR; for example,
 |
Other zSij and zOij are similarly derived. Accordingly, equations (6) and (7) are valid with the following definitions of the parameters: ξ=(λ1O-1)/[(λ1O+1)+Ψ2(λ1M-1)] and η=(λ1M-1)/[(λ1O+1)+Ψ2(λ1M-1)]. Therefore, the likelihood ratio and testing procedure derived in the context of a single major locus are applicable to the multiplicative model. The estimated λ’s obtained from maximizing the likelihood ratios are locus specific in the case of a multiplicative model.
Multilocus Additive Model
For an additive model with L loci, locus 1 on the pseudoautosome, and all other loci unlinked, the sharing probabilities (Risch 1990a) for same-sex pairs are
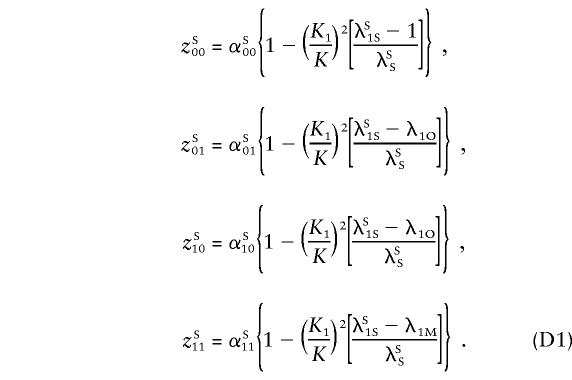 |
The equations hold for opposite-sex pairs, with the superscript “O” replacing the superscript “S.” The locus-specific relationship (see Appendix A) still holds for locus 1; that is,
 |
and
 |
and the overall ratio of the sibling recurrence risks to prevalence can be written as
 |
and
 |
Hence, we can write
 |
Let
 |
and
 |
Substituting equation (D2) into equation (D1) and using the definitions given above for ξ and η yields equations (6) and (7).
Multilocus Heterogeneity Model
The multilocus heterogeneity model is very similar to the additive model, as can be seen below. Using Bayes' rule and following Risch (1990a), we have
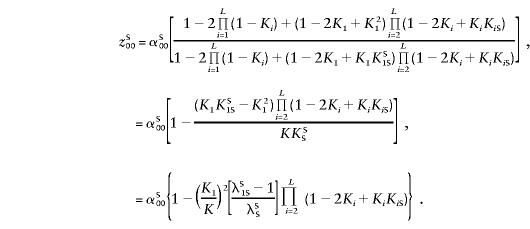 |
Other zSij values are derived similarly:
 |
The relationship between λSS and λOS is similar to that obtained for the additive model:
 |
Hence, reparameterizing the sharing probabilities by using the parameters
 |
and
 |
Electronic-Database Information
URLs for data in this article are as follows:
- ASPEX, ftp://lahmed.stanford.edu/pub/aspex [Google Scholar]
- Center for Medical Genetics, Marshfield Medical Research Foundation, http://www.marshmed.org/genetics
- Cooperative Human Linkage Center, The, http://lpg.nci.nih.gov/CHLC
- Genome Database, The, http://www.gdb.org
- MAPMAKERS/SIBS, ftp://ftp-genome.wi.mit.edu/distribution/software/sibs
References
- Almasy L, Blangero J (1998) Multipoint quantitative trait linkage analysis in general pedigrees. Am J Hum Genet 62:1198–1211 [DOI] [PMC free article] [PubMed] [Google Scholar]
- Asherson P, Parfitt E, Sargeant M, Tidmarsh S, Buckland P, Taylor C, Clements A, et al (1992) No evidence for a pseudoautosomal locus for schizophrenia: linkage analysis of multiply affected families. Br J Psychiatry 161:63–68 [DOI] [PubMed] [Google Scholar]
- Barr CL, Kennedy JL, Pakstis AJ, Castiglione CM, Kidd JR, Wetterberg L, Kidd KK (1994) Linkage study of a susceptibility locus for schizophrenia in the pseudoautosomal region. Schizophr Bull 20:277–286 [DOI] [PubMed] [Google Scholar]
- Blouin JL, Dombroski BA, Nath SK, Lasseter VK, Wolyniec PS, Nestadt G, Thornquist M, et al (1998) Schizophrenia susceptibility loci on chromosomes 13q32 and 8p21. Nat Genet 20:70–73 [DOI] [PubMed] [Google Scholar]
- Broman KW, Murray JC, Sheffield VC, While RL, Weber JL (1998) Comprehensive human genetic maps: individual and sex-specific variation in recombination. Am J Hum Genet 63:861–869 [DOI] [PMC free article] [PubMed] [Google Scholar]
- Collinge J, Delisis LE, Boccio A, Johnstone EC, Lane A, Larkin C, Leach M, et al (1991) Evidence for a pseudoautosomal locus for schizophrenia using the method of affected sibling pairs. Br J Psychiatry 158:624–629 [DOI] [PubMed] [Google Scholar]
- Cornelis F, Faure S, Marinez M, Prud’homme JF, Fritz P, Dib C, Alves H, et al (1998) new susceptibility locus for rheumatoid arthritis suggested by a genome-wide linkage study. Proc Natl Acad Sci USA 95:10746–10750 [DOI] [PMC free article] [PubMed] [Google Scholar]
- Crow TJ, Delisi L, Lofthouse R, Poulter M, Lehner T, Bass N, Shah T, et al (1994) An examination of linkage of schizophrenia and schizoaffective disorder to the pseudoautosomal region (Xp22.3). Br J Psychiatry 164:159–164 [DOI] [PubMed] [Google Scholar]
- D’Amato T, Waksman G, Martinez M, Laurent C, Gorwood P, Campion D, Jay M, et al (1994) Pseudoautosomal region in schizophrenia: linkage analysis of seven loci by sib-pair and lod-score methods. Psychiatry Res 52:135–147 [DOI] [PubMed] [Google Scholar]
- Ghosh, S, Watanabe MW, Hauser ER, Walle T, Magnuson VL, Erdos MR, Langefeld CD, et al (1999) Type 2 diabetes: evidence for linkage on chromosome 20 in 716 Finnish affected sibpairs. Proc Nat Acad Sci 96:2198–2203 [DOI] [PMC free article] [PubMed] [Google Scholar]
- Gorwood P, Leboyer M, d’Amato T, Jay M, Campion D, Hillaire D, Mallet J, et al (1992) Evidence for a pseudoautosomal locus for schizophrenia. I. A replication study using phenotype analysis. Br J Psychiatry 161:55–58 [DOI] [PubMed] [Google Scholar]
- Hager J, Dina C, Francke S, Dubois S, Houari M, Vatin V, Vaillant E, et al (1998) A genome-wide scan for human obesity genes reveals a major susceptibility locus on chromosome 10. Nat Genet 20:304–308 [DOI] [PubMed] [Google Scholar]
- Hamer DH, Hu S, Magnuson VI, Hu N, Pattatucci AM (1993) A linkage between DNA markers on the X chromosome and male sexual orientation. Science 261:321–327 [DOI] [PubMed] [Google Scholar]
- Haseman JK, Elston RC (1972) The investigation of linkage between a quantitative trait and a marker locus. Behav Genet 2:3–19 [DOI] [PubMed] [Google Scholar]
- Holmans P (1993) Asymptotic properties of affected-sib-pair linkage analysis. Am J Hum Genet 52:362–374 [PMC free article] [PubMed] [Google Scholar]
- James JW (1971) Frequency in relatives for an all-or-none trait. Ann Hum Genet 35:47–48 [DOI] [PubMed] [Google Scholar]
- Kalsi G, Curtis D, Brynjolfsson J, Butler R, Sharma T, Murphy P, Read T, et al (1995) Investigation by linkage analysis of XY pseudoautosomal region in the genetic susceptibility to schizophrenia. Br J Psychiatry 167:390–393 [DOI] [PubMed] [Google Scholar]
- Kehoe P, Wavrant-De Vrieze F, Crook R, Wu WS, Holmans P, Fenton I, Spurlock G, et al (1999) A full genome scan for late onset Alzheimer’s disease. Hum Mol Genet 8:237–245 [DOI] [PubMed] [Google Scholar]
- Kempthorne O (1957) An introduction to genetic statistics. John Wiley & Sons, New York [Google Scholar]
- Kong A, Cox NJ (1997) Allele-sharing models: LOD scores and accurate linkage tests. Am J Hum Genet 61:1179–1188 [DOI] [PMC free article] [PubMed] [Google Scholar]
- Kruglyak L, Daly MJ, Reeve-Daly MP, Lander ES (1996) Parametric and nonparametric linkage analysis: a unified multipoint approach. Am J Hum Genet 58:1347–1363 [PMC free article] [PubMed] [Google Scholar]
- Kruglyak L, Lander ES (1995) Complete multipoint sib-pair analysis of qualitative and quantitative traits. Am J Hum Genet 57:439–454 [PMC free article] [PubMed] [Google Scholar]
- Maier W, Schmidt F, Schwab SG, Hallmayer J, Minges J, Ackenheil M, Lichtermann D, et al (1995) Lack of linkage between schizophrenia and markers at the telomeric end of the pseudoautosome region of the sex chromosomes. Biol Psychiatry 37:344–347 [DOI] [PubMed] [Google Scholar]
- Mein CA, Esposito L, Dunn M, Johnson GCL, Timms AE, Goy JV, Smith AN, et al (1998) A search for type 1 diabetes susceptibility genes in families from the United Kingdom. Nat Genet 19:297–300 [DOI] [PubMed] [Google Scholar]
- Morton NE (1996) Logarithm of the odds (lods) for linkage in complex inheritance. Proc Natl Acad Sci USA 93:3471–3476 [DOI] [PMC free article] [PubMed] [Google Scholar]
- O’Connell JR, Weeks DE (1995) The VITESSE algorithm for rapid exact multilocus linkage analysis via genotype set-recoding and fuzzy inheritance. Nat Genet 11:402–408 [DOI] [PubMed] [Google Scholar]
- Ott J (1986) Y-linkage and pseudoautosomal linkage. Am J Hum Genet 38:891–897 [PMC free article] [PubMed] [Google Scholar]
- Philippe A, Martinez M, Guilloud-Bataille M, Gillberg C, Rastam M, Sponheim E, Coleman M, et al (1999) Genome-wide scan for autism susceptibility genes. Hum Mol Genet 8:805–812 [DOI] [PubMed] [Google Scholar]
- Reich T, Edenberg HJ, Goate A, Williams JT, Rice JP, Van Eerdewegh P, Foroud T, et al (1998) Genome-wide search for genes affecting the risk for alcohol dependence. Am J Med Genet 81:207–215 [PubMed] [Google Scholar]
- Risch N (1990a) Linkage strategies for generically complex traits. I. Multilocus models. Am J Hum Genet 46:222–228 [PMC free article] [PubMed] [Google Scholar]
- ——— (1990b) Linkage strategies for generically complex traits. II. The power of affected relative pairs. Am J Hum Genet 46:229–241 [PMC free article] [PubMed] [Google Scholar]
- Rouyer F, Simmler MC, Johnsson C, Vergnaud G, Cooke HJ, Weissenbach J (1986) A gradient of sex linkage in the pseudoautosomal region of the human sex chromosomes. Nature 319:291–295 [DOI] [PubMed] [Google Scholar]
- Strachan T, Read RP (1996) Human molecular genetics. Bios Scientific, New York [Google Scholar]
- Van Eerdewegh, P, Dupuis J, Santangelo SL, Hayward LB, Blacker D (1999) The importance of watching our weights: how the choice of weights for nonindependent sibpairs can dramatically alter results. Genet Epidemiol 17:S373–S378 [DOI] [PubMed] [Google Scholar]
- Wang ZW, Black D, Andreasen N, Crowe RR (1993) Pseudoautosomal locus for schizophrenia excluded in 12 pedigrees. Arch Gen Psychiatry 50:199–204 [DOI] [PubMed] [Google Scholar]


