Abstract
X-ray structures of the bacterial K+ channel KcsA have led to unparalleled progress in our understanding of ion channel structures. The KcsA channel has therefore been a prototypic model used to study the structural basis of ion channel function, including the gating mechanism. This channel was previously found to close at near-neutral intracellular pH (pHi) and to open at acidic pHi. Here, we report the presence of a previously unknown channel inactivation process that occurs after the KcsA channel is activated. In our experiments, mammalian cells transfected with a codon-optimized synthetic gene encoding the KcsA protein expressed K+-selective channels that activated in response to a decrease in pHi. Using patch-clamp and rapid solution exchange techniques, we observed that the KcsA channels inactivated within hundreds of milliseconds after channel activation. At all tested pHs, inactivation always accompanied activation, and it was profoundly accelerated in the same pH range at which activation increased steeply. Recovery from inactivation was observed, and its extent depended on the pHi and the amount of time that the channel was inactive. KcsA channel inactivation can be described by a kinetic model in which pHi controls inactivation through pH-dependent activation. This heretofore-undocumented inactivation process increases the complexity of KcsA channel function, but it also offers a potential model for studying the structural correspondence of ion channel inactivation.
Keywords: gating, ion channel inactivation, recovery from inactivation, synthetic gene, model
KcsA is a K+ channel from Streptomyces lividans. It is the first ion channel of known structure (1), and its x-ray structures are available for several conditions (1–3). This channel is formed by four identical subunits with four-fold symmetry about a central pore, and each of these subunits has two transmembrane segments bracketing a selectivity filter region (1). The pore of the KcsA channel has a similar structure to that of other K+ channels, and it is involved in ion selectivity and permeation and perhaps in channel gating as well (4–6). Studies guided by the structure of the KcsA channel have greatly expanded our knowledge of the physical basis of ion selectivity of K+ channels (2, 7). Less is known about the gating function of the KcsA channel, although it has often been used as a prototypic model for studying the structural basis of channel gating.
Previous studies have shown that the KcsA channel is gated by intracellular pH (pHi): It closes at near-neutral pHi and opens at acidic pHi. However, this knowledge of KcsA channel-gating function came exclusively from purified KcsA channels reconstituted in biochemically defined membranes (e.g., refs. 8 and 9). In most of these studies, the KcsA channel current was recorded and analyzed in a planar lipid bilayer recording chamber, in which exchange of solutions is usually slow. KcsA channels in these experimental systems have a noticeably low open-channel probability, even at a very acidic pHi when the channels are thought to be maximally active; why this phenomenon occurs has been unclear (8, 10, 11). One untested hypothesis is the presence of an inactivation process that is strictly coupled to channel activation. Channel inactivation after activation can cause and maintain low channel activity after the initial peak activation, which is a scenario that is reminiscent of the inactivation process found in many voltage-dependent channels. In the present study, we tested this hypothesis. To observe transient gating events, we expressed KcsA channels heterologously in cultured mammalian cell lines and studied these channels by using the inside-out patch-clamp technique and a rapid solution exchange system.
Materials and Methods
Gene Synthesis. To achieve optimal expression of the bacterial KcsA channel in mammalian cells, codon usage was optimized by using the dna works program and the associated human codon table (12). Twenty oligonucleotides containing 40–60 nucleotides were synthesized (Sigma-Genosys) to include the entire sequence encoding the KcsA protein plus a HindIII restriction enzyme site outside the 5′ end of the coding sequence and a BamHI site outside the 3′ end for subcloning. The oligonucleotides were assembled by using a PCR-based protocol (12). This synthetic cDNA is denoted as hkcsA. The sequence information for hkcsA and comparison with the native bacterial kcsA gene are given in Fig. 6, which is published as supporting information on the PNAS web site. The hkcsA fragment was subcloned into a pcDNA3.1zeo vector (Invitrogen) for expression in mammalian cells. The synthetic cDNA, after being modified to eliminate its stop codon, was also subcloned into a pEGFP-N1 vector (BD Biosciences Clontech), yielding the plasmid containing the synthetic gene fragment (denoted as hkcsA-egfp) that was expected to express a KcsA-EGFP fusion protein. The EGFP linked at the C terminus of the KcsA protein was used as a marker to facilitate monitoring of the expression of the connected KcsA protein in cells. All sequences of the synthesized DNA products were confirmed by DNA sequencing.
Expression of the KcsA Channel in Mammalian Cells. COS-1 and HEK-293 cell lines were maintained in continuous culture. The cells were transiently transfected with the synthetic genes with the same techniques used in studies with recombinant DNA products (13).
Patch-Clamp Recording. Macroscopic or single-channel KcsA channel currents were recorded in inside-out configurations. The solutions perfusing the intracellular side of the patched membrane contained 140 mM KCl and 2 mM EGTA. The solution was buffered with 5 mM Hepes, and pH was adjusted to 7.4 with KOH. In low-pH (<4.8) solutions, pH was adjusted to the designated values by using either 5 mM citric acid or 5 mM succinic acid instead of Hepes/KOH. The pipette solution (extracellular side) contained 10 mM KCl, 120 mM NaCl, 0.5 mM MgCl2, 1 mM CaCl2, and 5 mM Hepes, with pH adjusted to 7.4 by using NaOH. The concentration of KCl was adjusted in situations when a different K+ concentration was applied, and NaCl was used to replace KCl when the concentration of KCl was reduced. The intracellular solution was applied through a 200-μm pipette to the intracellular side of the patched membrane. The perfusion solution was exchanged with a time constant of 12.6 ± 1.0 ms by a computer-controlled rapid solution exchange system (DAD12, ALA Scientific Instruments, Westbury, NY). Channel currents were recorded at a membrane potential of 0 mV unless otherwise indicated. All experiments were performed at room temperature (23–25°C).
Data Analysis. For all KcsA channels, macroscopic currents were used to analyze the time-dependent changes of KcsA channel current with pclamp8 (Axon Instruments, Union City, CA). Shifts of baseline current caused by acidic pHi solutions (as will be described in Results and Discussion) were corrected by subtracting mean baseline shifts obtained in untransfected host cells from the macroscopic currents recorded in transfected cells. Single-channel currents were used for the measurement of single-channel current amplitude and kinetics. Baseline shifts were corrected manually before the analysis of single-channel current events. Idealization of single-channel current events and analyses of event durations and single-channel amplitudes were carried out with the programs skm and mil (qub suite, State University of New York, Buffalo) (14). Statistical data are represented as mean ± SE.
Kinetic Modeling and Simulation. We used Markovian models to describe the kinetic nature of channel gating. The models were manually evaluated by matching the experimental data with the model predictions. The qub suite was used to generate simulated current traces. Model-predicted kinetic parameters were obtained from the simulated currents by the same measurements that were used in analyzing the experimental data.
Results and Discussion
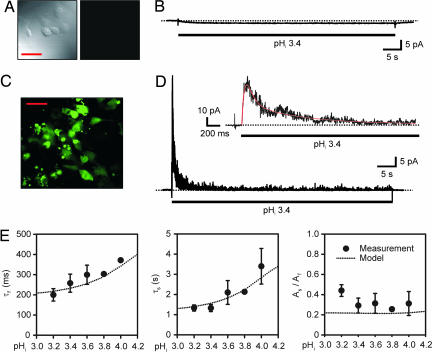
In our experimental system, KcsA channels were encoded by the codon-optimized synthetic gene hkcsA. In some experiments, an EGFP protein was fused to the C terminus of a KcsA subunit to monitor KcsA expression and localization. Untransfected COS-1 cells did not emit green fluorescence under our experimental conditions (Fig. 1A) and exhibited no detectable channel current activity (i.e., they did not show an increased fluctuation of current) in response to an acidic pHi pulse, except for a tiny inward shift (1.3 ± 0.9 pA) of the baseline current (Fig. 1B). As judged by EGFP fluorescence (Fig. 1C), mammalian COS-1 cells were able to use the hkcsA-egfp gene to make a membrane protein that reached the surface membrane. Patch-clamp recording of cells that emitted green fluorescence showed no channel activity when the cells were intact. However, KcsA channels were rapidly activated in cell-detached patches when pHi was <4.8 (Fig. 1D). This observation provides firm evidence that protons open the channel via a cytoplasmic pathway. We know that the channels activated by acidic pHi were KcsA channels, because this unique channel activity was only present in the cells that emitted green fluorescence, which came from the fusion protein KcsA-EGFP, but expressing EGFP alone did not give rise to any channel activity. Moreover, the same channel activity was recorded in COS-1 cells transfected with channels expressed from full-length coding cDNA hkcsA as well as in HEK-293 cells transfected with hkcsA or hkcsA-egfp.
Fig. 1.
Inactivation of KcsA channels expressed in COS-1 cells. (A) Confocal micrograph of untransfected COS-1 cells (Left) giving no green fluorescence (Right). (Scale bar: 50 μm.) (B) Effect of an acidic pHi pulse on the current in a patch excised from an untransfected COS-1 cell. (C) Confocal micrograph of COS-1 cells expressing fusion KcsA-EGFP proteins that emit green fluorescence. (D) Representative macroscopic current of KcsA channels. An acidic pHi pulse (pHi = 3.4) was applied during the period marked by the bar. Baseline shift at the acidic pHi was subtracted from the current trace. Inset shows the peak current phase on an expanded time scale, in which the red line superimposed on the current trace represents the sum of three exponentials with time constants of 25 ms, 202 ms, and 1.3 s, respectively. The dotted lines crossing the current traces indicate zero current. (E) pHi dependence of the time constants and relative amplitudes of inactivation exponential components (n = 2–11). As/Af is the ratio of the amplitude of the slower inactivation component to the amplitude of the faster inactivation component. Here and in Figs. 2 and 3, the dotted lines marked “model” represent predictions of the kinetic model that is formulated in Fig. 5A.
As seen in Fig. 1D, the pHi-activated current reached a peak and then decayed to a residual level, representing a previously unreported inactivation process. The time course of current activation and inactivation can be described by at least three exponential functions, as illustrated in Fig. 1D Inset. The fastest component describes the activation of the current, whereas the two slower components are attributed to its inactivation. Additional measurements made in the pHi range between 3.2 and 4.0 demonstrate that both inactivation time constants become faster at lower pHi (Fig. 1E), whereas the time constant of the activation decreases (data not shown).
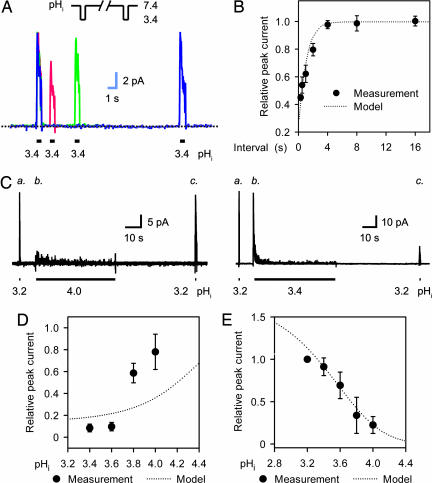
Inactivated KcsA channels can recover at a near-neutral pHi. Recovery was demonstrated by measuring the current response to a series of two low-pHi pulses. Two pulses in each group were separated by a varied recovery interval as shown in Fig. 2A. The macroscopic current that was recovered from inactivation increased with the interval of recovery, reaching a level close to that of the conditioning pulse (Fig. 2 A and B). However, recovery from prolonged inactivation was incomplete even after an extended recovery interval, which reveals an irreversible inactivation component. This component can be illustrated by current response to a three-pulse protocol (Fig. 2C). The irreversible inactivation developed as the amount of time that the channel was inactive increased (Fig. 2C) and became more prominent at lower pHi (Fig. 2D). Current response to the three-pulse protocol was also used to quantify the pHi-dependent activation of the KcsA current: namely, a pHi–I relationship that clearly shows more activation at lower pHi (Fig. 2E).
Fig. 2.
pHi-dependent recovery from inactivation and pHi-dependent activation. (A) Superimposed macroscopic KcsA channel currents show recovery from inactivation in response to a series of two acidic pulses (shown in Inset). Each current trace is marked in a different color, and all three current traces were recorded in the same membrane patch. The current traces have been scaled to the peak currents at the conditioning pulses. The dotted line indicates zero current. (B) Statistical presentation of the recovery from inactivation (n = 5–7). The relative peak current is the ratio of the peak current at the test pulse to that at the conditioning pulse. (C) Macroscopic KcsA channel currents show activation and irreversible inactivation components in response to three successive acidic pulses (indicated by bars). (D) pHi dependence of the irreversible inactivation component. The measured peak currents (indicated by “c” in C) after 50-s conditioning pulses at a test pHi were normalized to the control peak currents (indicated by “a” in C) in response to a 300-ms pulse of pHi 3.2. n = 3–7. (E) Relationship between pHi and peak current. The peak currents at given pHi levels (as indicated by “b” in C) were normalized to the control peak currents (indicated by “a” in C).
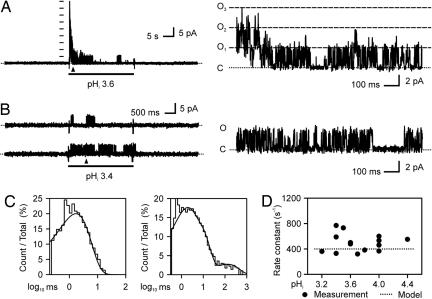
Gating of single KcsA channels was characterized at pHi ≤ 4.4. The following criterion was used to help identify the single KcsA channel currents. In the macroscopic current experiments (as shown in Fig. 1), acidic pHi pulses did not evoke any detectable channel activity in untransfected COS-1 cells, and KcsA channels did not open at near-neutral pHi. Thus, single KcsA channel currents were identified as single-channel currents that were elicited by acidic pHi pulses in cells transfected with either hkcsA or hkcsA-egfp. Indeed, acidic pHi only activated one uniform population of channels in the transfected cells, and it did not evoke any detectable single-channel events in untransfected cells or in the cells expressing EGFP alone. Fig. 3A gives an example that demonstrates the uniformity of the pHi-elicited single-channel currents. In these experiments, patches contained a small number of pHi-activated channels so that open-channel levels corresponding to individual channel openings could be resolved. Like macroscopic currents, the multiple-channel currents reached a peak quickly and then decayed in response to the acidic pHi step. The pHi-activated channels had a uniform single-channel amplitude (3.9 ± 0.3 pA at 0 mV in 10 mM extracellular K+ and 140 mM intracellular K+) and a similar pattern of gating kinetics, indicting that they were all KcsA channels. To reduce possible contamination by other channels, patches that exhibited any detectable channel activity at a pHi level of 7.4 were excluded from the analysis. Gating of the single KcsA channels (Fig. 3B) featured an exponential distribution of open times and more than one exponential distribution of closed times (Fig. 3C). The data indicate the presence of only one open state and multiple closed states. The overall rate constant leaving the open state was 457 s–1 as estimated from the mean open times, and the rate was independent of pHi (Fig. 3D).
Fig. 3.
Gating kinetics of single KcsA channels. (A) An example of multiple KcsA channel currents demonstrating the relationship between the macroscopic and single-channel KcsA currents. (Left) Multiple KcsA channel current elicited by an acidic pHi pulse in a patch excised from a COS-1 cell expressing KcsA-EGFP. (Right) The superimposed currents through three open channels are shown on an expanded time scale (taken from the time marked by the triangle in Left). Multiple-channel current levels anticipated from the single-channel current amplitude are indicated either by a column of bars (in Left) or long-dashed lines together with the numbers of open channels (in Right). (B) Representative single KcsA channel currents recorded in a patch containing a single active channel. Right shows the current trace on an expanded time scale. In A and B, the dotted lines indicate zero current. (C) Corresponding histograms of open times (Left) and closed times (Right) fitted with a single exponential and three exponentials, respectively. (D) Plot of the overall rate constant leaving the open state (the reciprocal of mean open time) against the pHi.
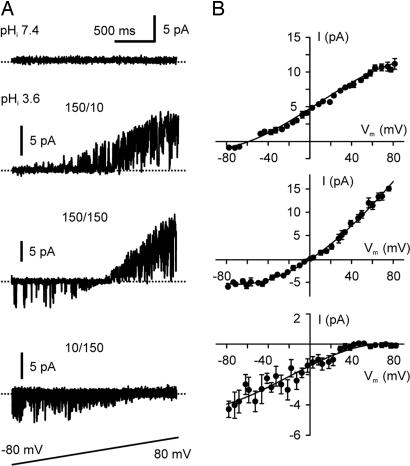
The selectivity of the KcsA channels expressed in COS-1 cells was examined by a voltage-ramp protocol (shown in Fig. 4A) in combination with varying ionic concentrations at both sides of the membrane. Single KcsA channels were elicited by acidic pHi (3.6) pulses, and the voltage-ramp protocol was applied repeatedly, starting within 200 ms after the beginning of an acidic pHi pulse. To avoid possible contamination by endogenous channels that voltage changes might evoke, the same voltage-ramp protocol was applied at a pHi level of 7.4 before and after the acidic pHi pulses. Patches that contained active channels observed at any voltage level in pHi-7.4 solutions were excluded from the analysis. The experiments exhibited that the reversal potentials of the single KcsA channel current were close to the equilibrium potentials of K+ (Fig. 4), confirming that the channels are highly selective for K+. The activity of the KcsA channels appeared to depend on membrane potential and the direction of ion flow, being more active at positive potentials and when the currents were outward. Multiple subconductance levels were also observed frequently, especially at pHi < 3.6.
Fig. 4.
Ionic selectivity of single KcsA channels. (A) Representative responses of single KcsA channels to the shown voltage-ramp protocol at a pHi level of 7.4 (Top) and at a pHi level of 3.5 in the presence of various ionic concentrations (Middle and Bottom). 150/10, 150 mM intracellular K+, 10 mM extracellular K+, 140 mM extracellular Na+, and 150 mM symmetric Cl–; 150/150, in the presence of 150 mM symmetric KCl; 10/150, 10 mM intracellular K+, 150 mM extracellular K+, 140 mM intracellular Na+, and 150 mM symmetric Cl–. The current trace in Top (pHi of 7.4) and the current trace marked 150/10 were recorded successively from the same patch. The panel marked 10/150 contains superimposed current traces. The dotted lines in the current crossing the traces indicate zero current. (B) I–V plots show reversal potentials under the ionic conditions corresponding to those indicated in A. Each data point (n = 4–10) of the single-channel current amplitude in the I–V plots is the mean value of the maximal current amplitudes measured within a 5-mV window. The continuous lines represent cubic regressions fit to the data points.
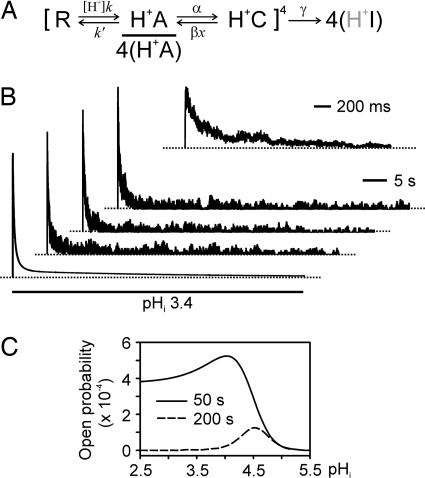
To identify the kinetic states involved in inactivation, we developed a tetrameric subunit model of gating based on our experimental data. The model assumes that each identical subunit of the tetrameric KcsA channel has three states that are linearly connected through two transitions. The model combines all possible states collectively from four subunits in a manner analogous to that of a model of C-type inactivation of a voltage-gated K+ channel (15). Fig. 5A gives an abbreviated presentation of the model [in a form similar to that used previously by Zagotta et al. (16)] to emphasize the two transitions undergone by each individual subunit. An extended presentation of the model illustrating the conformational changes of the whole channel is given in Fig. 7, which is published as supporting information on the PNAS web site. In this model, the transition from the resting state to the activated state is arranged such that binding of protons with a 1:1 binding isotherm at a subunit will accelerate the transition. A proton dissociation constant (pKa) of 4.2 was estimated by fitting the model-predicted kinetic parameters to the experimental results. After protonation and entry into the activated state, the subunits can progress to a closed state with cooperativity that exists in the reverse direction. It is this transition into the closed state that explains the reversible inactivation. Once all four subunits are in the closed state, a concerted transition involving all subunits into an inactivated state can occur, which approximates the irreversible inactivation component. Kinetic behaviors of the model match well with experimental observations, as seen in the predictions represented by dotted lines superimposed onto the experimental data in the figures. Using the model, we have recreated experimental KcsA currents such as the one shown in Fig. 1D. Fig. 5B illustrates the recreated currents corresponding to the experimental data of Fig. 1D.
Fig. 5.
Kinetic modeling of the KcsA channel gating process. (A) Scheme for the kinetic model of KcsA channel gating. The scheme models a channel composed of four identical subunits; each has a resting, closed state (R), a protonated, activated state (H+A), and a protonated, closed state (H+C). The channel opens only when all subunits are activated, which is denoted by 4(H+A). The H+ binding transition (R–H+A) of an individual subunit occurs independently, whereas the transition between H+A and H+C involves cooperativity between subunits. The model channel can also undergo a concerted move to the irreversible inactivated state 4(H+I). Stable dwelling in the irreversible state is assumed to be independent of the protonation status of the subunits (symbolized by shaded H+). After being rounded to the nearest representable values, the estimated rate constants and cooperativity factor are k = 1,600,000 s–1·M–1, k′= 100 s–1, α = 1.75 s–1, β = 1.25 s–1, and χ = 0.5. [H+] is the proton concentration. (B) Simulated macroscopic currents (the three top current traces) of KcsA channels and the macroscopic behavior of the model (the bottom trace) in response to an acidic pHi pulse. Inset shows the peak current phase of the current trace below it on the expanded time scale. The macroscopic currents and the model behavior were calculated by using the sim program of the qub suite. A total of 100 channels having a uniform closed level and a uniform open level were included in the current simulation. Noises with SD of 10–15% of the single-channel amplitude were added to the closed and open channel levels. The simulation reconstitutes the macroscopic current shown in Fig. 1D under the same conditions used for recording the current. The dotted lines indicate zero current. (C) Model-predicted effect of prolonged exposure to low pHi on pHi–activity relationship. KcsA channel activity is represented by open probability, which was measured from computed channel activities at 50 and 200 s after an application of low pHi started.
The kinetic model also provides an answer to a previously unresolved question in the study of KcsA channel gating. Although acidic pHi is known to activate the KcsA channel, it has been difficult to pinpoint the exact pHi needed to activate the channel. In the initial functional study conducted in reconstituted KcsA channels, Cuello et al. (8) estimated that a pKa of <4.0 was necessary for activation. In the same study, when 86Rb+ uptake into proteoliposomes was measured for KcsA channel activity, a bell-shaped pH–activity curve peaking at a pH level of 4 was observed. In other similar experiments, however, the KcsA channels were found to activate at higher pH ranges (17–19). The presence of the pH- and time-dependent inactivation explains this inconsistency: Measurement of the pHi–activity relationship depends critically on the time at which the measurement is made. Model-predicted pHi–activity relationships for the peak current (Fig. 2E) and at various times (Fig. 5C) after application of low pHi have different shapes and different apparent pH values for half-activation. These model predictions agree with previously reported data, which also attests to the presence of inactivation in the reconstituted KscA channels.
In this study, we describe a previously undocumented gating process for the KcsA channel that involves channel inactivation. An important feature of this inactivation is its strict coupling with channel activation: At all tested pHi values, inactivation always accompanied activation, and it profoundly accelerated in the same pHi range at which activation increased steeply. The same sort of strict association between inactivation and activation is found in voltage-gated channels, where the inactivation senses the voltage change through activation.
Ion channel inactivation describes a channel closing process that follows channel activation (20). Activation-coupled inactivation allows ion channels to block ion flow in the presence of a stimulating signal. This additional level of control of ion permeability facilitates fundamental processes such as the regulation of activation potentials in excitable cells. Several mechanisms for such inactivation have been identified. Among these, only N-type (ball-and-chain) inactivation has been analyzed in unprecedented, definitive structural detail (21). The current understanding of other types of inactivation, such as C-type inactivation (22), is largely based on functional and mutagenic studies of voltage-gated channels. Nevertheless, these studies can provide only limited structural information.
In contrast, abundant structural data are available for the KcsA channel. Some of these data have implicated the existence of an inactivation state. For example, the low K+ structure of the KcsA channel shows a clearly closed selectivity filter (2), although its function has been elusive. Molecular dynamics calculations have predicted that asymmetrical reorientation of two residues at the selectivity filter can also lead the KcsA channel into inactivation (23). Despite these important data, a key piece of experimental data that would link structural information to channel inactivation has been missing: Before our study, inactivation had not been observed in the KcsA channel. Our findings revise the view of the gating process of the KcsA channel. Gating of this channel is now more analogous in at least two aspects to the gating process of a voltage-gated channel; that is, it has an activation process and an associated inactivation process. More specifically, inactivation of the KcsA channel exhibits similarities to C-type inactivation of voltage-gated K+ channels, including its kinetic behaviors and the lack of the ball-and-chain or a relevant intracellular structure (18). Based on the assumption that the pHi sensing mechanism of the channel does not desensitize, which was indicated by the monotonic pH dependence of the conformational rearrangement in the transmembrane segments (24), we postulate that inactivation of the KcsA channel is likely mediated by a gating mechanism residing within the transmembrane pore region. The selectivity filter is a candidate structure for the inactivation gate. Thus, the KcsA channel has the potential to be a simplified but compelling model for deciphering the structural mechanism of channel activation and inactivation.
Supplementary Material
Acknowledgments
This work was supported by National Institutes of Health Grants GM-61943 and HL-58133 (to Z.F.) and a research grant from the Academy of Finland (to V.P.).
Author contributions: Z.F. designed research; L.G., X.M., V.P., and K.W. performed research; L.G. and Z.F. contributed new reagents/analytic tools; L.G., X.M., and Z.F. analyzed data; and Z.F. wrote the paper.
Conflict of interest statement: No conflicts declared.
This paper was submitted directly (Track II) to the PNAS office.
Abbreviation: pHi, intracellular pH.
References
- 1.Doyle, D. A., Morais, C. J., Pfuetzner, R. A., Kuo, A., Gulbis, J. M., Cohen, S. L., Chait, B. T. & MacKinnon, R. (1998) Science 280, 69–77. [DOI] [PubMed] [Google Scholar]
- 2.Zhou, Y., Morais-Cabral, J. H., Kaufman, A. & MacKinnon, R. (2001) Nature 414, 43–48. [DOI] [PubMed] [Google Scholar]
- 3.Lenaeus, M. J., Vamvouka, M., Focia, P. J. & Gross, A. (2005) Nat. Struct. Mol. Biol. 12, 454–459. [DOI] [PubMed] [Google Scholar]
- 4.Jiang, Y., Lee, A., Chen, J., Cadene, M., Chait, B. T. & MacKinnon, R. (2002) Nature 417, 515–522. [DOI] [PubMed] [Google Scholar]
- 5.Jiang, Y., Lee, A., Chen, J., Ruta, V., Cadene, M., Chait, B. T. & MacKinnon, R. (2003) Nature 423, 33–41. [DOI] [PubMed] [Google Scholar]
- 6.Kuo, A., Gulbis, J. M., Antcliff, J. F., Rahman, T., Lowe, E. D., Zimmer, J., Cuthbertson, J., Ashcroft, F. M., Ezaki, T. & Doyle, D. A. (2003) Science 300, 1922–1926. [DOI] [PubMed] [Google Scholar]
- 7.Roux, B. & MacKinnon, R. (1999) Science 285, 100–102. [DOI] [PubMed] [Google Scholar]
- 8.Cuello, L. G., Romero, J. G., Cortes, D. M. & Perozo, E. (1998) Biochemistry 37, 3229–3236. [DOI] [PubMed] [Google Scholar]
- 9.Heginbotham, L., LeMasurier, M., Kolmakova-Partensky, L. & Miller, C. (1999) J. Gen. Physiol. 114, 551–560. [DOI] [PMC free article] [PubMed] [Google Scholar]
- 10.LeMasurier, M., Heginbotham, L. & Miller, C. (2001) J. Gen. Physiol. 118, 303–314. [DOI] [PMC free article] [PubMed] [Google Scholar]
- 11.Zhou, M. & MacKinnon, R. (2004) J. Mol. Biol. 338, 839–846. [DOI] [PubMed] [Google Scholar]
- 12.Hoover, D. M. & Lubkowski, J. (2002) Nucleic Acids Res. 30, e43. [DOI] [PMC free article] [PubMed] [Google Scholar]
- 13.Cui, Y., Wang, W. & Fan, Z. (2002) J. Biol. Chem. 277, 10523–10530. [DOI] [PubMed] [Google Scholar]
- 14.Qin, F., Auerbach, A. & Sachs, F. (1996) Biophys. J. 70, 264–280. [DOI] [PMC free article] [PubMed] [Google Scholar]
- 15.Panyi, G., Sheng, Z. & Deutsch, C. (1995) Biophys. J. 69, 896–903. [DOI] [PMC free article] [PubMed] [Google Scholar]
- 16.Zagotta, W. N., Hoshi, T. & Aldrich, R. W. (1994) J. Gen. Physiol. 103, 321–362. [DOI] [PMC free article] [PubMed] [Google Scholar]
- 17.Heginbotham, L., Kolmakova-Partensky, L. & Miller, C. (1998) J. Gen. Physiol. 111, 741–749. [DOI] [PMC free article] [PubMed] [Google Scholar]
- 18.Cortes, D. M., Cuello, L. G. & Perozo, E. (2001) J. Gen. Physiol. 117, 165–180. [DOI] [PMC free article] [PubMed] [Google Scholar]
- 19.Enkvetchakul, D., Bhattacharyya, J., Jeliazkova, I., Groesbeck, D. K., Cukras, C. A. & Nichols, C. G. (2004) J. Biol. Chem. 279, 47076–47080. [DOI] [PMC free article] [PubMed] [Google Scholar]
- 20.Yellen, G. (1998) Q. Rev. Biophys. 31, 239–295. [DOI] [PubMed] [Google Scholar]
- 21.Zhou, M., Morais-Cabral, J. H., Mann, S. & MacKinnon, R. (2001) Nature 411, 657–661. [DOI] [PubMed] [Google Scholar]
- 22.Hoshi, T., Zagotta, W. N. & Aldrich, R. W. (1991) Neuron 7, 547–556. [DOI] [PubMed] [Google Scholar]
- 23.Berneche, S. & Roux, B. (2005) Structure 13, 591–600. [DOI] [PubMed] [Google Scholar]
- 24.Perozo, E., Cortes, D. M. & Cuello, L. G. (1999) Science 285, 73–78. [DOI] [PubMed] [Google Scholar]
Associated Data
This section collects any data citations, data availability statements, or supplementary materials included in this article.


