Abstract
The Bacteria and Archaea from the meromictic Lake Pavin were analyzed in samples collected along a vertical profile in the anoxic monimolimnion and were compared to those in samples from the oxic mixolimnion. Nine targeted 16S rRNA oligonucleotide probes were used to assess the distribution of Bacteria and Archaea and to investigate the in situ occurrence of sulfate-reducing bacteria and methane-producing Archaea involved in the terminal steps of the anaerobic degradation of organic material. The diversity of the complex microbial communities was assessed from the 16S rRNA polymorphisms present in terminal restriction fragment (TRF) depth patterns. The densities of the microbial community increased in the anoxic layer, and Archaea detected with probe ARCH915 represented the largest microbial group in the water column, with a mean Archaea/Eubacteria ratio of 1.5. Terminal restriction fragment length polymorphism (TRFLP) analysis revealed an elevated archaeal and bacterial phylotype richness in anoxic bottom-water samples. The structure of the Archaea community remained rather homogeneous, while TRFLP patterns for the eubacterial community revealed a heterogeneous distribution of eubacterial TRFs.
Permanent anoxic basins are of great interest to microbial ecologists, and during the last decade several papers have been published on microbial assemblages from different marine anoxic basins (e.g., see references 42 and 36). Among permanent anoxic aquatic systems, meromictic lakes are unusual and provide a special opportunity for research in aquatic biology for several reasons, e.g., the high physical stability of the water masses, clearly separated compartments, a relatively constant vertical stratification of bacterial populations, a compact and stable transition zone between the oxic mixolimnion and the anoxic monimolimnion, and in many cases the presence of a dense microbial community at the redox transition zone (6). These small and well-defined ecosystems can be useful for studying anaerobic microbial community structure and diversity and providing information on global carbon cycling and biogeochemical processes. Although molecular characterizations of microbial communities from Lake Sælenvannet (31, 41), Lake Cadagno (6), Mono Lake (18), and Mariager Fjord (34, 40) have been reported, the microbial populations and communities living in anaerobic zones of meromictic lakes remain largely unexplored.
This paper focuses on the in situ distribution, abundance, and diversity of the Bacteria and Archaea communities in the anoxic zone of Lake Pavin, which has the advantage of being in a steady state (28). We have conducted culture-independent studies of the anoxic water column of Lake Pavin and of samples collected from the oxic zone to provide comparative information. Terminal restriction fragment length polymorphism (TRFLP) and fluorescent in situ hybridization analyses were performed on samples from between 50- and 90-m depths to characterize the microbial assemblages using 16S rRNA genes. Because previous geochemical studies (28) have shown high concentrations of end products (methane, carbon dioxide, and sulfide) of the terminal steps of anaerobic degradation of organic material in the monimolimnion, we have focused on the in situ occurrence of sulfate-reducing Bacteria (SRB) and methane-producing Archaea (MPA).
Our results show significant differences in the compositions of microbial assemblages at different depths under stratified conditions and reveal distinct diversity patterns not only in oxic versus anoxic water zones of the lake but also within the anoxic depth profile.
MATERIALS AND METHODS
Description of study site and sampling procedures.
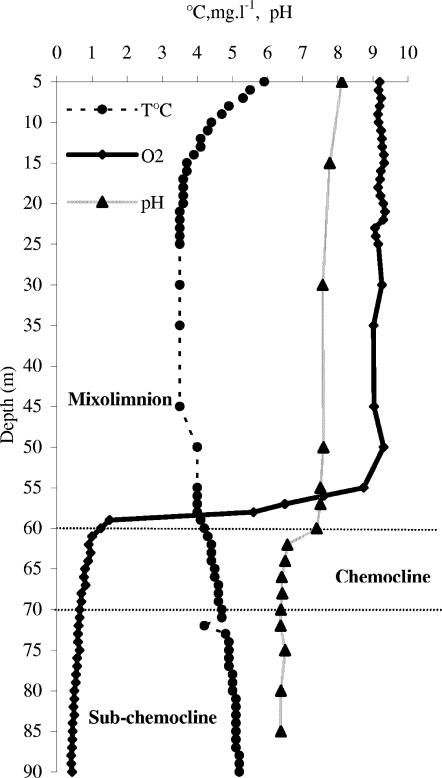
Lake Pavin, located at 45°55′N and 2°54′E, is the youngest volcano crater lake in the French Massif Central (6,000 years BP). Lake Pavin has a circular shape, an area of 0.44 km2, and a maximum depth of 92 m at an elevation of 1,197 m above sea level. It is characterized by the presence of two permanent stratified layers. The upper layer (mixolimnion) extends from the surface to a 60-m depth (see Fig. S2 in the supplemental material) and is affected by mixing during fall and spring. The deepest layer (monimolimnion) extends from 60 to 90 m in depth and includes the chemocline (60- to 70-m depth).
Water samples were collected in March 2002 from 15 depths along a vertical profile (between 50 and 90 m) with an 8-liter horizontal Van Dorn bottle. Depth profiles of the water temperature (±0.2°C), oxygen concentration (±0.03 mg liter−1, ±0.2%), and pH were determined in situ by using a portable multisensor probe (WTW). Concentrations of dissolved major elements (except ferrous iron) were measured by colorimetric techniques using a spectrophotometer according to the manufacturer's instructions (Hach Kits). Ferrous iron [Fe(II)] was analyzed by the orthophenanthroline method (20). Gases from bottom water were collected (see Fig. S1 in the supplemental material) using a methodology developed by the Laboratory of Geochemistry (University of Paris VII) (28). Methane and carbon dioxide concentrations were measured with a gas chromatograph equipped with a flame ionization detector (DI 700; Delsi).
In situ hybridization.
Nine oligonucleotide probes (Table 1) were synthesized commercially (MWG Biotech Ltd., Milton Keyns, United Kingdom) and end labeled with indocarbocyanine fluorescent dye (Cy3). Sample preparations and hybridizations were performed as previously described (14). Specific hybridization conditions for probes are indicated in Table 1. Between 400 and 600 bacteria stained with fluorescent probes were counted on each hybridized filter (magnification, ×1,000). DAPI (4′,6′-diamidino-2-phenylindole) counts were used as a reference for the subsequent community analysis with group-specific probes (data are expressed as percentages of DAPI counts).
TABLE 1.
Oligonucleotide probes and primers used for in situ hybridization analyses and PCR reactions
| Probe or primer | Sequence (5′ → 3′) | Target | % Formamidea | NaCl concn (mM) in washing buffer | Tdb | Reference |
|---|---|---|---|---|---|---|
| Probes | ||||||
| EUB 338 | GCTGCCTCCCGTAGGAGT | Eubacteria | 35 | 80 | 46 | 1 |
| ARCH915 | GTGCTCCCCCGCCAATTCCT | Archaea | 20 | 200 | 46 | 38 |
| SRB 385R | CGGCGTCGCTGCGTCAGG | SRB (δ-Proteobacteria) | 35 | 88 | 46 | 34 |
| 660R | GAATTCCACTTTCCCCTCTG | Desulfobulbus | 60 | 15 | 46 | 13 |
| 129F | CAGGCTTGAAGGCAGATT | Desulfobacter | 20 | 15 | 46 | 13 |
| 687R | TACGGATTTCACTCCT | Desulfovibrio | 10 | 15 | 46 | 13 |
| MB1174 | TACCGTCGTCCACTCCTTCCTC | Methanobacteriaceae | 40 | 62 | 35 | |
| MSMX860 | GGCTCGCCTCACGGCTTCCCT | Methanosarcinaceae | 40 | 60 | 35 | |
| MG1200 | CGGATAATTCGGGGCATGCTG | Methanomicrobiaceae | 40 | 53 | 35 | |
| Primers | ||||||
| 21f | TTCCGGTTGATCCYGCCGGA | Archaea | 5 | |||
| 958r | YCCGGCGTTGAMTCCAATT | Archaea | 5 | |||
| 27f | AGAGTTTGATCCTGGCTCAG | Eubacteria | 18 | |||
| 1492r | TACCTTGTTACGACTT | Universal | 18 | |||
| 907r | CCGTCAATTC(AC)TTT(AG)AGTTT | Universal | 9 |
Formamide concentration in hybridization buffer.
Hybridization temperature (°C).
DNA extraction.
One-hundred-milliliter water samples were filtered on-site onto 0.2-μm-pore-size polycarbonate filters (GTTP; Millipore) and stored at −80°C before extraction. The extraction procedure was performed as previously described (3, 19). DNA extracts were quantified with a DNA quantitation fluorescence assay kit (Sigma).
PCR conditions.
Primers 27f and 21f were 5′ labeled with 6-carboxyfluorescein (FAM), a fluorescent sequencing dye (Perkin-Elmer Applied Biosystems Division, Foster City, CA). Target genes were selectively amplified from the genomic DNA by PCR, as follows. The archaeal 21f-FAM, archaeal 958r, and universal 907r primers were used to amplify the archaeal 16S rRNA genes. The bacterial primer 27f-FAM was used in combination with the universal primers 1492r and 907r to selectively amplify the bacterial 16S rRNA genes (Table 1). Reaction mixtures contained 5 μl of 10× buffer, 2 mM MgCl2, a 200 μM concentration of each deoxyribonucleoside triphosphate (dATP, dCTP, dGTP, and dTTP; Eurobio), 1.25 U of Taq II DNA polymerase (Eurobio), 10 pmol of each oligonucleotide primer, and 50 ng of template DNA in a final volume of 50 μl. DNA amplification was performed with a model PTC-200 cycler (MJ Research) by using the following program: a 5-min hot start at 95°C followed by 30 cycles consisting of denaturation (1 min at 95°C), annealing (1 min at 55°C), and extension (1 min at 72°C) and a final extension at 72°C for 10 min. Amplified DNAs were checked by electrophoresis in 1.0% agarose in 1× Tris-borate-EDTA buffer, and amplicons in the proper size range were cut out, purified with a QIAquick gel extraction kit (QIAGEN, Basel, Switzerland), and eluted in a final volume of 50 μl.
16S rRNA gene TRFLP analysis.
Enzymatic digestion reaction mixtures contained 100 ng of labeled DNA (19) and were incubated for 12 h at 37°C. The 25-μl reaction mixtures contained 20 U of RsaI, MspI, and HhaI (Sigma) in the manufacturer's recommended reaction buffer. The inactivated restriction digests (by heating to 65°C for 10 min) were purified and desalted using Micropure EZ-Microcon 30 columns (Millipore) to prevent ion interference with the uptake of DNA by electrokinetic injection (29). The volume after EZ column purification was checked for all samples to reduce bias resulting from differences in the volume of the column eluant, which could lead to large differences in the mass loaded into the sequencer (and consequently to large differences observed in detectable peaks). The fluorescently labeled terminal restriction fragments (TRFs) were analyzed on an ABI 3700 automated sequence analyzer (Applied Biosystems) in GeneScan mode. The restriction enzyme digestion mixture (2.3 μl) was mixed with 0.5 μl of GeneScan-1000 ROX size standard (Applied Biosystems) and 3.2 μl of deionized formamide, followed by denaturation at 94°C for 3 min. Injection was performed electrokinetically at 7.7 kV for 40 s. Three replicate TRF profiles were obtained from the digested DNA by loading three aliquots of digested DNA on three different capillaries. Replication at this level was performed to measure the degree of variation in TRF profiles arising solely as a result of experimental error during electrophoresis of digested DNA samples.
Analysis of TRF profiles.
For each sample, peaks over a threshold of 50 units above background fluorescence were analyzed by aligning fragments with the size standard by using GeneScan software (ABI). To avoid the detection of primers and uncertainties of size determination, TRFs smaller than 50 bp and larger than 800 bp were excluded. Replicate profiles of each sample were compared to identify the reproducible fragments (peaks that appeared in at least two replicate profiles of a sample). Only reproducible TRFs were considered in the numerical analysis, and TRFs that differed by <1 bp were considered identical and were clustered. The profiles generated by TRFLP analysis can vary in two ways. First, there can be variation in the number and sizes (in base pairs) of TRFs present in the profile. Secondly, variation can be found in the height (and consequently the area) of any particular peak. The relative abundance of TRFs was determined by calculating the ratio between the peak height of each peak and the total peak height of all peaks within one sample. Ratios were converted into percentages, and the results are displayed as histograms. Additionally, TRFLP profiles were analyzed by the presence or absence of TRFs (converted to binary data), and the similarity of the patterns was calculated using correspondence analysis (COA) computed with R software using the ADE4 package for COA analysis (http://cran.r-project.org/). Phylotype richness (S) was calculated as the total number of distinct TRF sizes in a sample. The Shannon-Weiner diversity index (25) was calculated as follows: H = −Σ(pi) (log2 pi), where p is the proportion of an individual peak area relative to the sum of all the peak areas. Correlation coefficients were determined using the R coefficient of Pearson. Statistical analyses of S and H evolutions were performed by one-way analysis of variance (ANOVA), using Minitab software, version 12.
RESULTS
Characteristics of Lake Pavin.
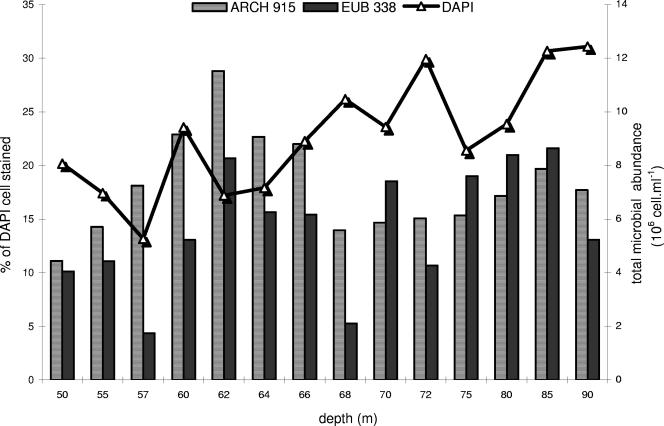
The anoxic zone extended from 60 m to 92 m (including the chemocline and subchemocline), and a steep oxycline was evident between 55 m and 60 m. The temperature increased with depth in the anoxic zone, from 4°C at 60 m to 5.2°C at 90 m. The pH reached 7.5 in epilimnetic water and decreased in the anoxic zone to 6.5 (Fig. 1). The mean dissolved organic carbon (DOC) content of the monimolimnion between 60 and 90 m was higher (6.3 mg liter−1) than that of the oxic zone sampled (3 mg liter−1). The DOC concentrations peaked at 68 m and 70 m (9.3 mg liter−1) and at 80 m (8.8 mg liter−1) (Table 2). Methane (CH4) and carbon dioxide (CO2) were first detectable at 60 m and increased with depth (Table 2). In the 60- to 90-m water column, the CH4 concentrations ranged from 5 cm3 liter−1 to 100 cm3 liter−1, and CO2 concentrations ranged from 1.7 cm3 liter−1 to 25 cm3 liter−1. Dissolved ferrous iron (Fe2+) was undetectable above a 62-m depth. Below 62 m, the Fe(II) concentrations presented broad peaks in the chemocline, with a prominent peak of 367.8 μM at 70 m. The NH4+ (Table 2) profile showed an increase with depth and a prominent peak of 576.4 μM at 70 m. Bacterial numbers (Fig. 2) based on microscopic counts ranged from 5.2 × 10⁶ to 1.2 × 10⁷ cells ml−1, with the largest number found in the anoxic zone.
FIG. 1.
Depth profiles of temperature (°C), oxygen (mg liter−1), and pH in water column of Lake Pavin on 18 March 2002.
TABLE 2.
Concentrations of dissolved compounds in Lake Pavin by depth
| Depth (m) | Concn of compound
|
|||||
|---|---|---|---|---|---|---|
| DOCa | CO2 | CH4 | Fe(II) | P-PO42− | N-NH4+ | |
| 50 | 3.8 | 0 | 0 | 0 | 0 | |
| 55 | 2.8 | 0 | 0 | 0 | 0 | |
| 57 | 2.5 | 0 | 0 | 0 | ||
| 60 | 6.2 | 1.7 | 5 | 0 | 16.1 | 72.1 |
| 62 | 2.5 | 3.7 | 16.5 | 127.7 | 26.1 | 45 |
| 64 | 3.6 | 7.7 | 19.9 | 36.1 | 93.6 | |
| 66 | 4.3 | 10.6 | 27 | 179.1 | 185.8 | 100.7 |
| 68 | 9.3 | 10.9 | 53.1 | 315.7 | 58.1 | 177.1 |
| 70 | 9.4 | 10.6 | 57.5 | 367.8 | 197.4 | 576.4 |
| 72 | 8 | 15.3 | 57.2 | 29.3 | 243.9 | 507.8 |
| 75 | 6 | 16.2 | 78.3 | 141.1 | 93 | 280.7 |
| 80 | 8.8 | 12.4 | 75 | 113.2 | 362.1 | |
| 85 | 4.5 | 23.8 | 95.3 | 123.7 | 103.2 | 319.3 |
| 90 | 7.4 | 25 | 100 | 296.3 | 346.8 | 456.4 |
Concentrations of DOC are given in mg/liter, those of methane and CO2 are given in ml/liter, and those of Fe(II), phosphorus, and ammonia are given in micromolar units.
FIG. 2.
Total microbial cell counts (106 cells ml−1) and relative percentages of cells that hybridized with the EUB338 and ARCH915 probes (expressed as % of DAPI-stained cells).
Effect of depth on microbial community structure.
Cells hybridized with probes EUB338 and ARCH915 revealed large prokaryotic populations (>106 cells ml−1) in the water column (Fig. 2). However, the total bacterial and archaeal cells detected by these probes were <50% of the DAPI-stained cells. The mean densities of cells detected with probe EUB338 were 9% for the oxic layer (0.6 × 10⁶ cells ml−1), 14.2% for the chemocline (1.2 × 10⁶ cells ml−1), and 16.7% (1.8 × 10⁶ cells ml−1) for the subchemocline. Cells identified with the ARCH915 probe represented the largest microbial group in the water column, with a maximum percentage for the chemocline (21% of DAPI-stained cells; 1.7 × 10⁶ cells ml−1). They accounted for 14.5% of DAPI-stained cells in the oxic layer (0.9 × 10⁶ cells ml−1) and for 17% in the subchemocline (1.8 × 10⁶ cells ml−1). Like Eubacteria, Archaea reached their highest densities at 85 m (2.4 × 10⁶ cells ml−1). The ratio of Archaea to Eubacteria ranged from 0.8 to 4.1 (mean ratio, 1.5), with distinct maxima at 57 m and 68 m (4.1 and 2.7, respectively).
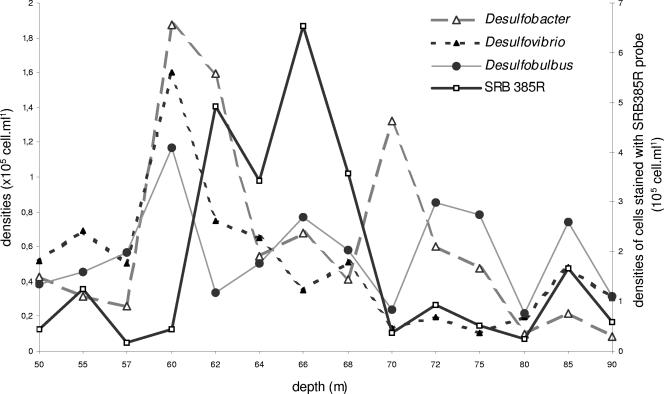
Sulfate-reducing members of the δ-subclass of Proteobacteria targeted with the probe SRB385R were detected within the entire water column (Fig. 3) but were more dominant in the chemocline, with a maximum of 44% of Eubacteria counts (mean levels, 0.6 × 10⁵ cells ml−1 in the oxic layer, 3.2 × 10⁵ cells ml−1 in the chemocline, and 0.8 × 10⁵ cells ml−1 in the subchemocline). Large numbers of target cells (>105 cells ml−1) were found with the Desulfobacter 129F, Desulfovibrio 687R, and Desulfobulbus 660R probes (Fig. 3), and maximum abundances occurred at the oxic-anoxic interface (Desulfobacter, 1.8 × 10⁵ cells ml−1; Desulfovibrio, 1.6 × 10⁵ cells ml−1; and Desulfobulbus, 1.2 × 10⁵ cells ml−1). However, in comparison with the distribution of cells detected with the SRB385R probe, these genera described only a small fraction of the SRB inhabiting the chemocline.
FIG. 3.
Profiles of cell counts stained with SRB385R (SRB belonging to δ subdivision of Proteobacteria), 129F (Desulfobacter), 660R (Desulfobulbus), and 687R (Desulfovibrio) probes (105 cells ml−1).
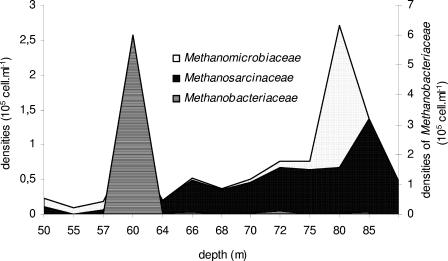
Methanosarcinales (including Methanosaeta and Methanosarcina) detected by the MSMX860 probe accounted for 0.6% of the archaeal community in the oxic layer, 2.8% in the chemocline, and 4.8% in the subchemocline (Fig. 4). The Methanomicrobiales, detected by the MG1200 probe, peaked at 80 m (1.4 × 10⁵ cells ml−1) but were almost negligible in the rest of the water column. In contrast, the Methanobacteriales, detected by the MB1174 probe, were most dominant at the interface of the oxic and anoxic parts of the water column (28% of the Archaea at 60 m).
FIG. 4.
Profiles of cell counts stained with MB1174 (Methanobacteriaceae), MSMX860 (Methanosarcinaceae), and MG1200 (Methanomicrobiaceae) probes (105 cells ml−1).
Diversity of 16S rRNA genes.
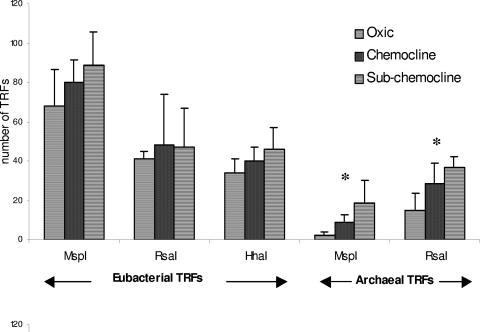
Eubacterial and archaeal 16S rRNA genes were digested with three (MspI, RsaI, and HhaI) and two (MspI and RsaI) separate single enzymes, respectively. Each individual cleavage reaction for each group showed the same trend (Fig. 5): the phylotypic richness (S = number of TRFs) of eubacterial (Seub) and archaeal (Sarch) communities increased in the anoxic zone, with a maximum number of TRFs in the subchemocline. Differences in S values between the three zones were significant for archaeal communities (P < 0.05); however, if the same trend was observed with the three independent restriction digests, no significant statistical differences were observed for Seub.
FIG. 5.
Evolution of eubacterial and archaeal phylotype richness (S = number of TRFs) between the three zones studied for each independent restriction digest. *, statistically significant evolution (ANOVA analysis; P < 0.05).
The results obtained with MspI for Eubacteria and with RsaI for Archaea yielded the largest numbers of TRFs and thus presented the highest level of resolution (8), and for further analyses, the results presented are those obtained with these restriction digests.
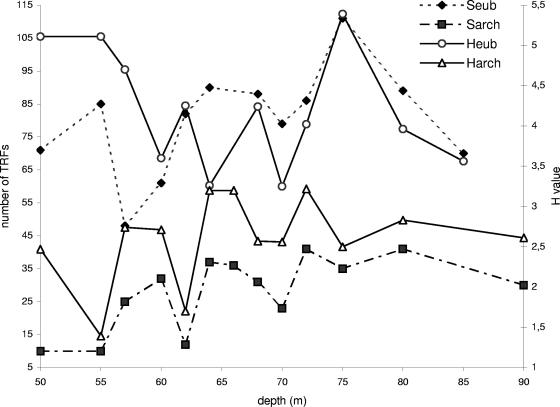
A greater total number of eubacterial TRFs (350; MspI digestion) than of archaeal TRFs (101; RsaI digestion) was observed. S values for both eubacterial and archaeal TRF profiles revealed a substantial richness in the anoxic layer (Fig. 5), especially in the subchemocline (Seub = 89 [MspI]; Sarch = 37 [RsaI]). Phylotype richness profiles (Fig. 6) show intrazone variability for both Sarch (e.g., 12 TRFs at a 62-m depth and 37 TRFs at a 64-m depth) and Seub (e.g., 85 TRFs at a 55-m depth and 48 TRFs at a 57-m depth). The maximum value for Seub was obtained at a 75-m depth (Seub = 111), whereas no significant increase was observed for Sarch at this location.
FIG. 6.
Spatial evolution of phylotype richness (S) and Shannon-Weiner indexes (H) for eubacterial (Seub, Heub; MspI digestion) and archaeal (Sarch, Harch; RsaI digestion) communities.
Comparison of bacterial and archaeal communities.
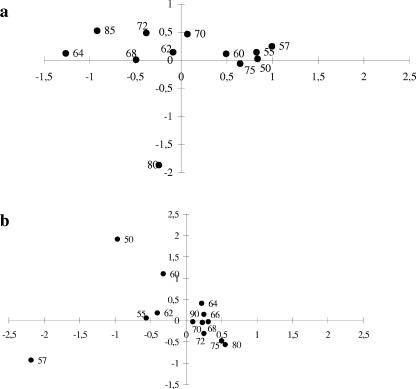
TRFLP profiles were compared on the basis of the presence or absence of TRFs by COA. The COA obtained with archaeal 16S rRNA gene patterns (Fig. 7b) showed a clear distinction between two sets on the horizontal axis (the more discriminant axis). One set grouped samples from the oxic points (50, 55, and 57 m) with the upper points of the chemocline (60 m and 62 m). The second cluster illustrated a striking relationship for anoxic samples between 64 and 90 m. The COA result obtained with eubacterial TRFs (Fig. 7a) was quite similar to that obtained with archaeal TRFs, except for the results for 75-m and 80-m depths. At these anaerobic depths, the eubacterial TRFs did not cluster with those for other anoxic points.
FIG. 7.
COA analyses of TRF relationships between sample locations. (a) Eubacterial TRFs from MspI cleavages. (b) Archaeal TRFs from RsaI cleavages.
A determination of the number of TRFs specific to one zone revealed that 7% of eubacterial and 12% of archaeal TRFs were specific to the oxic layer, while 61% of eubacterial and 67% of archaeal TRFs occurred exclusively in the anoxic zone. For both Eubacteria and Archaea, some TRFs differed between the chemocline and the subchemocline (19% of eubacterial TRFs and 23% of archaeal TRFs were specifically restricted to the chemocline, while 21.5% of eubacterial TRFs and 14% of archaeal TRFs were restricted to the subchemocline).
Evaluation of bacterial and archaeal communities.
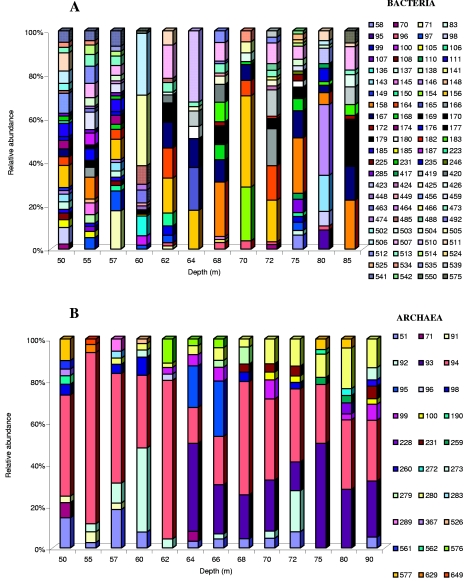
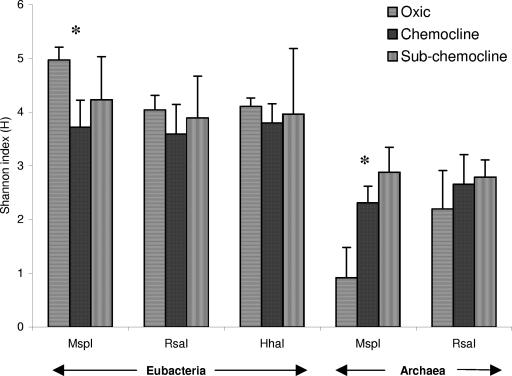
TRFLP profiles were compared by calculating the relative abundances of individual TRFs within samples. Histograms are displayed for fragments with relative abundances of >1% (Fig. 8). No eubacterial TRF (>1%) was found in all sampled depths, whereas the 94-bp dominant TRF (16 to 64%) was common to all archaeal communities. Twelve archaeal fragments (e.g., 96 bp at 62 m and 190 bp and 577 bp at 50 m) occurred exclusively at one depth, but no large single fragment dominated at any one sample location. For Eubacteria, 29 fragments were restricted to one depth, with four dominant fragments among them (71 bp [17%] at 57 m, 146 bp [30%] at 80 m, 154 bp [20%] at 70 m, and 510 bp [27%] at 64 m). Some TRFs, such as the eubacterial 97-bp TRF between 55 and 62 m and the 93-bp archaeal TRF from 64 m to 90 m, were characteristic of successive sample locations. The most obvious changes within the community structure involved the Eubacteria, while the archaeal community remained rather stable. The oxic-anoxic layer transition was characterized by a striking change in the eubacterial community pattern. In the oxic zone, no very dominant eubacterial TRFs occurred, while the anoxic zone (specifically the chemocline) was dominated by a few phylotypes (e.g., the 505-bp and 506-bp TRFs at 60 m and the 154-bp and 156-bp TRFs at 70 m represented 69% and 53%, respectively, of the relative abundances). To compare communities by considering two parameters, the relative abundance of terminal fragments (richness) and the communities' relative abundances (evenness), the Shannon-Weiner index was calculated for eubacterial (Heub) and archaeal (Harch) communities. The different independent eubacterial or archaeal restriction digests showed the same trend (Fig. 9). For Archaea, an increase in Harch was observed between the three zones, and Harch highly significantly reflected Sarch (r = 0.82; P < 0.01) (Fig. 6), unlike the case for Eubacteria, where a decrease in Heub was noticed in the chemocline (for MspI digestion, P < 0.05) (Fig. 9). Heub indicated an opposite trend from that of Seub, suggesting that the bacterial communities were less diverse in the chemocline (Fig. 6) than those from the oxic environment (e.g., for MspI digestion, Heub [oxic zone] = 5 and Heub [chemocline] = 3.7).
FIG. 8.
Relative abundances of TRFs from bacterial (A) and archaeal (B) 16S rRNA genes. Diagrams show the results after cleavage with MspI (bacteria) and RsaI (archaea). Numbers in the keys indicate the lengths of the TRFs, in base pairs, for fragments with a relative abundance of >1%.
FIG. 9.
Evolution of eubacterial and archaeal Shannon-Weiner indexes (H) between the three zones studied for each independent restriction digest. *, statistically significant evolution (ANOVA analysis; P < 0.05).
DISCUSSION
In this study, the microbial diversity and community structure within the water column in the meromictic Lake Pavin were estimated. The microbial ecology of such lakes is of specific interest because the chemocline is believed to spatially separate distinct microbial communities. Moreover, previous geochemical studies of Lake Pavin have shown that the monimolimnion is in a steady state (28). This ecosystem appears to be an ideal site to investigate the diversity, distribution, and function of bacterioplankton because spatial variations in microbial communities should be addressed to the strong and persistent chemical gradient. This lake is also an anomalous environment in that it has high concentrations of DOC and dissolved inorganic phosphorus and high standing crops of bacteria.
Due to the poor culturability of natural bacteria, particularly anaerobic bacteria, we have used molecular approaches based on 16S rRNA genes to investigate the microbial community structure in the water column of Lake Pavin. TRFLP analysis has been demonstrated to be a robust and reproducible methodology for the rapid analysis of microbial community structures in different samples and for the study of community dynamics and changes in community structure in response to changes in prevailing physicochemical parameters (30). However, the observation of Wintzingerode et al. (44), who state that “each physical, chemical and biological step involved in the molecular analysis of an environment is a source of bias which will lead to distorted view of the real world,” is as applicable to this technique as to any of the other methodologies currently used in microbial ecology. We caution that data obtained by using TRFLP analysis contain several sources of potential bias, especially for semiquantitative analysis. For example, the number of populations represented in the fingerprint of any given community depends on the rank abundance of each population. Microbial populations that are not numerically dominant are not represented because the template DNAs from these populations represent a small fraction of the total community DNA. Consequently, the species diversity of the microbial community is underestimated (23). Differences in gene copy number between species (organisms belonging to the domain Eubacteria can have one to seven or more copies of the 16S rRNA gene [32]) and bias introduced during cell lysis, DNA extraction, and PCR amplification may yield a mixture of products that do not accurately reflect the rank abundance of the original community DNA template, thus skewing the apparent abundance of different populations. To minimize deviations between samples, the protocol for TRFLP analysis was standardized (e.g., the number of cycles of PCR, the use of a capillary-based electrophoresis system with automated sample loading [30], and analysis of the 5′-end region of the gene, which provides greater discrimination [39]) in this study to yield high-quality fingerprints.
A conclusive result of our study is the complete shift in the composition of the microbial assemblages between the mixolimnion and the monimolimnion, as shown by COA analyses. One cluster grouped together the upper depths (except for 75 m for eubacterial TRFs), and the second cluster illustrated a striking relationship (especially for Archaea) between deep anoxic sample locations. Few phylotypes found in the oxic layer were recovered in the monimolimnion (61% of eubacterial TRFs and 67% of archaeal TRFs were characteristic of the anoxic zone). The results were in agreement with the drastic stratification of the environment and clearly separated two microbial communities. Relative to what has been found for other anoxic environments (6, 18, 24, 42), the global diversity of the Lake Pavin monimolimnion is quite elevated, as indicated by the phylotype richness values and diversity index that we calculated. TRFLP analysis performed with Eubacteria (MspI) yielded between 50 and 90 peaks for most profiles (Fig. 6). These results are very similar to those of Vetriani et al. (42) for the Black Sea, who also noticed that the diversity of Archaea in the Black Sea appeared to be quite low compared to the bacterial diversity. Within the Lake Pavin water column studied, diversity seems to be higher in anoxic deep water than in oxic sample locations. For Archaea, the number of TRFs was twice as large for the subchemocline samples (for RsaI digestion, P < 0.05) as for the oxic samples. This tendency was also noticed for Eubacteria: the oxic layer contained on average 68 eubacterial TRFs, and the deep anoxic water contained 89 eubacterial TRFs (MspI digestion). This trend was observed for the three independent restriction digests, suggesting that Seub tends to increase in the anoxic layer. These conclusions are in contrast to those of previous studies of Mono Lake assemblages based on denaturing gradient gel electrophoresis (DGGE) analysis (17) or of a similar DGGE-based study of Lake Sælenvannet (31), which revealed greater specific diversity in the oxic zones. However, our results are in agreement with those of Madrid et al. (24) and Humayoun et al. (18), who also found more bacterial diversity in anoxic deep water than in oxic surface water. Nevertheless, care must be taken when comparing bacterial diversity in the oxic and anoxic zones defined in our study. Our sampling points in the oxic zone reflect only part of the mixolimnion, which is subjected to marked seasonal variations in its upper part (light intensity, temperature, and nutrient loading) which can lead to temporal variations in the number of TRFs. Boucher et al. (7) revealed that between 69 and 133 and between 71 and 102 eubacterial TRFs occurred in the epilimnion and the metalimnion, respectively, of Lake Pavin (with MspI digests), suggesting that the eubacterial diversity in anoxic bottom water is quite similar to that found in the upper part of the water column.
A likely explanation, postulated by Humayoun et al. (18), for the discrepancy between studies based on DGGE analysis (17, 31) and those based on methods with a higher resolution, such as cloning-sequencing approaches (18, 24) or TRFLP (29), on the diversity of anoxic versus oxic layers is that most phylotypes found in deep water were present at a very low relative abundance and thus formed faint bands that were not readily detected by DGGE. This hypothesis is consistent with our data which indicate the presence of sparsely occurring eubacterial phylotypes, especially in the chemocline (as revealed by the noncorrelation between Heub and Seub [r = 0.13; P < 0.05]) (Fig. 6). A few TRFs dominated the chemocline, as shown in Fig. 8 (e.g., at the 70-m depth 79 TRFs were observed, and among them, the 154- and 156-bp TRFs represented 53% of the total peak area). A highly diverse microbial community dominated by a few species was also observed in the chemocline of Lake Cadagno (6), and Holfe and Brettar (16) found the largest number of dominant taxa in the biologically most active regions of the water column. These observations suggest a preponderant role for the interface community within the chemocline in the overall functioning of Lake Pavin.
The present study shows a prevalence of Archaea throughout the water column, and their presence in the oxic zone agrees with the statement that they are much more diverse and widespread than was previously suspected. Representatives have been detected in terrestrial environments, marine and lake sediments, temperate ocean waters, and polar seas (10). Delong et al. (12) and Massana et al. (27) have shown that planktonic Archaea occur at a high relative abundance in the oceanic subsurface, and this group has been shown to dominate the prokaryotic fraction in the mesopelagic zone of the Pacific Ocean (21). Additional evidence demonstrating the wide distribution of Archaea in oxic and anoxic marine sediments and in the water column has been obtained by using lipids as biological markers for the detection of these microorganisms (11, 15).
However, if Archaea appear to be an essential part of the prokaryotic assemblages in the water column of Lake Pavin, our observations may have arisen in part because of a lack of specificity of the ARCH915 domain probe, which has been shown to hybridize nonspecifically to some members of the Eubacteria (33). The presence of archaeal TRFs in oxic locations confirms that Archaea occurred in the oxic layer of Lake Pavin. These archaeal TRFs were clearly discriminated from those of the deeper layer, suggesting that these species exhibit particular phenotypic characteristics. Vetriani et al. (42) noticed that the upper-depth profiles for depths above the chemocline of the Black Sea were largely colonized by members of the marine planktonic group II (related to the order Thermoplasmales). They also found that in contrast to the relative homogeneity of the Archaea found in the oxic upper water column of the Black Sea, the deeper anoxic profile revealed a more complex structure. In the water column of Lake Pavin, we have noticed a significant increase in archaeal TRFs, but relative homogeneity in the structure of this community was observed throughout the water column (Fig. 8). The significant increase in the number of archaeal TRFs in and below the chemocline is consistent with the observations of Ovreas et al. (31) and with the known phenotypic characteristics of these organisms, which in mesophilic habitats are predominantly anaerobic methanogens. If the increase of Sarch for the deeper anoxic points appears to be in agreement with the intrinsic characteristics of these organisms, at this state of the study of anaerobic microbial communities of Lake Pavin we can only formulate a hypothesis to explain the high global diversity observed for Eubacteria.
Geochemical studies have shown that the Lake Pavin monimolimnion exhibits a wide diversity of dissolved or particulate compounds, such as manganese, particulate ferric and ferrous iron, copper, sulfate, and different trace elements such as molybdenum, uranium, vanadium, mercury, etc. (43). The strong physicochemical gradients in the Lake Pavin monimolimnion no doubt contribute to the overall diversity of the bacterioplankton in the lake by supporting a range of redox environments (niches). No significant correlations have been found between the spatial occurrence of eubacterial TRFs and the physicochemical parameters determined in this study. This observation suggests that other physicochemical parameters predominantly act in the structure of eubacterial communities and/or that the complex network of metabolic interactions established by anaerobic microorganisms governs the organization of microbial communities. This last hypothesis could explain the elevated diversity of monimolimnion bacterial populations. It may be possible that microorganisms which exhibit anaerobic metabolism, which is less energetically efficient than oxygen-dependent metabolism, maintain a higher diversity of energetic pathways in anoxic environments. This network could lead to the retention of higher metabolic diversity, and as postulated by Humayoun et al. (18), ecological forces that act to structure aerobic microbial communities are fundamentally different from those that act to structure anaerobic microbial communities.
A striking difference in microbial patterns between oxic and anoxic layers was reported above; however, strong intrazone variabilities in the eubacterial or archaeal phylotypic richness could also be observed. This is probably one of the main original observations of our study. Several successive sample points were collected for each physicochemically defined zone (e.g., six depths were sampled with 2 m of resolution for the chemocline), and this sampling strategy suggests that extrapolations about microbial community structure and diversity based on only one sampled point in a defined zone could yield false conclusions. This intrazone variability explains why the increase in the number of eubacterial TRFs (Seub) was not statistically significant between the three water layers (high standard deviations). An example of this intrazone variability is illustrated by the COA analysis of eubacterial TRFs, which showed a striking relationship among TRFs from anoxic samples, except for the 75-m sample. This last sample presents a greater similarity with the TRFs from the oxic layer, suggesting that an unknown factor affects the structure of the microbial community, and considering that the current state of inflow and outflow of water is negative in Lake Pavin, we could suggest a sublacustrine water input.
Distribution of SRB and methanogens according to depth.
The high SRB densities in the chemocline detected by the SRB385R probe account for 44% of the Eubacteria. This supports the suggestion of a biogenic origin for the H2S found in the anoxic zone of Lake Pavin (2). The genera Desulfobulbus, Desulfobacter, and Desulfovibrio, targeted with specific probes (660R, 129F, and 687R, respectively), described only a small fraction of the SRB quantified in the chemocline, which means that other groups of SRB are involved in the sulfate reduction activity in this zone. These genera presented density peaks at the aerobic/anaerobic interface (>105 cells ml−1), where their accumulated abundances were greater than the abundances of SRB determined with the probe SRB385R. This discrepancy can be explained by the work of Ramsing et al. (34), who revealed that members of the genera Desulfobacter and Desulfomicrobium as well as all species belonging to the genera Desulfobacterium, Desulfosarcina, Desulfobacula, Desulfococcus, Desulfoarculus, and Desulfomonile displayed at least one mismatch within the targeted region, resulting in an underestimation of SRB.
The very clear-cut bipartite distribution of the genus Desulfovibrio has also been observed in the sediments of an oligotrophic lake (37). The great abundance of the genus Desulfobulbus, also noted in a stratified fjord (34) and in lake sediments (22), is in favor of a major role of this genus in sulfate reduction activity. The presence of these genera in the oxic zone is consistent with their physiological characteristics, notably their oxygen respiration ability (26). High sulfate reduction rates and high counts of sulfate-reducing bacteria have repeatedly been reported for oxic marine sediments and microbial mats (40). The presence of SRB cells in the oxic layer of Lake Pavin could suggest the existence of a specific physiological group adapted to live under oxygenic conditions, as epifluorescence microscopy observations revealed that some SRB cells appeared to be associated with detritic particles, which may provide anaerobic microhabitats that favor their activities.
The targeted methanogen families, Methanobacteriaceae (hydrogenotrophic methanogens), Methanomicrobiaceae (hydrogenotrophic methanogens), and Methanosarcinaceae (aceticlastic methanogens), were present in all samples from the anoxic water column. The accumulated densities of these three groups peaked at 60 m (31.2% of the Archaea targeted with ARCH915). Among the three target groups of methanogens, the Methanosarcinaceae dominated the methane-rich depth interval below the chemocline. We noticed that methane concentrations were only correlated with the density of the Methanosarcinaceae (r = 0.64; P < 0.05), suggesting that this group plays an important role in the global methane budget of the Lake Pavin anoxic zone. This group has been reported from other anoxic aquatic systems, e.g., Vetriani et al. (42) revealed that 10% of clones were placed within the Methanobacteriaceae and the Methanosarcinaceae for the anoxic region of the Black Sea water column. Ovreas et al. (31) showed that methanogenic bacteria in the water column of Lake Sælenvannet belonged to the Methanomicrobiales and Methanosarcinales; this is in agreement with our study, which shows that among the three families targeted, the Methanosarcinales and the Methanomicrobiales were detected within the entire anoxic water column.
The simultaneous occurrence of SRB and MPA in the sulfate-limited monimolimnion of Lake Pavin (28) can be explained by alternative anaerobic processes to sulfate reduction, for example, dissimilatory Fe(III) reduction. This process could occur in the entire anoxic water column but probably occurs mainly in the chemocline because of the accumulation of particulate ferric iron (28), the elevated concentrations of Fe(II), and the high densities of SRB.
Supplementary Material
Acknowledgments
We are grateful to G. Mailhot (Photochemistry Laboratory of University of Clermont II) for help with DOC and ferrous iron data and to C. Faye (Biogema Institute, Clermont-Ferrand), who supplied capillary electrophoresis equipment for TRFLP analysis. We thank the Geochemistry Laboratory (University of Paris VII), particularly F. Prévot, D. Jézéquel, and N. Assayag, for providing the experimental setup for gas analysis and also for many helpful discussions on Lake Pavin geochemical processes. Many thanks are also addressed to K. Joblin (AgResearch, New Zealand) for his advice and to G. Demeure, J. C. Romagoux, and D. Sargos for their skilled technical assistance.
Footnotes
Supplemental material for this article may be found at http://aem.asm.org/.
REFERENCES
- 1.Amann, R. I., L. Krumholz, and D. A. Stahl. 1990. Fluorescent-oligonucleotide probing of whole cells for determinative, phylogenetic, and environmental studies in microbiology. J. Bacteriol. 172:762-770. [DOI] [PMC free article] [PubMed] [Google Scholar]
- 2.Amblard, C., and F. Restituito. 1983. Observations complémentaires en faveur de l'origine biogénique de la couche à hydrogène sulfuré d'un lac de moyenne montagne (Lac Pavin, France). C. R. Acad. Sci. 296:1787-1790. [Google Scholar]
- 3.Ausubel, F. M., R. Brent, R. E. Kingston, D. D. Moore, J. A. Smith, J. A. Sideman, and K. Struhl (ed.). 1987. Current protocols in molecular biology, section 24. John Wiley & Sons, New York, N.Y.
- 4.Azam, F., T. Fenchel, J. G. Field, J. S. Gray, L. A. Meyer-Riel, and F. Thingstad. 1983. Ecological role of water column microbes in the sea. Mar. Ecol. Prog. Ser. 10:257-263. [Google Scholar]
- 5.Béjá, O., E. V. Koonin, L. Aravind, L. T. Taylor, H. Seitz, J. L. Stein, D. C. Bensen, R. A. Feldman, R. V. Swanson, and E. F. DeLong. 2002. Comparative genomic analysis of archaeal genotypic variants in a single population and in two different oceanic provinces. Appl. Environ. Microbiol. 68:335-345. [DOI] [PMC free article] [PubMed] [Google Scholar]
- 6.Bosshard, P. P., Y. Santini, D. Grüter, R. Stettler, and R. Bachofen. 2000. Bacterial diversity and community composition in the chemocline of the meromictic alpine lake Cadagno as revealed by 16S rDNA analysis. FEMS Microbiol. Ecol. 62:2138-2144. [DOI] [PubMed] [Google Scholar]
- 7.Boucher, D., L. Jardillier, and D. Debroas. Succession of bacterial community composition over two consecutive years in two aquatic systems: a natural lake and a lake-reservoir. FEMS Microbiol. Ecol., in press. [DOI] [PubMed]
- 8.Braker, G., H. L. Ayala-Del-Río, A. H. Devol, A. Fesefeldt, and J. M. Tiedje. 2001. Community structure of denitrifiers, bacteria, and archaea along redox gradients in Pacific Northwest marine sediments by terminal restriction fragment length polymorphism analysis of amplified nitrite reductase (nirS) and 16S rRNA genes. Appl. Environ. Microbiol. 67:1893-1901. [DOI] [PMC free article] [PubMed] [Google Scholar]
- 9.Brosius, J., M. L. Palmer, P. J. Kennedy, and H. R. Noller. 1978. Complete nucleotide sequence of a 16S ribosomal RNA gene from Escherichia coli. Proc. Natl. Acad. Sci. USA 75:4801-4805. [DOI] [PMC free article] [PubMed] [Google Scholar]
- 10.Delong, E. F. 1998. Everything in moderation: archaea as “non-extremophiles.” Curr. Opin. Genet. Dev. 8:649-654. [DOI] [PubMed] [Google Scholar]
- 11.Delong, E. F., L. L. King, R. Massana, H. Cittone, A. Murray, C. Schleper, and S. G. Wakeham. 1998. Dibiphytanyl ether lipids in nonthermophilic crenarchaeotes. Appl. Environ. Microbiol. 64:1133-1138. [DOI] [PMC free article] [PubMed] [Google Scholar]
- 12.Delong, E. F., L. T. Taylor, T. L. Marsh, and C. M. Preston. 1999. Visualization and enumeration of marine planktonic archaea and bacteria by using polyribonucleotide probes and fluorescent in situ hybridization. Appl. Environ. Microbiol. 65:5554-5563. [DOI] [PMC free article] [PubMed] [Google Scholar]
- 13.Devereux, R., D. K. Matthew, J. Winfrey, and D. A. Stahl. 1992. Genus- and group-specific hybridization probes for determinative and environmental studies of sulfate-reducing bacteria. Syst. Appl. Microbiol. 15:601-609. [Google Scholar]
- 14.Glöckner, F. O., R. Amann, A. Alfreider, J. Pernthaler, R. Psenner, K. Trebesius, and K.-H. Schleifer. 1996. An in situ hybridization protocol for detection and identification of planktonic bacteria. Syst. Appl. Microbiol. 19:403-406. [Google Scholar]
- 15.Hoefs, M. J. L., S. Schouten, J. W. De Leeuw, L. L. King, S. G. Wakeham, and J. S. Sinninghe Damsté. 1997. Ether lipids of planktonic Archaea in marine water column. Appl. Environ. Microbiol. 63:3090-3095. [DOI] [PMC free article] [PubMed] [Google Scholar]
- 16.Holfe, M. G., and I. Brettar. 1995. Taxonomic diversity and metabolic activity of microbial communities in the water column of the Central Baltic Sea. Limnol. Oceanogr. 40:868-874. [Google Scholar]
- 17.Hollibaugh, J. T., P. S. Wong, N. Bano, S. K. Pak, E. M. Prager, and C. Orrego. 2001. Stratification of microbial assemblages in Mono Lake, California, and response to a mixing event. Hydrobiologia 466:45-60. [Google Scholar]
- 18.Humayoun, S. B., N. Bano, and J. T. Hollibaugh. 2003. Depth distribution of microbial diversity in Mono Lake, a meromictic soda lake in California. Appl. Environ. Microbiol. 69:1030-1042. [DOI] [PMC free article] [PubMed] [Google Scholar]
- 19.Jardillier, L., M. Basset, I. Domaizon, A. Belan, C. Amblard, M. Richardot, and D. Debroas. 2004. Bottom-up and top-down control of bacterial community composition in the euphotic zone of a reservoir. Aquat. Microbiol. Ecol. 35:259-273. [Google Scholar]
- 20.Kalver, J. G., and S. J. M. Pitts (ed.). 1966. Photochemistry, p. 783. John Wiley & Sons, New York, N.Y.
- 21.Karner, M. B., E. F. Delong, and D. M. Karl. 2001. Archaeal dominance in the mesopelagic zone of the Pacific Ocean. Nature 409:507-510. [DOI] [PubMed] [Google Scholar]
- 22.Li, J., K. J. Purdy, S. Takii, and H. Hayashi. 1999. Seasonal changes in ribosomal RNA of sulfate-reducing bacteria and sulfate-reducing activity in a freshwater lake sediment. FEMS Microbiol. Ecol. 28:31-39. [Google Scholar]
- 23.Liu, W. T., T. L. Marsh, H. Cheng, and L. J. Forney. 1997. Characterization of microbial diversity by determining terminal restriction fragment length polymorphism of genes encoding 16S rRNA. Appl. Environ. Microbiol. 63:4513-4522. [DOI] [PMC free article] [PubMed] [Google Scholar]
- 24.Madrid, V., G. Taylor, M. Scranton, and A. Chistoserdov. 2001. Phylogenetic diversity of bacterial and archaeal communities in the anoxic zone of the Cariaco Basin. Appl. Environ. Microbiol. 67:1663-1674. [DOI] [PMC free article] [PubMed] [Google Scholar]
- 25.Margalef, R. 1958. Information theory in ecology. Gen. Syst. 3:36-71. [Google Scholar]
- 26.Marshall, C., P. Frenzel, and H. Cypionka. 1993. Influence of oxygen on sulfate reduction and growth of sulfate reducing bacteria. Arch. Microbiol. 159:168-173. [Google Scholar]
- 27.Massana, R., E. F. Delong, and C. Pedros-Alió. 2000. A few cosmopolitan phylotypes dominate planktonic archaeal assemblages in widely different oceanic provinces. Appl. Environ. Microbiol. 66:1777-1787. [DOI] [PMC free article] [PubMed] [Google Scholar]
- 28.Michard, G., D. J'ézéquel, F. Prévot, G. Sarazin, and E. Viollier. Biogeochemical processes in Lake Pavin. Unpublished data.
- 29.Moeseneder, M., J. M. Arrieta, G. Muyzer, C. Winter, and G. Herndl. 1999. Optimization of terminal-restriction fragment length polymorphism analysis for complex marine bacterioplankton communities and comparison with denaturing gradient gel electrophoresis. Appl. Environ. Microbiol. 65:3518-3525. [DOI] [PMC free article] [PubMed] [Google Scholar]
- 30.Osborn, A. M., E. R. B. Moore, and K. N. Timmis. 2000. An evaluation of terminal-restriction fragment length polymorphism analysis for the study of microbial community structure and dynamics. Environ. Microbiol. 2:39-50. [DOI] [PubMed] [Google Scholar]
- 31.Ovreas, L., L. Forney, F. L. Daae, and V. Torsvik. 1997. Distribution of bacterioplankton in meromictic Lake Sælenvannet, as determined by denaturing gradient gel electrophoresis of PCR-amplified gene fragments coding for 16S rRNA. Appl. Environ. Microbiol. 63:3367-3373. [DOI] [PMC free article] [PubMed] [Google Scholar]
- 32.Pederson, K., L. Hallbeck, J. Arlinger, A. Erlandson, and N. Jahromi. 1997. Investigation of the potential for microbial contamination of deep aquifers during drilling using 16S rDNA gene sequencing and culturing methods. J. Microbiol. Methods 30:179-192. [Google Scholar]
- 33.Pernthaler, A., C. M. Preston, J. Pernthaler, E. F. DeLong, and R. Amann. 2002. Comparison of fluorescently labeled oligonucleotide and polynucleotide probes for the detection of pelagic marine bacteria and archaea. Appl. Environ. Microbiol. 68:661-667. [DOI] [PMC free article] [PubMed] [Google Scholar]
- 34.Ramsing, N. B., H. Fossing, T. G. Ferdelman, F. Andersen, and B. Thamdrup. 1996. Distribution of bacterial populations in a stratified fjord (Mariager Fjord, Denmark) quantified by in situ hybridization and related to chemical gradients in the water column. Appl. Environ. Microbiol. 62:1391-1404. [DOI] [PMC free article] [PubMed] [Google Scholar]
- 35.Raskin, L., J. M. Stromley, B. E. Rittmann, and D. A. Stahl. 1994. Group-specific 16S rRNA hybridization probes to describe natural communities of methanogens. Appl. Environ. Microbiol. 60:1232-1240. [DOI] [PMC free article] [PubMed] [Google Scholar]
- 36.Sass, A. M., H. Sass, M. J. L. Coolen, H. Cypionka, and J. Overmann. 2001. Microbial communities in the chemocline of a hypersaline deep-sea basin (Urania Basin, Mediterranean Sea). Appl. Environ. Microbiol. 67:5392-5402. [DOI] [PMC free article] [PubMed] [Google Scholar]
- 37.Sass, H., H. Cypionka, and H. D. Babenzien. 1997. Vertical distribution of sulfate-reducing bacteria at the oxic-anoxic interface in sediments of the oligotrophic Lake Stechlin. FEMS Microbiol. Ecol. 22:245-255. [Google Scholar]
- 38.Stahl, D. A., and R. Amann. 1991. Development and application of nucleic acid probes, p. 205-248. In E. Stackebrandt and M. Goodfellow (ed.), Nucleic acid techniques in bacterial systematics. John Wiley & Sons Ltd., West Sussex, United Kingdom.
- 39.Suzuki, M., M. S. Rappé, and S. J. Giovannoni. 1998. Kinetic bias in estimates of coastal picoplankton community structure obtained by measurements of small-subunit rRNA gene PCR amplicon length heterogeneity. Appl. Environ. Microbiol. 64:4522-4529. [DOI] [PMC free article] [PubMed] [Google Scholar]
- 40.Teske, A., C. Wawer, G. Muyzer, and N. B. Ramsing. 1996. Distribution of sulfate-reducing bacteria in a stratified fjord (Mariager Fjord, Denmark) as evaluated by most probable number counts and denaturing gradient gel electrophoresis of PCR-amplified ribosomal DNA fragments. Appl. Environ. Microbiol. 62:1405-1415. [DOI] [PMC free article] [PubMed] [Google Scholar]
- 41.Tuomi, P., T. Torsvik, M. Heldal, and G. Bratbak. 1997. Bacterial population dynamics in a meromictic lake. Appl. Environ. Microbiol. 63:2181-2188. [DOI] [PMC free article] [PubMed] [Google Scholar]
- 42.Vetriani, C., H. V. Tran, and L. J. Kerkhof. 2003. Fingerprinting microbial assemblages from the oxic/anoxic chemocline of the Black Sea. Appl. Environ. Microbiol. 69:6481-6488. [DOI] [PMC free article] [PubMed] [Google Scholar]
- 43.Viollier, E., P. Albéric, D. J'ézéquel, G. Michard, M. Pèpe, and G. Sarazin. 1995. Geochemical study of a crater lake, the Pavin Lake, France. Trace element behaviour in the monimolimnion. Chem. Geol. 125:61-72. [Google Scholar]
- 44.Wintzingerode, P., U. B. Göbel, and E. Stackebrandt. 1997. Determination of microbial diversity in environmental samples: pitfalls of PCR-based analysis. FEMS Microbiol. Rev. 21:213-229. [DOI] [PubMed] [Google Scholar]
Associated Data
This section collects any data citations, data availability statements, or supplementary materials included in this article.


