Abstract
Stoichiometric modeling of the early stages of the citric acid fermentation process by Aspergillus niger revealed that ammonium ions combine with a carbon-containing metabolite inside the cell, in a ratio 1:1, to form a nitrogen compound which is then excreted by the mycelium. High-performance liquid chromatography analysis identified glucosamine as the product of the relationship between glucose and ammonium during the early stages of the citric acid fermentation process. Slightly acidic internal pHs, extremely low ammonium ion concentrations inside the cell, and glucosamine synthesis come into direct contradiction with the earlier theory of the ammonium pool inside the cell, regarded as responsible for inhibition of the enzyme phosphofructokinase. At later fermentation stages, when the mycelium is involved in a process of fragmentation and regrowth, the addition of ammonium sulfate leads to a series of events: the formation and secretion of glucosamine in elevated amounts, the short inhibition of citrate synthesis, growth enhancement, the utilization of glucosamine, and finally, the enhancement of citric acid production rates. Obviously, the enzymatic processes underlining the phenomena need to be reexamined. As a by-product of the citric acid fermentation, glucosamine is reported for the first time here. Suitable process manipulations of the system described in this work could lead to successful glucosamine recovery at the point of its highest yield before degradation by the fungus occurs.
Much has been reported on the mechanism of citric acid accumulation by Aspergillus niger, but the majority of the studies were performed on the main production phase while various aspects of the early stages of the citric acid fermentation still remain unclear today. Citric acid overflow requires a unique combination of several unusual nutrient conditions, i.e., excessive concentrations of carbon source, hydrogen ions, and dissolved oxygen or suboptimal concentrations of certain trace metals and phosphate, which synergistically influence the yield of citric acid (5). Citrate is one of the best known inhibitors of glycolysis, and the ability of A. niger to overproduce citrate by an active glycolytic pathway has therefore attracted biochemical interest for a long time. Under appropriate nutrient conditions, this inhibition is more than counteracted by the accumulation of various positive effectors of the phosphofructokinase gene (pfk1), one of which is ammonium (NH4+), and hence this feedback does not occur (1, 3). Citrate inhibition of pfk1 seems to be antagonized in vivo by ammonium ions (4), and this antagonism is functionally linked to the well-known effect of trace metal ions, particularly manganese ions, on citric acid accumulation (21). A critical role in the citric acid fermentation process by A. niger has been attributed to manga nese ions, the influence of which on protein synthesis was considered to be of major importance since cycloheximide, an inhibitor of de novo protein synthesis, was found to antagonize the effect of manganese addition (21). Cellular anabolism of A. niger is impaired under manganese deficiency and/or nitrogen and phosphate limitation. According to Habison et al. (4) and Röhr and Kubicek (17), the protein breakdown under manganese deficiency results in a high intracellular NH4+ concentration (the “ammonium pool”), which causes inhibition of the enzyme phosphofructokinase, an essential enzyme in the conversion of glucose and fructose to pyruvate, leading to a flux through glycolysis and the formation of citric acid. The high glucose and NH4+ concentrations, on the other hand, strongly repress the formation of 2-oxoglutarate dehydrogenase and thus inhibit the catabolism of citric acid within the tricarboxylic acid cycle (17).
The concentrations of both nitrogen and phosphate are low in media designed for organic acid production by Aspergillus species, but little is known about their mode of influence. In defined media, nitrogen is supplied as ammonium sulfate or ammonium nitrate. The advantage of ammonium salts is that they decrease the pH as they are consumed, which is a prerequisite of citric acid fermentation. Reports concerning the limitation of nitrogen during the production phase of citric acid-producing A. niger cultures have been contradictory. An appropriate balance of nitrogen, phosphate, and certain trace metals appears to be important for the accumulation of citric acid in batch cultures (18). In continuous as well as fed-batch culture, nitrogen must be limiting to attain the highest yields (6). This would be consistent with a role of an inhibited glutamine synthetase in citric acid production as proposed by Punekar et al. (16). On the other hand, it has to be clarified how this fits with the increased intracellular NH4+ levels throughout citric acid fermentation (8) and the stimulation of citric acid production by the addition of extra ammonium sulfate, which is also reported. Exogenous addition of NH4+ during the citric acid fermentation has been found to stimulate the rate of citrate production (2, 22), and this is consistent with the effect of NH4+ on pfk1.
Although several aspects of the role of NH4+ in the regulation of citrate overproduction have been investigated, no information seems to exist in the literature concerning the relationship between ammonium ion concentration in the medium and ammonium ion uptake by the mycelium during the first hours of fermentation, nor that between ammonium ion concentration and proton release. The present work aimed to investigate the particular phase of fermentation and follow stoichiometrically the processes of ammonium ion and glucose uptake. Modeling and subsequent analysis revealed the release of an aminated compound in the fermentation medium at elevated concentrations. This compound, namely, glucosamine, was traced throughout the process of citric acid production, and factors affecting its formation were investigated. Since mycelial fermentations carried out in bioreactors represent morphologically dynamic systems in multifactorial environments, it was considered absolutely necessary to examine the morphology of the fungus and quantify certain morphological parameters with the use of an automated image analysis system. Therefore, the whole system, performed under production conditions, was viewed with respect to the relationship between glucose and ammonium, the biosynthesis of glucosamine, and the dynamics of the morphology of the fungus.
MATERIALS AND METHODS
Microorganism, media, and inoculum preparation.
The organism used in this work was the industrial strain A. niger PM1 (University of Strathclyde, Glasgow, Scotland). This was maintained on molasses agar, which contained 300 g/liter cane molasses (pH adjusted to 6.8) and 18 g/liter agar (technical, grade 3; Oxoid, Basingstoke, United Kingdom). The plates were incubated at 30°C for 7 days. The inoculum was prepared by washing spores from a mature culture plate with 20 ml of sterile distilled water and transferring them aseptically to 50 ml of medium in 500-ml Erlenmayer flasks. The spore content was approximately 107 spores/ml. The shake flasks were incubated at 30°C and 200 rpm in an orbital shaker incubator for 40 h to produce the fermenter inoculum. The contents of six flasks were used to inoculate the bioreactor.
The composition of the standard fermentation medium was the following, in g/liter: d-glucose, 150; (NH4)2SO4, 2.5; MgSO4 · 7H2O, 0.5; KH2PO4, 2.0; Fe3+ [as Fe2(SO)4 · 24H2O], 0.1 × 10⁻³; Zn2+ (as ZnSO4 · 7H2O), 0.1 × 10⁻³; Cu2+ (as CuSO4 · 5H2O), 0.06 × 10⁻³.
Culture conditions.
The stirred tank bioreactor used in this work was a New Brunswick Scientific BIOFLO 410 model with a working volume of 10 liters. The agitation system consisted of three disk turbine impellers, 8 cm in diameter, with six flat blades, operating at a stirrer speed of 600 rpm.
Fed-batch experiments were carried out with a 150-g/liter initial glucose concentration and ammonium sulfate added at three concentrations, 1, 0.5, and 2 g/liter, at a single pulse, at 75 h into the process. Process temperature was maintained at 28°C and the airflow rate at 1 vol/vol/min air/medium (vvm). pH was controlled at 2.1 by the automatic addition of titrants (2 M NaOH and 20% H2SO4 solutions).
Analytical methods.
Dry weights were determined by filtering 20 ml of broth through preweighed glass fiber filters (grade GF/C, 4.25 cm; Whatman International, Maidstone, United Kingdom), washing and drying them in a microwave oven (15 min at low power), and leaving them in a desiccator for 24 h before reweighing. Citric acid was determined by the method of Marier and Boulet (11). Glucose was determined by using a glucose oxidase-peroxidase method as described by Kunst et al. (9). Proton concentration was calculated from pH measurements.
The concentration of ammonium ions in solution was calculated using an ammonium electrode (Asea Brown Boveri/Kent Taylor 8002-8). A protocol was developed (20) to allow for good reproducibility over a large volume of samples and an extended period of time. Concentrations of ammonium ions within the mycelium were calculated by filtering the broth and washing the filter cake with tap water (buffered to the same pH as the broth with HCl). The cells were then resuspended in a small quantity of buffer, and the cell membranes were disrupted by further addition of methanol to make a suspending solution of approximately 50% strength. After standing for 24 h and removal of the solids, the ions were measured with the electrode.
Glucosamine determination was done by high-performance liquid chromatography (HPLC) analysis (using a mass detector). The concentration range of standards [d(+)-glucosamine hydrochloride, C6H13NO5-HCl, molecular weight of 215.6; Sigma] was 30, 15, 7.5, and 3.75 mM, and they were assayed using a Redex RNM carbohydrate column (300 by 7.8 mm; Phenomenex) and a mass detector (Sedex 55). The standards used for glucose were 54, 27, 13.5, and 5.4 mM. The mobile phase was water and the flow rate 0.4 ml/min (0.6 ml/min for glucosamine). The procedure was performed at 85°C and a pressure of 1.9 bars and repeated three times. The software Gilson 715 HPLC was used.
Fungal morphology was characterized by using an automatic image analysis system consisting of an Olympus microscope (Olympus, New Hyde Park, NY) operated as phase contrast, a charge-coupled-device camera (Sony, Cambridge, United Kingdom), a PC with a frame-grabber, and image analysis software (SIS, Olympus, Germany). The inoculum consisted of free mycelial trees that, within 24 h from inoculation, formed microscopic clumps. Mycelial ‘clumps’ are stable particles of intertwined filaments around a small core. They lack the characteristic compact structure of pellets, while they represent the main morphological type for many filamentous fungal fermentations. The preparation of the samples and the measurements were as described in earlier publications (13, 14, 15). A magnification of ×100 was applied for measurements of mean perimeters of clumps (morphology parameter P, μm) and mean lengths of filaments protruding from the cores of mycelial clumps (morphology parameter L, μm). For the detection and characterization of vacuoles, the image was processed, at a magnification of ×400, by means of adjustment of grayness levels, detection of the objects of interest, and binary image processing. The exact method and the quantification of vacuolated areas were described in detail in an earlier publication on the hyphal vacuolation and fragmentation of A. niger (15).
Fermentations were carried out in triplicate. All data presented are averages of results obtained in three or more independent measurements.
RESULTS
Ammonium ion concentration and citric acid fermentation.
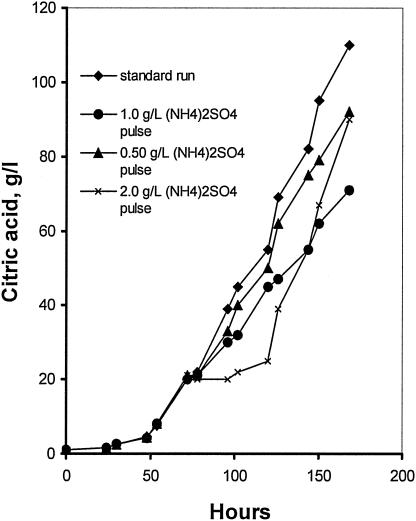
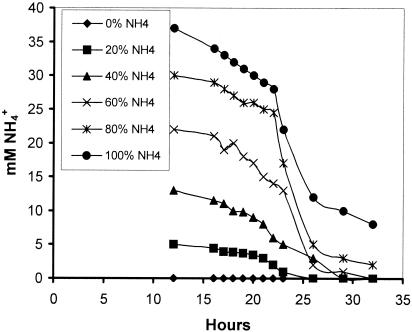
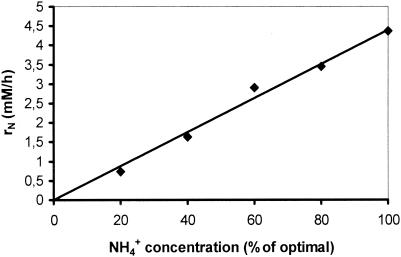
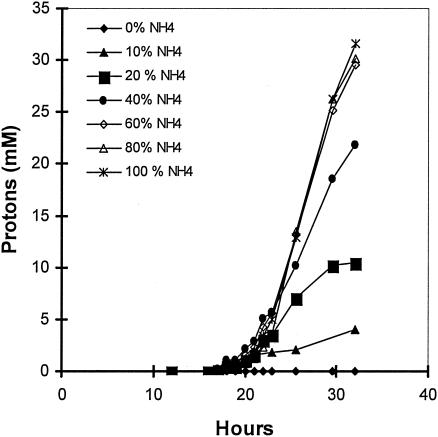
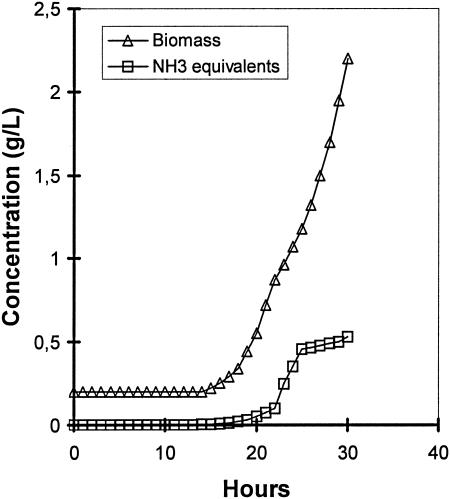
Using the standard medium composition described in Materials and Methods, the final citric acid concentration (168 h of fermentation) reached 110 g/liter (Fig. 1) while mycelium dry weight reached 7.3 g/liter (not shown). Citric acid production rate increased as the NH4+ concentration in the fermentation broth lowered to very low levels after the 24th h from inoculation (Fig. 1 and 2). The effect of different concentrations of (NH4)2SO4 in the medium on the rate of NH4+ uptake (rN, mM/h) was investigated using media containing various fractions (100, 80, 60, 40, 20, and 0%) of the optimal amount of 2.5 g/liter (NH4)2SO4. As Fig. 2 shows, all cultures appeared to have a slow initial uptake, which has no clear relationship with the number of initial ammonium ions. Between approximately 20 and 25 h, the bulk of ammonium was removed from the medium. The rate of uptake does not appear to have any relationship with the amount of biomass present in this stage, as all cultures had identical start points. The rate of uptake does appear to be related to the initial ammonium ion concentration. Figure 3 shows a very clear linear relationship between initial ammonium ion concentration and the rate of the bulk uptake (20 to 25 h). The concentration of protons exported from the biomass appears to be directly related to the initial ammonia concentration for the fermentations performed with up to and including 60% of the optimal amount (Fig. 4). Dry weight and ammonia measurements in fermentations performed with complete medium (Fig. 5) showed that the uptake of ammonia equivalents from the broth is very similar to the increase in biomass in the early phase of fermentation (20 to 25 h from inoculation).
FIG. 1.
Time course of citric acid production in standard conditions and with the addition of 0.5-, 1-, and 2-g/liter pulses of ammonium sulfate.
FIG. 2.
Ammonium ion levels in the broth of fermentations performed with different initial amounts of ammonium ions corresponding to 0, 20, 40, 60, 80, and 100% of 2.5 g/liter ammonium sulfate.
FIG. 3.
Relationship between initial ammonium ion concentration and uptake rate between 20 and 24 h. The trend line is a least-squares fit through the origin. Correlation coefficient r2 = 98.6%.
FIG. 4.
The effect of initial ammonium ion concentration upon proton excretion.
FIG. 5.
Batch profile of biomass concentration and mass of ammonia equivalents from the broth.
Stoichiometric modeling.
A simple stoichiometric model was constructed by calculating the material balances for biomass, glucose, and ammonium ions throughout the first 30 h of fermentation. Raw fermentation data were placed into a spreadsheet (Microsoft Excel), and for each data point, the expected glucose uptake rate was calculated from rN (rate of ammonium ion uptake), rx (rate of biomass formation), and yield coefficients (Y) using the following equations (19):
 |
(1) |
 |
(2) |
 |
(3) |
The calculated value for rs was compared with the measured values of rs obtained from the original data. Biomass was assumed to have the generalized empirical formula CH1.8O0.5N0.2. The fate of ammonium ions not incorporated into biomass could be altered by changing the yield of hypothetical product from nitrogen and carbon sources. The values for yield coefficients were as follows: 65% for biomass from glucose (12), 500% for biomass from ammonium ions (theoretical molar yield), and 100% for a simple hypothetical compound containing glucose and ammonium ions in equal molar amounts. The calculated glucose uptake was plotted alongside the experimental values in Fig. 6. The close correlation between calculated and experimental profiles indicates that ammonium ions combine with a carbon-containing metabolite inside the cell. It also shows that the most likely ratio for this combination is equivalent to 1 mole of glucose per mole of ammonia.
FIG. 6.
Comparison of calculated and experimental cumulative uptake of glucose during fermentation.
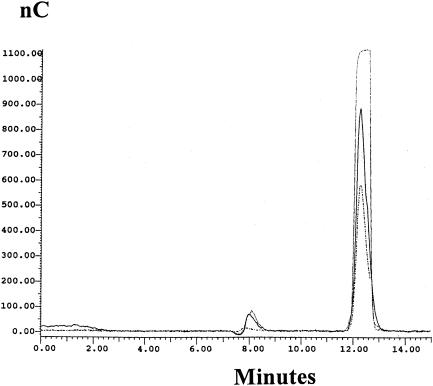
Following modeling work which showed that glucose and ammonium uptake are stoichiometrically linked with a ratio of 1:1, glucosamine was identified as a potential nitrogen storage compound. As a component of cell walls, glucosamine is polymerized and removed from the cell. Shorter polymer chains are also produced to form a protective and adhesive “bioslime” layer outside the cell wall. The presence of loosely attached compounds has been noted in the literature (7). In order to identify glucosamine, HPLC analysis was set up as described in Materials and Methods. Broth samples were taken in 24-h intervals from fermentations with 50- and 150-g/liter initial glucose concentrations (all other medium constituents' concentrations remained unchanged). The results of HPLC analysis were very satisfactory, as glucosamine was identified in broth samples. Figure 7 shows the chromatogram of analysis for standards (glucosamine, 15 mM; glucose, 13.5 mM) and broth samples (24-h culture, 50-g/liter initial glucose concentration, 1:10 dilution, and 48-h culture; 150-g/liter initial glucose concentration, 1:100 dilution). In Fig. 7, the peaks obtained at about 8 min retention time correspond to glucosamine while those at 12.5 min correspond to glucose.
FIG. 7.
HPLC chromatogram for broth samples. The solid line represents the standard solutions used: glucosamine at 15 mM and glucose at 13.5 mM. The short-dashed line represents a broth sample (1:10 dilution) taken at 24 h of fermentation (50 g/liter initial glucose concentration). The long-dashed line represents a broth sample (1:100 dilution) taken at 48 h of fermentation (150 g/liter initial glucose concentration). The peaks obtained at about 8 min retention time correspond to glucosamine, while those at 12.5 min correspond to glucose.
Formation and release of glucosamine during fermentation.
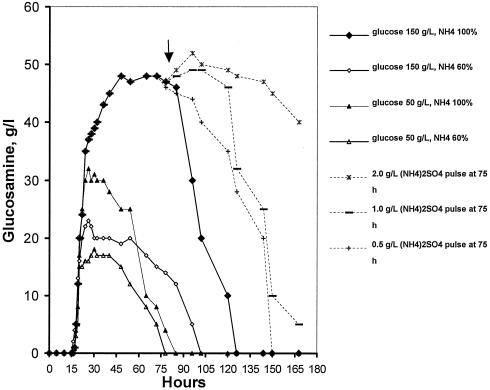
To investigate the conditions of formation and release of glucosamine into the broth, fermentations were carried out with initial glucose concentrations of 150 and 50 g/liter, performed with the optimal concentration of ammonium ions [2.5 g/liter (NH4)2SO4] and a 60% fraction of the optimal concentration. According to Fig. 8, no glucosamine was detected until about 16 h following inoculation. The maximum concentration of 48 g/liter was detected when both glucose and NH4+ concentrations were optimal (150 g/liter and 100%, respectively). This was noticed at 48 h of fermentation and remained almost stable up to 85 h until it dropped sharply afterwards to level zero at about 126 h. With suboptimal concentrations of glucose and ammonium ions, glucosamine formation commenced at the same time, while its maximum concentration in the broth was detected earlier and in lower levels compared to the standard medium conditions. Results of the same trend were obtained in all cases, as glucosamine concentration in the fermentation broth remained rather unchanged for a period following the maximum concentration point. In fermentations carried out with the 50-g/liter initial glucose concentration, glucosamine levels remained almost stable in the period between 22 h and 48 h of fermentation. When ammonium was supplied in the optimal concentration, no glucosamine was detected beyond 72 h, while with 60% of optimal ammonium ion concentration, no glucosamine was detected beyond 65 h of fermentation. In these two runs, glucose was depleted by around 70 h of fermentation. It appears from Fig. 8 that glucosamine, a nitrogen storage compound, is synthesized early in fermentation in amounts dependent on the initial concentrations of glucose and ammonium, to be utilized by the fungus in later stages. In a typical citric acid fermentation (standard medium conditions), glucosamine is fully degraded by the fungus in the period between 85 and 126 h.
FIG. 8.
Time courses of glucosamine concentrations in fermentation broth. Fermentations carried out with optimal and suboptimal initial concentrations of glucose and ammonium ions and with ammonium added as a single pulse.
Fed-batch cultures.
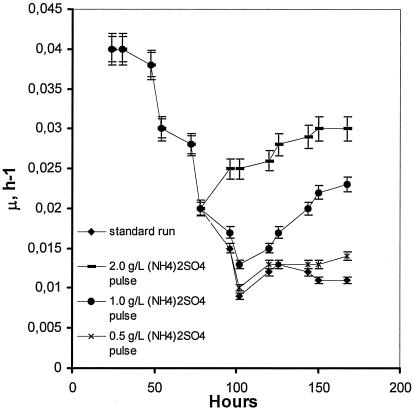
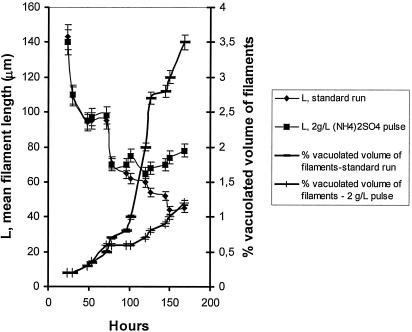
Three runs were carried out in which 2.0, 1.0, and 0.50 g/liter (NH4)2SO4 were added at 75 h of fermentation. Immediately after addition, production of citric acid was much reduced, the effect being more pronounced with the addition of 2.0 g/liter (NH4)2SO4 (Fig. 1), which almost inhibited citrate synthesis until around 120 h. From that time and for the rest of fermentation, citric acid production rates appeared enhanced, as Fig. 1 shows, and final concentration reached 90 g/liter. The microorganism's very rapid response to the addition of a supplementary nitrogen source is mirrored in the specific growth rate time courses (Fig. 9). Immediately after the addition, specific growth rates increased sharply in the case of 2.0 g/liter (NH4)2SO4 while lower levels of (NH4)2SO4 had a more moderate effect. Mean filament lengths, as shown in Fig. 10 for the standard run and the 2.0-g/liter (NH4)2SO4 pulse run, increased following (NH4)2SO4 addition, while vacuolation levels were significantly reduced. Obviously, (NH4)2SO4 addition enhanced the formation of new cells from the tips of fragmented hyphae. (NH4)2SO4 addition at 75 h led to glucosamine accumulation, as shown in Fig. 8, in amounts depending on the (NH4)2SO4 concentration of the pulse. Following ammonium addition, glucosamine concentration in the broth remained at high and stable levels until 120 h, after which it degraded sharply. These results indicate that the newly formed mycelium utilizes glucosamine.
FIG. 9.
Time courses of the specific growth rate of Aspergillus niger in standard run and in fermentations in which a single ammonium pulse was added.
FIG. 10.
The morphological profile of Aspergillus niger mycelium in the standard run and with the addition of a 2-g/liter ammonium sulfate pulse. Time courses of mean filament length and percentage of vacuolated filament volume are shown.
Fungal morphology.
A. niger grew in the form of clumps. It is the characteristic morphology of the particular strain under citric acid-producing conditions (12, 14). Morphological measurements were done by means of image analysis, and the time courses of morphology parameters, like mean perimeters of clumps and mean lengths of filaments, were obtained. Mean perimeters of mycelial clumps ranged between 800 μm and 500 μm and declined steadily during the first half of fermentation while appearing almost stable during the second half (results not shown). Mean lengths of filament (L, μm) measurements are presented in Fig. 10. According to Fig. 10, a decline in mean filament length occurs at the same time when specific growth rate increases. The volumes of vacuolated filaments were also recorded throughout fermentation, and the percentage of the total vacuolated volume of the mycelium was calculated and presented in Fig. 10. Also, 3.5% of the total volume of the mycelium appears to be vacuolated at the end of the process in the standard run, while the 2-g/liter pulse of ammonium sulfate kept vacuolation at the very low levels of approximately 1.2%. The effect of the 2-g/liter pulse of ammonium sulfate on the mean length of filaments is shown in Fig. 10. Along with lower vacuolation levels, an increase in mean filament length immediately after ammonium addition was recorded, a situation reflected in the specific growth rate measurements of Fig. 9.
DISCUSSION
A successful citric acid fermentation with A. niger, apart from the suitable production medium, requires intensive mixing and aeration conditions. At 600 rpm applied in the present case and an aeration rate of 1 vvm, after a lag period of some 40 to 50 h, citric acid formation commenced (Fig. 1). The onset of citrate accumulation in the broth was associated with a greatly increased glucose consumption rate (Fig. 6). At the end of the process, carried out with an initial glucose concentration of 150 g/liter, citric acid reached the high concentration of 110 g/liter while biomass did not exceed 7.3 g/liter. Therefore, the present system represents a successful citric acid-producing system.
It is well known that nitrogen in the medium must be limiting in order to attain increased citric acid yields (5). However, the process of ammonium ion uptake in A. niger has never been closely studied, despite the importance of these ions to the industrial production of citric acid using this fungus. Our study focused on the early fermentation stages and attempted an investigation on the fate and role of these ions and the overall dynamics of the system under production conditions. Results presented in Fig. 1 and 2 show that, by applying the optimum initial ammonium ion concentration in the medium, this has to be depleted before citric acid production establishes. The bulk of ammonium is removed from the broth between 20 and 25 h, and it is almost depleted by 36 h. At that time, biomass is still less than 2 g/liter. Using a range of different concentrations of ammonium ions in the medium, we investigated the relationship between concentration and rate of uptake. It appeared that the two are related and the relationship between the initial ammonium ion concentration and the bulk uptake (20 to 25 h) is linear (Fig. 3).
The uptake of ammonium ions is followed by a release of protons. The protons released from the mycelium appear to be directly related to the initial ammonium ion concentration in fermentations carried out with up to and including 60% of the optimal number of ammonium ions (Fig. 4). The relationship appears to break down at higher initial concentrations, but this is because the ammonium ions were not totally removed from the broth in the 80 and 100% fermentations until about 40 h. Figure 5 does not show this extra time, as it is at approximately this time that acid production starts in fermentations with a lower initial concentration of ammonium ions, confusing the overall picture. Detailed time studies on the relationship between ammonium ion uptake and proton release carried out by Wayman (20) showed that the two are linked but only indirectly. The release of protons into the broth does not coincide precisely with the uptake rate of ammonium ions but lags by a couple of hours. This delay precludes a proton/ammonium antiport as the means of ammonium ion uptake. Coincidently, peaks in the rate of ammonium uptake follow peaks in the growth rate by about 4 h. It would seem that a chain of events where growth leads to ammonium uptake leads to proton release is established in this early phase. However, one phenomenon that does coincide precisely with ammonium uptake is glucose uptake, which is at such a high level that it must be protein mediated (Fig. 6).
If the ammonia were stored inside the biomass at the bulk uptake period (20 to 25 h), just under 40% of the biomass would be pure ammonia. Measurements of the pH inside the mycelium (unpublished data) (10) show that the internal pH is slightly acidic under these conditions and so cannot contain this amount of pure ammonia, which would also be highly toxic. This was confirmed by direct measurement of the internal concentration, which showed that the internal concentration of ammonium ions was below detectable levels (less than 1 mM/g dry weight) at 25 h. Other published work indicates that the level of ammonium ions later in the fermentation is in the range of 10 to 30 mM/g dry weight (8). Dry weight and ammonia measurements in fermentations performed with complete medium show that the uptake of ammonia equivalents from the broth is very similar to the increase in biomass in the 20- to 25-h period of fermentation (Fig. 5). As the increase in biomass cannot be due to the accumulation of ammonia inside the biomass, a nitrogen compound must be produced and excreted by the mycelium. Urea is a simple molecule with a high carbon-to-nitrogen ratio, and it is the only compound that could be used to store nitrogen within the biomass without greatly increasing its mass. It is produced during the deamination of amino acids by the ornithine cycle. Although no reports have been found to indicate that A. niger possesses the ability to make urea, fermentations carried out with full medium and ammonium ion concentration were measured in the presence and absence of jack-bean urease. The measurements of ammonium ions did not vary with the treatment of the samples with urease, and this demonstrates that urea is not used by A. niger as a nitrogen storage compound.
Calculating the material balances for biomass, glucose, and ammonium ions throughout the first 30 h of fermentation, we constructed a simple stoichiometric model. Using equations 1, 2, and 3 as described in Results, the calculated values were compared with the measured values obtained from experimental data. To investigate the formation of the hypothetical product from nitrogen and carbon sources, it was decided that the fate of ammonium ions, not incorporated into biomass, could be altered by changing the yield of that product. The value for the yield coefficient for a simple hypothetical compound containing glucose and ammonium ions in equal molar amounts was 100%. Figure 6 shows the plot of the calculated and experimental glucose uptake rates, which appear in close correlation. Obviously, the results of the model indicate that ammonium ions combine with a carbon-containing metabolite inside the cell and that the most likely ratio of this combination is equivalent to 1 mol of glucose to one more mol of ammonia.
The observed close correlation between the calculated and experimental profiles of the glucose uptake rate indicates also that the metabolic process combining the carbon and nitrogen sources must be rapid and therefore must take place before the carbon structure of the glucose has been greatly altered by glycolysis or the pentose phosphate pathway. There are no reports in the literature on any kind of product of the described relationship between glucose and ammonium. Weight analysis indicates that the product almost certainly is not being stored inside the cell and must be exported, possibly as an extracellular aminated polysaccharide. Following the modeling work, which showed that glucose and ammonium are stoichiometrically linked with a ratio of 1:1, glucosamine was identified as a potential nitrogen storage compound. Following synthesis inside the cell, this must be removed from the cell. There are no reports in the literature on the presence of glucosamine in citric acid fermentation broths, but there is work that reported the presence of loosely attached compounds (7). HPLC analysis was set up in order to identify glucosamine, and it proved to be very satisfactory, as the compound was indeed identified to be glucosamine. The peaks appearing at about 8 min retention time corresponded to glucosamine, while those obtained at 12.5 min retention time were the glucose peaks (Fig. 7).
Following detection of the aminated compound, the formation, release, and fate of glucosamine throughout fermentation were investigated in fermentations carried out with 150- and 50-g/liter initial concentrations of glucose and with the optimal concentration of ammonium ions [production medium, 2.5 g/liter (NH4)2SO4] and 60% of the optimum concentration. The highest detected concentration of glucosamine was obtained when both glucose and ammonium ions were supplied at concentrations regarded as optimal for a citric acid production medium: 150 g/liter glucose and 2.5 g/liter (NH4)2SO4. This was estimated to be 48 g/liter and noticed in samples taken at 48 h (Fig. 8). From that point until 85 h, glucosamine appeared quite stable in the broth but it reduced to zero levels at about 126 h of fermentation. When the concentrations of glucose and ammonium were suboptimal, glucosamine formation was detected at the same time; however, maximum concentrations obtained earlier compared with the standard run and these were significantly lower. Figure 8 presents the time courses of glucosamine concentrations (g/liter) in the broths of all the combinations between glucose and ammonium in the fermentation medium. The conclusion drawn from these experiments is that glucosamine is synthesized early in fermentation in amounts which depend on the availability of glucose and ammonium in the medium. These amounts can be remarkably high, such as 48 g/liter, and they can be detected in the broth for a period of approximately 40 h (between 48 and 85 h in fermentation). Afterwards, glucosamine concentrations sharply decrease to no detectable levels beyond 126 h.
We showed in a number of previously published reports (12, 13, 14, 15) that fungal morphology cannot be neglected in studies dealing with the biochemistry of a system. Instead, it is related to fermentation rates and it affects overall productivities directly or indirectly, through mass transfer phenomena and perhaps other processes yet not fully understood. From the morphology point of view, a fungal fermentation represents a dynamic system with an ever-changing behavior. Detailed morphological studies of this particular system, using the standard medium with a 150-g/liter initial glucose concentration, as published earlier (12, 13), revealed that in a range of stirrer speeds between 400 and 600 rpm, the mycelium forms microscopic clumps, the mean perimeter of which reduces with increasing stirrer speeds, with the mean filament length following the same trend. It has also been observed and described in detail (15) that under intensive agitation conditions, as in the present case, the mycelium undergoes a cycle of fragmentation and regrowth at later stages. Mycelial fragmentation results from increased vacuolation, a natural process that weakens the filaments and predisposes them to damage and fragmentation due to mechanical stress. A combination of observations that take place in the period between 72 and 126 h, e.g., a drop of the mean diameter of vacuoles and a significant drop in the percentage of vacuolated volume of filaments, and a reduction of the mean filament length along with an increase in the specific growth rate of the organism suggests that new mycelium is formed from the new tips resulting from fragmentation (15). The degradation of glucosamine in the period between 85 and 126 h strongly indicates that the mycelium utilizes it in building the cell walls of the newly formed hyphae. Specific growth rate values, mean filament lengths, and the vacuolation profile, as presented in Fig. 9 and 10, show the state of the mycelium and the time courses of a series of changes, the most important of which take place at the same period when glucosamine depletion was observed.
The natural process of vacuolation, and subsequent fragmentation, is induced by low glucose levels, as experiments in batch and fed-batch cultures have shown (14, 15). This can explain the earlier degradation of glucosamine as it appears in runs starting with 50 g/liter glucose (Fig. 8). However, a clear effect of the concentration of ammonium ions on the time course of glucosamine concentrations during fermentation can be observed in Fig. 8, comparing the plots obtained from fermentations carried out with optimal and suboptimal concentrations of ammonium ions. It appears so far that the fungus reacts in excess ammonium by converting it to glucosamine, a compound that will be utilized later in a regeneration process depending always on the culture conditions. Citrate accumulation commences with the exhaustion of nitrogen in the liquid medium, and it is widely accepted that nitrogen limitation is a prerequisite for a successful citric acid process. However, a very limited number of reports (2, 22) indicate that yields of citric acid in batch culture may be increased by the addition of nitrogen after the mycelial growth stage. Yigitoglou and McNeil (22) reported as optimum addition time for nitrogen supplementation the range between 40 and 75 h: by supplementing the culture with 0.5 g/liter (NH4)2SO4, fermentation productivity increased, along with an increase in the maximum biomass concentration. These works did not include any morphological observations in the course of batch fermentation; however, the timing suggested for nitrogen supplementation is noteworthy, since the fermentation was carried out in a 12-liter stirred tank reactor at 400 rpm with an initial sucrose concentration of 140 g/liter, conditions which strongly indicate that a process of mycelial fragmentation and regrowth took place. It would be interesting therefore to investigate the result and the final outcome of a single ammonium sulfate pulse upon glucosamine formation and the overall progress of a batch citric acid fermentation.
Three runs were performed (standard medium) in which ammonium sulfate was added as a single pulse at 75 h at concentrations of 2.0, 1.0, and 0.50 g/liter. Immediately after addition, Aspergillus response was rapid: specific growth rates enhanced, while the synthesis of citrate was affected. The most pronounced effects were noted with the 2-g/liter pulse, where citrate synthesis was inhibited until around 120 h. From that time and for the rest of the run, production rates appeared enhanced, as Fig. 1 shows, and final concentration reached 90 g/liter. The effect was more moderate with the addition of lower ammonium sulfate concentrations. Mean filament lengths increased following the 2-g/liter pulse, and the vacuolation levels were reduced significantly (Fig. 10). Obviously, ammonium sulfate addition resulted in growth enhancement with the formation of new cells from the tips of fragmented hyphae. Figure 8 shows the pulse results on glucosamine accumulation and release. Glucosamine was accumulated in amounts depending on the (NH4)2SO4 of the pulse, the highest concentration achieved being almost 53 g/liter in the case of the 2-g/liter pulse. This was detected at 102 h and remained at high levels until 120 h, to degrade sharply afterwards. The pulse experiments show that glucosamine can be synthesized and released to the broth when nitrogen is supplied in excess.
Investigating the fate and role of ammonium ions in the early phase of the citric acid fermentation process, we come to the conclusion that ammonium ions are not simply deposited inside the cell to make an ammonium pool but that they enter the cell to combine with glucose and form glucosamine, which is immediately released in the fermentation broth. Concerning the biochemistry of citric acid accumulation by A. niger, the situation described by Habison et al. (4) and Röhr and Kubicek (17) is generally accepted and no report has appeared so far to put it in question. According to them, a high intracellular ammonium concentration, resulting from protein breakdown in manganese-deficient media, causes inhibition of the phosphofructokinase enzyme and leads to a flux through glycolysis and the formation of citric acid. The slightly acidic intracellular pH, the very low internal concentration of ammonium ions (about 1% of the external concentration), and the synthesis and release of glucosamine described in the present case show that the inhibition of phosphofructokinase is certainly not due to increased concentrations of ammonium ions, and to this point, the enzymatic profile may need to be realigned. The existing relationship between high glucose and ammonium ion concentrations from one side and the enzymes of phosphofructokinase, 2-oxoglutarate dehydrogenase, and the synthase of glucosamine from the other side within the citric acid cycle certainly needs further investigation.
Following the fate of ammonium ions in the citric acid fermentation, we identified glucosamine, a compound not previously reported as a by-product of the citric acid fermentation. Glucosamine synthesis and release into the broth can take place not only in the early phase, when nitrogen is supplied with all other medium constituents, but also later, given the availability of glucose, by addition of the suitable nitrogen form. It acts as a storage compound, and it is utilized by the fungus during the course of fermentation. Glucosamine, a nutraceutical and dietary supplement, is currently produced by the acid hydrolysis of chitin, a process limited by poor yields and the availability of raw materials, for example, crab shells. Suitable process manipulations of the system described in this work could lead to successful glucosamine recovery at the point of its highest yield before degradation of the fungus occurs.
REFERENCES
- 1.Arts, E., C. Kubicek, and M. Röhr. 1987. Regulation of phosphofructokinase from Aspergillus niger: effect of fructose-2,6-bisphosphate on the action of citrate, ammonium ions and AMP. J. Gen. Microbiol. 133:1195-1199. [Google Scholar]
- 2.Choe, J., and Y. J. Yoo. 1991. Effect of ammonium ion concentration and application to fed-batch culture for over-production of citric acid. J. Ferm. Bioeng. 72:106-109. [Google Scholar]
- 3.Habison, A., C. P. Kubicek, and M. Röhr. 1979. Phosphofructokinase as a regulatory enzyme in citric acid accumulating Aspergillus niger. FEMS Microbiol. Lett. 5:39-42. [Google Scholar]
- 4.Habison, A., C. P. Kubicek, and M. Röhr. 1983. Partial purification and regulatory properties of phosphofructokinase from Aspergillus niger. Biochem. J. 209:669-676. [DOI] [PMC free article] [PubMed] [Google Scholar]
- 5.Kristiansen, B., and C. G. Sinclair. 1978. Production of citric acid in batch culture. Biotechnol. Bioeng. 20:1711-1722. [Google Scholar]
- 6.Kristiansen, B., and C. G. Sinclair. 1979. Production of citric acid in continuous culture. Biotechnol. Bioeng. 21:297-315. [Google Scholar]
- 7.Kubicek, C. P., and M. Röhr. 1977. Influence of manganese on enzyme synthesis and citric acid accumulation by Aspergillus niger. Eur. J. Appl. Microbiol. 4:167-175. [Google Scholar]
- 8.Kubicek, C. P., O. Zehentgruber, and M. Röhr. 1979. An indirect method for studying the fine control of citric acid accumulation by Aspergillus niger. Biotechnol. Lett. 1:47-52. [Google Scholar]
- 9.Kunst, A., B. Draeger, and J. Ziegenhom. 1986. Colorimetric methods with glucose oxidase. Methods Enzymatic Ana. 6:178-185. [Google Scholar]
- 10.Legisa, M., and J. Kidric. 1989. Initiation of citric acid accumulation in the early stages of Aspergillus niger growth. Appl. Microbiol. Biotechnol. 31:453-477. [Google Scholar]
- 11.Marier, J. R., and M. Boulet. 1956. Direct determination of citric acid in milk by an improved pyridine acetic anhydrite method. J. Dairy Sci. 41:1683-1692. [Google Scholar]
- 12.Papagianni, M. 1995. Morphology and citric acid production of Aspergillus niger in submerged culture. Ph.D. thesis. University of Strathclyde, Glasgow, United Kingdom.
- 13.Papagianni, M., M. Mattey, and B. Kristiansen. 1994. Morphology and citric acid production of Aspergillus niger PM1. Biotechnol. Lett. 16:929-934. [Google Scholar]
- 14.Papagianni, M., M. Mattey, and B. Kristiansen. 1999. The influence of glucose concentration on citric acid production and morphology of Aspergillus niger in batch and fed-batch culture. Enzyme Microb. Technol. 25:710-717. [Google Scholar]
- 15.Papagianni, M., M. Mattey, and B. Kristiansen. 1999. Hyphal vacuolation and fragmentation in batch and fed-batch culture of Aspergillus niger and its relation to citric acid production. Process Biochem. 35:359-366. [Google Scholar]
- 16.Punekar, N. S., C. S. Vaidyanathan, and N. A. Rao. 1984. Mechanisms of citric acid fermentation by Aspergillus niger. J. Sci. Ind. Res. 43:269-287. [Google Scholar]
- 17.Röhr, M., and C. P. Kubicek. 1981. Regulatory aspects of citric acid fermentation by Aspergillus niger. Process Biochem. 16:34-37. [Google Scholar]
- 18.Shu, P., and M. J. Johnson. 1948. Citric acid production by submerged fermentation with Aspergillus niger. Ind. Eng. Chem. 40:1202-1205. [Google Scholar]
- 19.Sinclair, C. G., B. Kristiansen, and J. D. Bu'lock. 1991. Fermentation kinetics and modeling. The biotechnology series. John Wiley and Sons Ltd., Hoboken, N.J.
- 20.Wayman, F. 2001. Analysis and computer-based modelling of citric acid production by Aspergillus niger. Ph.D. thesis. University of Strathclyde, Glasgow, United Kingdom.
- 21.Wolschek, M. F., and C. P. Kubicek. 1999. Biochemistry of citric acid accumulation by Aspergillus niger, p. 11-33. In B. Kristiansen, M. Mattey, and J. Linden (ed.), Citric acid biotechnology. Taylor and Francis, London, United Kingdom.
- 22.Yigitoglu, M., and B. McNeil. 1992. Ammonium and citric acid supplementation in batch cultures of Aspergillus niger B60. Biotechnol. Lett. 14:831-836. [Google Scholar]


