

Abstract
Nuclear spin relaxation is a powerful method for studying molecular dynamics at atomic resolution. Recent methods development in biomolecular NMR spectroscopy has enabled detailed investigations of molecular dynamics that are critical for biological function, with prominent examples addressing allostery, enzyme catalysis, and protein folding. Dynamic processes with similar correlation times are often detected in multiple locations of the molecule, raising the question of whether the underlying motions are correlated (corresponding to concerted fluctuations involving many atoms distributed across extended regions of the molecule) or uncorrelated (corresponding to independent fluctuations involving few atoms in localized regions). Here, we have used 13Cα(i - 1)/13Cα(i) differential multiple-quantum spin relaxation to provide direct evidence for correlated dynamics of consecutive amino acid residues in the protein sequence. By monitoring overlapping pairs of residues (i - 1 and i, i and i + 1, etc.), we identified correlated motions that extend through continuous segments of the sequence. We detected significant correlated conformational transitions in the native state of the E140Q mutant of the calmodulin C-terminal domain. Previous work has shown that this domain exchanges between two major conformational states that resemble the functionally relevant open and closed states of the WT protein, with a mean correlation time of ≈20 μs. The present results reveal that an entire α-helix undergoes partial unraveling in a transient and cooperative manner.
Keywords: conformational exchange, NMR, nuclear spin relaxation
Protein dynamics are critical for biological function. Ligand binding, folding, and enzyme catalysis involve conformational dynamics covering a wide range of time scales and motional amplitudes (1–10). NMR spectroscopy is uniquely suited to study dynamic processes in biomolecules with atomic resolution, on time scales ranging from picoseconds to seconds. Chemical or conformational exchange processes that modify the local magnetic environments of nuclear spins on microsecond to millisecond time scales increase the relaxation rates of transverse magnetization (R2), because they introduce a stochastic time dependence of the resonance frequencies. Relaxation dispersion experiments have been developed that quantify conformational exchange contributions to R2 as a function of the strength of the applied radio-frequency fields, implemented either as CPMG (Carr–Purcell–Meiboom–Gill) pulse trains or continuous-wave spin-locks (8–10). In principle, NMR spectroscopy offers the possibility to monitor conformational exchange processes at every position along the protein backbone and side chains, provided that suitable stable isotopes (e.g., 13C and 15N) have been incorporated (4, 11–15). Importantly, the chemical shifts of different nuclei are sensitive to different types of intramolecular motions, which provides a major motivation for pursuing multinuclear studies of conformational exchange (14–21). Recent methods development has made possible measurement of differential multiple-quantum (MQ) relaxation rates that report on correlated dynamics of different spin interactions (22–24). MQ relaxation rates can provide important structural information, because they depend on the angles relating the principal axis frames of the rank-two interaction tensors involved in the relevant relaxation mechanisms, which include the dipolar interaction and chemical shift anisotropy (25–30). Another potentially important source of MQ relaxation is the correlated modulation of the (rank-zero) isotropic chemical shifts of multiple nuclei (19, 21, 31–35). Neither of these properties may be probed by using conventional single-quantum (SQ) relaxation experiments. The possibility to monitor the extent of cross-correlation between the motions of separate sites in a protein offers an important test of whether the detected dynamic modes are localized or extend across contiguous regions of the structure. Correlated conformational exchange of neighboring 13Cα spin pairs is expected to be particularly powerful for addressing secondary structure fluctuations, because the 13Cα chemical shift depends mainly on the local backbone φ–Ψ dihedral angles (36–38). Furthermore, the MQ relaxation rates are relatively sensitive to conformational exchange in the case of 13Cα, because the major dipolar interactions can be greatly reduced in perdeuterated samples, and the chemical shielding anisotropy (CSA) is small.
Here, we have measured the differential MQ relaxation rates involving 13Cα spins in adjacent residues of E140Q-Tr2C [the E140Q mutant of the C-terminal domain of calmodulin (Tr2C)]. We have previously demonstrated that the calcium-loaded form of E140Q-Tr2C exchanges between two major conformations that resemble the calcium-loaded (open) and calcium-free (closed) states of WT Tr2C (11, 39, 40). Based on SQ 15N, 1H, and 13Cα rotating-frame relaxation (R1ρ) measurements, the average exchange correlation times at 28°C are 〈τex〉 = 22 ± 7, 19 ± 7, and 25 ± 8 μs, respectively, and the populations of the exchanging states are approximately equal (11, 14, 15). These properties make E140Q-Tr2C a good model system for studying fast conformational exchange in general and the dynamics of the conformational switch in calmodulin in particular. We recently reported a MQ relaxation study that monitored the correlated conformational exchange involving the 1H and 15N spins of each backbone amide group (19), which confirmed the previous 15N relaxation results. However, both the temperature dependence and site-to-site variation of the residue-specific exchange correlation times, determined by using SQ 15N, 1H, and 13Cα R1ρ measurements, suggest that the conformational exchange may be more complex than a simple two-state process (11, 14, 15, 40). In an effort to address this question, we developed a MQ relaxation experiment that detects correlated conformational exchange of 13Cα nuclei situated in adjacent residues; a virtually identical experiment has been presented recently (41). We measured the difference in zero-quantum (ZQ) and double-quantum (DQ) relaxation rates of coherences involving the 13Cα spins of residues i - 1 and i. The results provide strong evidence for transient and cooperative unfolding of an entire α-helix, suggesting that the global exchange process involves a partially unstructured minor state that had previously escaped detection. The present report demonstrates the power of studying conformational exchange by using multiple spin probes that exhibit different sensitivity toward various types of molecular motions.
Materials and Methods
Theory. The spin states 2IxSx and 2IySy correspond to the sum and difference of ZQ and DQ coherences, namely, 2IxSx = (I+S- + I-S+ + I+S+ + I-S-)/2 and 2IySy = (I+S- + I-S+ - I+S+ - I-S-)/2. Because the relaxation rates are different for the ZQ and DQ coherences (23, 24, 41), a spin state initially prepared as 2IxSx will evolve into a superposition of 2IxSx and 2IySy. It is convenient to describe the coupled relaxation of the Cartesian bilinear operators by using an average MQ relaxation rate RMQ = (RDQ + RZQ)/2 and a differential MQ relaxation rate ΔRMQ = (RDQ - RZQ), the latter of which interconverts 2IxSx and 2IySy and thus acts as an apparent cross-relaxation rate
 |
[1] |
where the angle brackets denote the expectation value of the operator in question. The spin states 2IxSx and 2IySy are detected in separate “auto”- and “cross”-experiments, respectively, and the differential relaxation rate ΔRMQ is obtained from the ratio of intensities in these experiments (33),
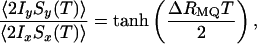 |
[2] |
where T is the relaxation delay.
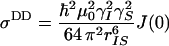
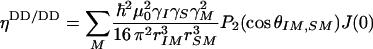
Cross-correlations exist between two interactions of the same rank. Thus, cross-correlation occurs between any pair of two different rank-two spin interactions: dipolar–dipolar (DD/DD), CSA–CSA (CSA/CSA), or dipolar–CSA (DD/CSA). The third major relaxation mechanism for spin-1/2 nuclei in proteins is modulation of the rank-zero isotropic chemical shift, usually denoted as conformational (or chemical) exchange. Hence, cross-correlation may exist between chemical shift modulations (CSMs) involving different nuclei (CSM/CSM) as well. The differential MQ relaxation rate is, in general, a sum of several cross-correlated relaxation mechanisms, as described in refs. 24 and 34. In the present application, ΔRMQ involves autocorrelated dipolar cross-relaxation (σDD), dipolar cross-correlation with an external spin M (ηDD/DD), cross-correlation of the chemical shift anisotropies (ηCSA/CSA), and correlated modulation of the chemical shifts (ηCSM/CSM):
 |
[3] |
Neglecting high-frequency components of the spectral density functions, these relaxation rates are approximately given by
 |
[4a] |
 |
[4b] |
 |
[4c] |
 |
[4d] |
where  is Planck's constant divided by 2π, μ0 is the permittivity of free space, γi is the gyromagnetic ratio of spin i, rij is the distance between spins i and j, J(0) is the spectral density sampled at zero frequency, P2(cosθi,j) is the second-order Legendre polynomial, θi,j is the angle between the principal axes of tensors i and j, Δσi is the chemical shift anisotropy of spin i, pA = (1 - pB) is the population of state A, Δωi is the chemical shift difference between states A and B for spin i, τex = 1/kex is the exchange correlation time, and kex is the exchange rate. Eq. 4d is valid for two-state exchange in the fast regime, kex >> (Δω2I + Δω2S)1/2 (42).
It is desirable not to obscure conformational exchange effects by large offset terms due to dipolar interactions. Perdeuteration of aliphatic protons efficiently reduces dipolar relaxation, which also has the advantage of increasing sensitivity. A further advantage is that cross-correlation of two dipolar couplings involving remote spins (denoted M and N), which leads to cross-relaxation with the doubly antiphase terms (8IyMzSyNz and 8IxMzSxNz), is greatly attenuated so that the decays for the DQ and ZQ coherences are essentially monoexponential (34). In the absence of correlated conformational exchange, the dominant contributions to differential MQ relaxation rates result from cross-correlations of DD/DD interactions involving external spins (Eq. 4b) or of CSA/CSA interactions involving the two 13Cα spins (Eq. 4c), whereas cross-relaxation between 13Cα spins is completely negligible due to their large distance separation (Eq. 4a). Because we performed the present set of experiments on a perdeuterated protein, the contribution from DD/DD cross-correlation between the 13Cα spins and their covalently attached 1Hα spins is small. Instead, Eq. 4b is dominated by interactions with remote spins M. We estimated this contribution to 0 ± 0.2 s-1, based on the structures of closed and (Ca2+)2 forms of WT Tr2C (43) and a rotational correlation time of 4.2 ns (40). The maximum CSA/CSA contribution was estimated to 0.035 and 0.51 s-1 for α-helices and β-strands, respectively, as calculated for a static magnetic field of 11.7 T and Δσ values of 6.1 (α-helices) and 27.1 (β-strands) ppm (44). Because E140Q-Tr2C is composed mainly of α-helices (39, 43), the CSA/CSA contribution is thus expected to be minor, except for the short β-sheet joining the two calcium-binding loops and for residues in the loop and linker regions between the four helices. Calculations indicate that the uncertainties in the fitted parameters increase from 4% to 60% as ΔRMQ decreases from 8 s-1 to 0.5 s-1, assuming a constant absolute error in intensity (corresponding to 1% relative error at T = 0) and RMQ = 30 s-1. Thus, small values of ΔRMQ must be interpreted with caution.
NMR Spectroscopy. Highly deuterated and uniformly 13C/15N-labeled E140Q-Tr2C was obtained by overexpression in Escherichia coli MM294 by using 13C-glucose and 15NH4Cl as the sole carbon and nitrogen sources and 97% D2O in the culture medium. Under these conditions, the level of 2H labeling was ≈85% on average, as determined by mass spectrometry. In the case of Hα, 2H incorporation was >95%, as determined by NMR and expected from the transamination pathways of E. coli metabolism (45). The NMR sample contained 2 mM E140Q-Tr2C at pH 6.0, 40 mM Ca2+, 0.2 mM NaN3, and 0.1 mM 2,2-dimethyl-2-silapentane-5-sulfonic acid dissolved in 10% D2O and 90% H2O. The pulse sequence used here (see Fig. 5, which is published as supporting information on the PNAS web site) closely resembles a recently published experiment by Majumdar and Ghose (41). Our implementation includes coherence selection by a conventional DQ filter applied immediately before the relaxation delay, rather than spin-order selection, and an extended phase cycle to minimize artifacts. Differential MQ relaxation rates were quantified by measuring the decay of 4Ni,zCi,xCi-1,x spin states and the buildup of 4Ni,zCi,yCi-1,y in an interleaved fashion. These spin states have relaxation properties that are very similar to 2CxCx and 2CyCy (29, 34). The relaxation delays were 0, 7, 14 (×2), 21, 28, 35, 42 and 56 (×2) ms.
The sensitivity of the experiment was optimized by refocusing the 13Cα–13Cβ scalar coupling during the relaxation delay, which can be achieved by adjusting the relaxation delays to multiples of 1/JCC and applying a nonselective refocusing pulse that inverts all 13Cα and 13Cβ spins. Alternatively, the scalar coupling can be refocused by using a selective 180° pulse on the 13Cα spins, which allows for arbitrary relaxation delays but suffers from the drawback that the refocusing pulse cannot be optimized simultaneously for all types of residues. Here, we used a 1.665-ms RE-BURP (refocusing band-selective, uniform response, purephase) pulse (46) centered at 58.3 ppm and covering 49.5–67.2 ppm, which implies that the 13Cα spins of Gly are not refocused and that the 13Cα–13Cβ scalar coupling in Ser and Thr is not refocused (at a static magnetic field of 11.7 T). Thus, MQ coherences involving glycine residues are excluded from further analysis, and those involving Ser and Thr can be evaluated only at relaxation delays that are multiples of 1/JCC (28 ms).
Amide proton exchange with solvent was measured by using the WEX-FHSQC (water exchange–fast heteronuclear single quantum correlation) experiment (47) on a sample containing 1.5 mM 15N-labeled E140Q-Tr2C at pH 6.0, 30 mM Ca2+, 0.2 mM NaN3, and 0.1 mM 2,2-dimethyl-2-silapentane-5-sulfonic acid dissolved in 10% D2O and 90% H2O. The delays were tmix = 0, 5, 10, 15, 20 (×2), 25, 40 (×2), 50, 60, 80, and 120 ms. Amide proton exchange was separated from nuclear Overhauser effect contributions by comparing experiments with spin echoes of 40- and 60-ms duration (48). The exchange rates (kHNex) were obtained as described in refs. 47 and 48.
Data Processing and Analysis. All data were processed by using nmrpipe (49). Before Fourier transformation, the data were multiplied with a Lorentzian-to-Gaussian window in t2 and a cosine bell in t1 and zero-filled to twice the size. Peaks were picked in nmrdraw (49) and integrated by summing the intensities of 15 points (5 × 3; ω2 × ω1) centered on the peak maximum. Errors in the intensities were estimated from the baseline noise. The parameters of Eq. 2, together with an additional offset term, were fit to the ratio of intensities Ic/Ia = tanh(ΔRMQT/2) + A, where Ic and Ia are the intensities in the cross- and auto-experiments, respectively, and A is an offset arising from an uncompensated phase error (41). Errors in the fitted parameters were estimated by the jackknife procedure (50) and reported as 1 standard deviation. Because the current experiment does not directly separate the various contributions to ΔRMQ, we identified residues with a significant exchange contribution by iteratively trimming the data to exclude residues with values of ΔRMQ outside of 2 standard deviations from the mean. Following convergence, exchanging residues were identified as those with ΔRMQ values at least 1 standard deviation outside of this range.
Results and Discussion
We monitored correlated conformational dynamics of adjacent residues by measuring differential MQ relaxation rates of 13Cα(i - 1)/13Cα(i) coherences. Representative auto- and cross-spectra are shown in Fig. 1. The sign of a given peak in the cross-spectrum directly reveals the sign of ΔRMQ; positive peaks correspond to faster relaxation of DQ coherences than ZQ, implying ΔRMQ > 0, and vice versa. A negative sign of ΔRMQ implies that the two chemical shifts are modulated in opposite directions during the exchange process; a positive sign reveals that they are modulated in the same direction. We quantified ΔRMQ for 46 of the 72 possible 13Cα(i - 1)/13Cα(i) multiple quantum coherences that can be created in the protein. The residues that were not analyzed suffered from (i) broadening beyond detection (K77, I100, S101, N137–E139, and F141), (ii) severe spectral overlap (T79, R90, E104, R106, T110, D129, Q140, and Q143) imposed by the limited digital resolution of the constant-time evolution period (Fig. 5), or (iii) an unexplained offset term (I130) (see below). In addition, MQ coherences involving the five glycines were not included. The extensive broadening implies that additional residues are likely to experience conformational exchange but cannot be detected because of efficient relaxation during the long coherence transfer time (56 ms) needed for each of the “out” and “back” magnetization transfer steps. Representative Ic/Ia buildup curves are shown in Fig. 2. There is an uncompensated phase error in the experiments, such that the cross-experiment contains finite intensities at T = 0, which requires an offset term to be included in the fitting procedure (41). For the large majority of residues, the offset term is <3% of the initial intensity in the auto-experiment, but in a few cases, it is significantly larger. In the case of coherences involving Ser or Thr, relaxation delays are restricted to multiples of 1/JCC, as exemplified by N111, which follows T110 in sequence (Fig. 2).
Fig. 1.

Representative auto-spectra (A) and cross-spectra (B) acquired by using a relaxation delay of T = 28 ms and signal-averaging over 128 and 512 transients, respectively. Positive and negative peaks are shown in blue and red, respectively. Negative peaks in the auto-spectrum correspond to Ser, Thr, or residues that follow.
Fig. 2.

Representative buildup curves of the ratio 〈4NzCyCy〉/〈4NzCxCx〉 for representative residues. The differential MQ relaxation rates are -3.5 ± 0.3 s-1 (E83), 24 ± 5 s-1 (N111), and 10.8 ± 0.7 s-1 (K115), as obtained by fitting Eq. 2 to the experimental data.
Correlated CSM Is Observed for a Subset of Residue Pairs. Fig. 3A shows the resulting 13Cα(i - 1)/13Cα(i) ΔRMQ values plotted versus residue number i. ΔRMQ ranges from -15 s-1 to 24 s-1. For comparison, Fig. 3B illustrates the secondary 13Cα chemical shifts in the calcium-loaded state of E140Q-Tr2C, which demonstrate that the helices are well formed in both the open and closed conformations. The majority of residues have small absolute values of ΔRMQ, indicating that correlated conformational exchange does not make a significant contribution to ΔRMQ for most pairs of 13Cα nuclei in E140Q-Tr2C, as expected from the open–closed model (Fig. 3B; see below). Taking all data into account, the average rate is 〈ΔRMQ〉 = 1 ± 6 s-1, and the trimmed mean value was 〈ΔRMQ〉trim = -0.9 ± 1.6 s-1. The calculated total contribution from rank-two interactions was 〈ΔRMQ〉calc = 0.0 ± 0.2 s-1. The calculated values showed a strong site-to-site variation, which explains in part the data scatter observed also for residues with small values of ΔRMQ (Fig. 3A). However, most of the scatter likely reflects the poor sensitivity due to limited buildup of intensity in the cross-experiment for residues with insignificant exchange. Significant conformational exchange contributions to ΔRMQ were identified for those residues having values 1 standard deviation outside the interval given by 〈ΔRMQ〉trim± 2σtrim = -0.9 ± 3.2 s-1. Based on this criterion, exchange was observed for 8 of the 46 residues that could be characterized. The absolute mean value of 〈ΔRMQ〉trim is larger than 〈ΔRMQ〉calc, indicating that our approach is parsimonious and that exchange may remain unidentified for a number of residues; hence, we err on the side of caution. It should also be noted that although a significant exchange contribution to ΔRMQ provides firm evidence that the residue pair exhibits correlated dynamics, the absence of such contributions does not indicate the absence of correlated dynamics, because the CSM may be insignificant for one or both of the spins.
Fig. 3.

Differential MQ relaxation rates, amide proton exchange rates, and chemical shift differences. (A) Differential MQ relaxation rates, ΔRMQ (left-hand vertical axis), and rates of amide proton exchange with solvent, kHNex (right-hand vertical axis), plotted versus residue number. ΔRMQ was obtained by fitting Eq. 2 to the experimental data. The dashed lines are drawn at 〈ΔRMQ〉trim± 2σtrim (where σtrim is the standard deviation), as calculated for the trimmed data set. Filled (or open) symbols indicate 13Cα(i - 1)/13Cα(i) ΔRMQ rates that include (or do not include) significant contributions from conformational exchange. The continuous line indicates kHNex rates; the results are qualitatively identical when corrected for intrinsic exchange rates. (B) Histogram of secondary 13Cα chemical shifts of calcium-loaded E140Q-Tr2C (open bars; calculated as the difference between the measured chemical shift and that expected for the same amino acid type in random-coil conformation) and of the chemical shift differences between the calcium-free and calcium-saturated states of WT Tr2C (filled bars). The secondary structure elements (boxes, α-helices; arrows, β-strands) and the calcium-binding loops (black lines) are indicated above the graphs.
Comparison with WT Chemical Shifts Reveals Deviations from the Two-State Open–Closed Model. Comparing the present results to those obtained previously from SQ 15N, 13Cα, and 1H R1ρ experiments (11, 14, 15), several important differences are identified. First, fewer residues show exchange in the 13Cα(i - 1)/13Cα(i) ΔRMQ data set. Secondly, the residues that do show exchange match only partially with those identified previously from 15N and 1H R1ρ data. These deviations may be attributed in part to different limitations of the present and previous experiments in terms of sensitivity and spectral resolution, as described above. More interestingly, the differences also reflect the fact that the chemical shift of 13Cα is not sensitive to the same type of motions as those of 15N and 1H. The 15N chemical shift is a complex function of local backbone dihedral angles, namely, Ψ(i - 1), φ(i), and Ψ(i), side-chain dihedral angles χ1(i - 1) and χ1(i), and hydrogen bonding (38, 51). The amide 1H chemical shift is often dominated by hydrogen bonds and long-range effects, such as ring currents and electrostatics (37). In contrast, the primary determinants of the 13Cα shift are the local φ and Ψ backbone dihedral angles (36–38), which account for at least 50% of the secondary shift (37). All 20 different types of amino acid residues show the same dependence on φ and Ψ in that the 13Cα chemical shift is ≈2.5 ppm higher in α-helices, and 2.0 ppm lower in β-strands, than in random coils (37). The open–closed transition of Tr2C involves mainly side-chain rearrangements, repacking of the hydrophobic core, and movement of intact secondary structure elements relative to one another, but only modest changes in secondary structure (43). Thus, it might be expected that exchange between closed and open conformations results in smaller chemical shift differences for 13Cα than for 15N or 1H. Indeed, Fig. 3B shows that the large majority of residues in the WT do not show large 13Cα shift differences between the two states, except for a limited number of residues in the calcium-binding loops; the mean absolute difference in chemical shifts between the open and closed states is 0.4 ± 0.7 ppm. This shift difference corresponds to ΔRMQ = 5 ± 9 s-1, assuming equal populations of the open and closed conformations and τex = 20 μs (11, 14, 19). In general, the cases of correlated 13Cα CSMs identified in the present work are significantly larger than those expected from the WT states. Clearly, the significant values of ΔRMQ observed here do not correspond well to the two-state open–closed transition deduced from previous work (11, 19); for example, the small shift differences between the open and closed states of the WT protein correspond to much smaller values of ΔRMQ than are actually observed for helix F (Fig. 3). This discrepancy is in agreement with SQ 13Cα R1ρ data, which reveal that helix F exhibits significantly larger values of pApBΔω2 than the other helices, indicating that it experiences greater changes in chemical shifts (15). In the following, we discuss and interpret the results for individual residues in terms of dihedral angle fluctuations.
Correlated 13Cα CSMs Offer a Structural Interpretation of the Exchange Dynamics. As mentioned above, positive values of ΔRMQ indicate that the isotropic chemical shifts of both spins are modulated in the same direction, whereas negative values correspond to anticorrelated chemical shift changes. The present results include only a single significant example of anticorrelated modulation of the chemical shifts (Figs. 3 and 4), observed for S101–A102 in the first calcium-binding site. In both the open and closed states, S101 has β-strand conformation, whereas A102 is α-helical, although the structure is better defined in the open state (43). Thus, the observed anticorrelated chemical shift changes directly show that S101 and A102 exchange from β-strand and α-helical conformations, respectively, (state A) toward random-coil conformations (state B). In the case of a pair of residues situated in an α-helix, any changes in dihedral angles away from the α-helical region of Ramachandran space would give rise to positively correlated CSMs. For these cases, the observed conformational exchange could potentially involve crankshaft motions [i.e., anticorrelated changes in Ψ(i - 1) and φ(i)], which do not change the length and compact fold of a helix appreciably.
Fig. 4.

Location in the structure of residues exhibiting significant correlated conformational exchange contributions to the 13Cα(i - 1)/13Cα(i) ΔRMQ rates. The backbone trace of calcium-loaded WT Tr2C is shown in tube representation. Residue pairs exhibiting dynamics are highlighted in red or blue, depending on whether the CSMs of the two residues are correlated or anticorrelated. Residues for which ΔRMQ rates could not be measured are shown in white, and residues without significant dynamics are shown in gray. The figure was prepared by using molmol (52).
There are only two additional isolated residue pairs exhibiting significant correlated CSMs. In the linker region, the value of ηCSM/CSM observed for residues E114–K115 shows very good agreement with that expected from the two-state open–closed model: 12.0 ± 0.3 s-1 compared to 11.4 s-1 (Figs. 3 and 4). These results support our previous conclusion that the exchanging conformations of the linker are similar to the open and closed structures of the WT protein (11, 19). The remaining instance of significant correlated CSM occurs for residues Q135–V136 in the β-strand of the second calcium-binding loop (Figs. 3 and 4). This result is not expected from the WT 13Cα chemical shifts (which predict anticorrelated CSM), but it should be noted that Q135 experiences a very small change in chemical shift between the open and closed states (Fig. 3B), suggesting that minor differences in dihedral angles from those of the WT states may change the sign of the CSM. The observed exchange is in line with our detailed model for ion release from the C-terminal calcium-binding site, as discussed previously (11), in which the carbonyl group of V136 moves away from optimal calcium coordination in connection with the open–closed transition. It can be expected that this movement is associated with changes in the backbone dihedral angles of V136 and neighboring residues, such that it is reflected in the present data.
Transient Unfolding of Helix F. Notably, significant correlated exchange is observed for virtually all residues in helix F (Figs. 3 and 4). The observed results do not match with what is expected from the WT chemical shifts (Fig. 3B) but indicate that the exchange involves a state with significantly less well defined α-helical character. It is noteworthy that the agreement with WT chemical shifts for this structural element was relatively poor also in the previous relaxation studies (11, 14, 15, 19). Because all helices appear well formed in Ca2+-loaded E140Q-Tr2C, as observed from nuclear Overhauser effect patterns (39), 15N order parameters (40), and 13Cα chemical shifts (Fig. 3B), the present results are not commensurate with a model in which one of the major exchanging conformations involves destabilization of helix F. Instead, the most likely explanation is that the 13Cα(i - 1)/13Cα(i) ΔRMQ experiment sensitively detects a minor and partially unfolded state. Importantly, this conclusion is further supported by the observation that most residues in helix F exhibit fast rates of amide proton exchange with solvent, in sharp contrast to the other secondary structure elements (Fig. 3A). Given that correlated motions are detected for overlapping pairs of 13Cα spins (namely, i - 1 and i, i and i + 1, etc.) throughout the helix and that the conformational exchange rates (kex = kAB + kBA = kAB/pB) are identical for all residues in the helix (15), the present results strongly suggest that the entire helix undergoes a concerted transition rather than progressive endfraying. The present data do not establish whether the minor state is on- or off-pathway with respect to the open–closed conformation coordinate.
Concluding Remarks. The results presented here demonstrate that the 13Cα(i - 1)/13Cα(i) ΔRMQ experiment is a very powerful means of characterizing correlated changes in backbone dihedral angles and concerted fluctuations in secondary structure. The 13Cα(i - 1)/13Cα(i) ΔRMQ relaxation rates, together with the rates of amide proton exchange with solvent and conformational exchange rates from R1ρ experiments, directly pinpoint transient and cooperative unfolding of helix F that involves only a minor population under equilibrium conditions. Importantly, previous results based on 1H and 15N relaxation experiments could not establish this phenomenon, although the extracted chemical shift differences in helix F differed from those expected from the open and closed states of the WT protein. The present results emphasize the advantages of performing multinuclear investigations of conformational exchange.
Supplementary Material
Acknowledgments
We thank Eva Thulin for expert assistance with protein expression and purification. This work was supported by research grants from the Swedish Research Council and the Swedish Foundation for Strategic Research and an instrumentation grant from the Knut and Alice Wallenberg Foundation (to M.A.). F.A.A.M. was supported by a Marie Curie postdoctoral fellowship awarded by the European Commission (HPMF-CT-2001-02145).
Author contributions: P.L., F.A.A.M., and M.A. designed research; P.L. and F.A.A.M. performed research; P.L., F.A.A.M., and M.A. analyzed data; and P.L., F.A.A.M., and M.A. wrote the paper.
Conflict of interest statement: No conflicts declared.
This paper was submitted directly (Track II) to the PNAS office.
Abbreviations: CSA, chemical shielding anisotropy; CSM, chemical shift modulation; DD, dipolar–dipolar; DQ, double quantum; Tr2C, the C-terminal domain of calmodulin; E140Q-Tr2C, the E140Q mutant of Tr2C; MQ, multiple quantum; SQ, single quantum; ZQ, zero quantum.
References
- 1.Malmendal, A., Evenäs, J., Forsén, S. & Akke, M. (1999) J. Mol. Biol. 293, 883-899. [DOI] [PubMed] [Google Scholar]
- 2.Lee, A. L., Kinnear, S. A. & Wand, A. J. (2000) Nat. Struct. Biol. 7, 72-77. [DOI] [PubMed] [Google Scholar]
- 3.Wand, A. J. (2001) Nat. Struct. Biol. 8, 926-931. [DOI] [PubMed] [Google Scholar]
- 4.Mulder, F. A. A., Hon, B., Mittermaier, A., Dahlquist, F. W. & Kay, L. E. (2002) J. Am. Chem. Soc. 124, 1443-1451. [DOI] [PubMed] [Google Scholar]
- 5.Eisenmesser, E. Z., Bosco, D. A., Akke, M. & Kern, D. (2002) Science 295, 1520-1523. [DOI] [PubMed] [Google Scholar]
- 6.Korzhnev, D. M., Salvatella, X., Vendruscolo, M., Di Nardo, A. A., Davidson, A. R., Dobson, C. M. & Kay, L. E. (2004) Nature 430, 586-590. [DOI] [PubMed] [Google Scholar]
- 7.Wolf-Watz, M., Thai, V., Henzler-Wildman, K., Hadjipavlou, G., Eisenmesser, E. Z. & Kern, D. (2004) Nat. Struct. Mol. Biol. 11, 945-949. [DOI] [PubMed] [Google Scholar]
- 8.Palmer, A. G. (2004) Chem. Rev. 104, 3623-3640. [DOI] [PubMed] [Google Scholar]
- 9.Palmer, A. G., Kroenke, C. D. & Loria, J. P. (2001) Methods Enzymol. 339, 204-238. [DOI] [PubMed] [Google Scholar]
- 10.Akke, M. (2002) Curr. Opin. Struct. Biol. 12, 642-647. [DOI] [PubMed] [Google Scholar]
- 11.Evenäs, J., Malmendal, A. & Akke, M. (2001) Structure 9, 185-195. [DOI] [PubMed] [Google Scholar]
- 12.Mulder, F. A. A., Skrynnikov, N. R., Hon, B., Dahlquist, F. W. & Kay, L. E. (2001) J. Am. Chem. Soc. 123, 967-975. [DOI] [PubMed] [Google Scholar]
- 13.Mulder, F. A. A. & Akke, M. (2003) Magn. Reson. Chem. 41, 853-865. [Google Scholar]
- 14.Lundström, P. & Akke, M. (2005) J. Biomol. NMR 32, 163-173. [DOI] [PubMed] [Google Scholar]
- 15.Lundström, P. & Akke, M. (2005) Chembiochem 6, 1685-1692. [DOI] [PubMed] [Google Scholar]
- 16.Ishima, R., Wingfield, P. T., Stahl, S. J., Kaufman, J. D. & Torchia, D. A. (1998) J. Am. Chem. Soc. 120, 10534-10542. [Google Scholar]
- 17.Mulder, F. A. A., Hon, B., Muhandiram, D. R., Dahlquist, F. W. & Kay, L. E. (2000) Biochemistry 39, 12614-12622. [DOI] [PubMed] [Google Scholar]
- 18.Dittmer, J. & Bodenhausen, G. (2004) J. Am. Chem. Soc. 126, 1314-1315. [DOI] [PubMed] [Google Scholar]
- 19.Lundström, P. & Akke, M. (2004) J. Am. Chem. Soc. 126, 928-935. [DOI] [PubMed] [Google Scholar]
- 20.Orekhov, V. Y., Korzhnev, D. M. & Kay, L. E. (2004) J. Am. Chem. Soc. 126, 1886-1891. [DOI] [PubMed] [Google Scholar]
- 21.Korzhnev, D. M., Kloiber, K. & Kay, L. E. (2004) J. Am. Chem. Soc. 126, 7320-7329. [DOI] [PubMed] [Google Scholar]
- 22.Kumar, A., Christy Rani Grace, R. & Madhu, P. K. (2000) Prog. NMR Spectrosc. 37, 191-319. [Google Scholar]
- 23.Schwalbe, H., Carlomagno, T., Hennig, M., Junker, J., Reif, B., Richter, C. & Griesinger, C. (2001) Methods Enzymol. 338, 35-81. [DOI] [PubMed] [Google Scholar]
- 24.Frueh, D. (2002) Prog. NMR Spectrosc. 41, 305-324. [Google Scholar]
- 25.Chiarparin, E., Pelupessy, P., Ghose, R. & Bodenhausen, G. (1999) J. Am. Chem. Soc. 121, 6876-6883. [Google Scholar]
- 26.Reif, B., Diener, A., Hennig, M., Maurer, M. & Griesinger, C. (2000) J. Magn. Reson. 143, 45-68. [DOI] [PubMed] [Google Scholar]
- 27.Crowley, P., Ubbink, M. & Otting, G. (2000) J. Am. Chem. Soc. 122, 2968-2969. [Google Scholar]
- 28.Kloiber, K. & Konrat, R. (2000) J. Am. Chem. Soc. 122, 12033-12034. [Google Scholar]
- 29.Skrynnikov, N. R., Konrat, R., Muhandiram, D. R. & Kay, L. E. (2000) J. Am. Chem. Soc. 122, 7059-7071. [Google Scholar]
- 30.Chiarparin, E., Pelupessy, P., Ghose, R. & Bodenhausen, G. (2000) J. Am. Chem. Soc. 122, 1758-1761. [Google Scholar]
- 31.Wokaun, A. & Ernst, R. R. (1978) Mol. Phys. 36, 317-341. [Google Scholar]
- 32.Rance, M. (1988) J. Am. Chem. Soc. 110, 1973-1974. [Google Scholar]
- 33.Kloiber, K. & Konrat, R. (2000) J. Biomol. NMR 18, 33-42. [DOI] [PubMed] [Google Scholar]
- 34.Früh, D., Tolman, J. R., Bodenhausen, G. & Zwahlen, C. (2001) J. Am. Chem. Soc. 123, 4810-4816. [DOI] [PubMed] [Google Scholar]
- 35.Vugmeyster, L., Pelupessy, P., Vugmeister, B. E., Abergel, D. & Bodenhausen, G. (2004) C. R. Physique 5, 377-386. [Google Scholar]
- 36.Spera, S. & Bax, A. (1991) J. Am. Chem. Soc. 113, 5490-5492. [Google Scholar]
- 37.Wishart, D. S. & Case, D. A. (2001) Methods Enzymol. 338, 3-34. [DOI] [PubMed] [Google Scholar]
- 38.Xu, X. P. & Case, D. A. (2002) Biopolymers 65, 408-423. [DOI] [PubMed] [Google Scholar]
- 39.Evenäs, J., Thulin, E., Malmendal, A., Forsén, S. & Carlström, G. (1997) Biochemistry 36, 3448-3457. [DOI] [PubMed] [Google Scholar]
- 40.Evenäs, J., Forsén, S., Malmendal, A. & Akke, M. (1999) J. Mol. Biol. 289, 603-617. [DOI] [PubMed] [Google Scholar]
- 41.Majumdar, A. & Ghose, R. (2004) J. Biomol. NMR 28, 213-227. [DOI] [PubMed] [Google Scholar]
- 42.Wang, C. & Palmer, A. G. (2002) J. Biomol. NMR 24, 263-268. [DOI] [PubMed] [Google Scholar]
- 43.Finn, B. E., Evenäs, J., Drakenberg, T., Waltho, J. P., Thulin, E. & Forsén, S. (1995) Nat. Struct. Biol. 2, 777-783. [DOI] [PubMed] [Google Scholar]
- 44.Tjandra, N. & Bax, A. (1997) J. Am. Chem. Soc. 119, 9576-9577. [Google Scholar]
- 45.Gottschalk, G. (1979) Bacterial Metabolism (Springer, New York).
- 46.Geen, H. & Freeman, R. (1991) J. Magn. Reson. 93, 93-141. [Google Scholar]
- 47.Mori, S., Abeygunawardana, C., van Zijl, P. C. M. & Berg, J. M. (1996) J. Magn. Reson. Ser. B 110, 96-101. [DOI] [PubMed] [Google Scholar]
- 48.Mori, S., Berg, J. M. & van Zijl, P. C. M. (1996) J. Biomol. NMR 7, 77-82. [DOI] [PubMed] [Google Scholar]
- 49.Delaglio, F., Grzesiek, S., Vuister, G. W., Zhu, G., Pfeifer, J. & Bax, A. (1995) J. Biomol. NMR 6, 277-293. [DOI] [PubMed] [Google Scholar]
- 50.Mosteller, F. & Tukey, J. W. (1977) Data Analysis and Regression: A Second Course in Statistics (Addison–Wesley, Reading, MA).
- 51.Le, H. & Oldfield, E. (1994) J. Biomol. NMR 4, 341-348. [DOI] [PubMed] [Google Scholar]
- 52.Koradi, R., Billeter, M. & Wüthrich, K. (1996) J. Mol. Graph. 14, 51-55. [DOI] [PubMed] [Google Scholar]
Associated Data
This section collects any data citations, data availability statements, or supplementary materials included in this article.