

Summary
Individual genetic admixture estimates (IA) from European Americans (EAs) were computed in 7,996 members of the Gila River Indian Community (Arizona). Parental populations for the analysis were European Americans and full-heritage Pima Indians. A logistic regression was performed on 7,796 persons, to assess association of IA with type 2 diabetes. The odds ratio, comparing diabetes risk in full-heritage EAs with full-heritage Pima Indians, was 0.329 (95% confidence interval [CI] 0.225–0.482). Proportional-hazards analysis was performed on 5,482 persons who were nondiabetic at their first examination and 1,215 subjects who developed diabetes during the study. The hazard risk ratio for IA was 0.455 (95% CI 0.301–0.688). Nondiabetic persons had significantly more European IA. In nondiabetic Pimans, multivariate linear regressions of quantitative predictors of type 2 diabetes mellitus, including fasting plasma glucose, 2-h post-load plasma glucose, and body-mass index, showed significant inverse relations with IA when controlled for sex and age. These results illustrate the ongoing evolution of populations by the mechanism of gene flow and its effect on disease risk in the groups with admixture. When the two parental populations differ in disease prevalence, higher or lower risk is associated with admixture, depending on the origin of the admixed alleles and the relative magnitude of the disease prevalence in the parental populations. These data also illustrate the strong genetic components in type 2 diabetes and are consistent with one susceptibility locus common to obesity and diabetes.
Introduction
North American populations are the product of gene flow (genetic admixture) during the last 500 years, an evolutionary process that has produced new genotypes from once-isolated parental groups; European Americans, African Americans, Mexican Americans, Asian Americans, and American Indians all share the property of being a composite of genes from many sources. Among the alleles in these admixed populations are disease susceptibility genes. Type 2 diabetes mellitus (MIM 125853) and obesity (MIM 601665) are highly prevalent among American Indians, descendents of the first migrants to the New World. During the first generations of admixture from Europeans to Indians, there occurs within the genome an association between the new alleles and disease genes that differ in frequency between the two parental populations, a phenomenon that is called “mixture disequilibrium” and that decays each generation by genetic recombination, r (Chakraborty and Weiss 1988). If a population is large, has remained stable over many generations, and D(0) is the amount of mixture disequilibrium at time 0, then in t generations it will have decreased to
This association of marker and disease alleles can be exploited to demonstrate a genetic component to the disease; to explore the relation between genetic admixture, disease prevalence and risk in the admixed population; and to test hypotheses about the nature and location of the susceptibility gene.
We illustrate the effect of mixture disequilibrium in the Pima Indians of the Gila River Indian Community (GRIC) of Arizona (Williams et al. 1986, 1992), a population with high prevalences of type 2 diabetes (Knowler et al. 1978) and obesity (Knowler et al. 1981). These two diseases have recently been found to share a common linkage on chromosome 11q (Hanson et al. 1998). It has already been shown that the genetic admixture observed in this population can have a potential confounding effect in disease-association studies (Knowler et al. 1988). In the present work, we take advantage of the genetic, clinical, and epidemiological data from this 34-year study to calculate estimates of European genetic admixture for each individual who has been tested for at least six of the genetic loci that have been employed since the beginning of the research. We then apply these individual admixture (IA) estimates in models of logistic regression to calculate the prevalence of diabetes as a function of IA, and in linear regression to study the effect of European admixture on important predictors of diabetes and obesity in this population: fasting plasma glucose, 2-h post-load plasma glucose (2-h glucose), and body-mass index (BMI).
We demonstrate below that persons with European admixture have statistically significant lower prevalence of type 2 diabetes, that nondiabetic individuals have significantly higher mean admixture, that there is an inverse relation between IA and these quantitative predictors of diabetes and obesity in nondiabetic subjects, and that the similar pattern of these predictors with IA is consistent with one susceptibility locus for both diabetes and obesity.
Material and Methods
Since 1965, Pima and Tohono O’odham American Indians (Pimans) who are residents of Districts 1–5 of the GRIC have participated in a long-range study of type 2 diabetes mellitus by the National Institute of Diabetes, Digestive, and Kidney Diseases in Phoenix, Arizona. Approximately every 2 years, each resident of the study area who is ⩾5 years old is invited for a biennial examination that includes measurements of height and weight, a medical history, and a glucose-tolerance test, in which glucose concentration is measured in venous plasma obtained fasting and 2 h after ingestion of 75 g of glucose-equivalent carbohydrate (Knowler et al. 1990).
Diabetes was diagnosed by a 2-h glucose concentration ⩾11.1 mM at a biennial research examination, or when, during routine medical care, a clinical diagnosis of diabetes was made (Knowler et al. 1978). At each examination, blood is drawn for clinical tests and for genetic marker typing. A large battery of genetic loci has been studied from the early years of the study. These include: the red-blood-cell antigens ABO, MNSs, Rhesus, Duffy, Kidd, Kell, Dombrock, and Diego; allotypic markers for the human immunoglobulins Gm and Km; the serum protein systems haptoglobin, albumin, group specific component (Gc), and transferrin; and the major histocompatibility complex loci HLA-A, HLA-B, HLA-C, and HLA-DR.
Estimates of individual genetic admixture and their variances were calculated for each subject in the population who had been typed for at least 6 of the 18 genetic loci described above. Calculations were performed by the maximum-likelihood method (Hanis et al. 1986; Chakraborty 1986). A likelihood function  is maximized with respect to μi, the population parameter for European-American admixture, in the interval [0,1] for each person based on the number of genetic loci assayed for the subject and the phenotype at each typed locus. Six categories of admixture were defined for selected analyses: IA = 0.0, 0 < IA ⩾ 0.2, 0.2 < IA ⩾ 0.4, 0.4 < IA ⩾ 0.6, 0.6 < IA ⩾ 0.8, and 0.8 < IA ⩾ 1.0.
Information in the IA estimate is derived from the second derivative of the likelihood function with respect to the estimate of admixture, mi:  .
.
An approximate variance for the estimate is the inverse of the information: s2mi≅(Imi)-1. The accuracy of this approximation increases as the number of loci typed becomes very large.
The model for genetic admixture is one with two parental populations, American Indians and European Americans. Allele frequencies for American Indians were estimated from full-heritage Pimans and are taken from published sources (Williams et al. 1985; Williams et al. 1992; Williams and McAuley 1992a, 1992b) and from analyses (haptoglobin, albumin, group-specific component, and transferrin) performed by R. C. W. for the present work. European-American allele frequencies were taken from published data (Silver 1982; Tills et al. 1983; Baur et al. 1984; Roychoudhury and Nei 1988).
The admixture index, “stated admixture,” was determined without reference to the person's genetic phenotype. Since 1963, each person residing on the reservation was asked about his or her pedigree, about the amount of admixture from other tribes, and about whether there was admixture from populations other than American Indian ones. These data have been used to establish the stated-admixture index of subsequent generations (Williams et al. 1985, 1992).
To establish whether genetic admixture is uniformly distributed among individuals in the sample, a heterogeneity statistic was calculated as
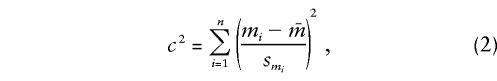 |
where mi is the maximum-likelihood IA estimate for the ith person, smi is its approximate standard error, and  is the sample mean of IA over all persons. To the extent that smi is a valid approximation to the standard error of mi , this statistic is asymptotically distributed as a random χ2 variable with n−1 df. The asymptote is reached when each individual has been typed for a very large battery of genetic loci. Since 6–18 loci are unlikely to satisfy this requirement, we have evaluated the distribution of c2, using computer simulation. When the distribution of genetic admixture approximates that expected under random mating,
  and c2 will be minimized for the sample size and structure. The nonuniform distribution of admixture alleles will inflate
  and will result in larger c2 values.
Mixture disequilibrium between two loci, A and B, at time 0 was modeled after the method of Chakraborty and Weiss (1988),
where population Z is formed by a proportion of m alleles from parent X and a proportion 1−m from Y, and Dj(0) represents the mixture disequilibrium in the jth population at time 0, and ΔΑand ΔΒ are the differences in allele frequencies at the diallelic loci A and B.
Logistic regression was used to assess the relationship between IA and diabetes prevalence by standard methods (Kleinbaum 1994). Odds ratios for the range of values of admixture were calculated from the parameter estimate, βi, while ∼95% confidence intervals (CIs) were computed from its standard error. Proportional-hazards analysis was performed by standard methods (Allison 1995). All persons who were nondiabetic at first biennial examination and had at least one subsequent exam were included. Time was calculated from the date of the first examination to the date of diagnosis of diabetes, or to the date of the last biennial examination for persons who remained free of disease. Variable IA was the main predictor, while age and sex were added as covariates. Linear regression of the relationship between IA and fasting glucose, 2-h glucose, and BMI was also performed by least squares (Sokal and Rohlf 1981). Fasting glucose, 2-h glucose, and BMI were log10 transformed to improve normality of the residuals. Age and sex were included as covariates.
Results
Table 1 lists the data for 18 genetic systems, map location (when known), the alleles at each locus, the allele frequencies in the two parental populations that were used in the individual genetic admixture estimates, and a measure of the power of each allele or haplotype to calculate admixture: Δ, the absolute value of the difference of the parental allele frequencies. Among the 18 loci are 63 alleles or haplotypes.
Table 1.
Parental Frequencies for Native and European Americans in the IA Estimates
|
Parental Population Frequency |
|||||
| Locusa | Location | Allele or Haplotypeb | European American (p1) | Native American (p2) | |Δ|c |
| ABO | 9q34 | A1 | .197 | .078 | .119 |
| A2 | .066 | .002 | .064 | ||
| B | .076 | .003 | .073 | ||
| O | .661 | .916 | .255 | ||
| MNSs | 4q28-q31 | MS | .237 | .260 | .023 |
| Ms | .309 | .449 | .140 | ||
| NS | .073 | .089 | .016 | ||
| Ns | .381 | .203 | .078 | ||
| Rhesus | 1p34-p36.2 | R1 | .429 | .577 | .148 |
| R2 | .142 | .364 | .222 | ||
| r | .382 | .035 | .347 | ||
| Rz | .004 | .023 | .019 | ||
| R0 | .027 | .001 | .026 | ||
| Duffy | 1q21-q22 | Fya | .413 | .706 | .293 |
| Fyb | .587 | .294 | |||
| Kidd | 18q11-q12 | Jka | .516 | .371 | .145 |
| Jkb | .484 | .629 | |||
| Kell | 7q31 | K | .043 | .002 | .041 |
| k | .957 | .998 | |||
| Gm | 14q32.33 | Gm1:21 | .209 | .904 | .695 |
| Gm1,2;21 | .089 | .054 | .035 | ||
| Gm1;5 | .001 | .029 | .028 | ||
| Gm3;5,13,14 | .701 | .013 | .688 | ||
| Km | 2p12 | Km1 | .043 | .424 | .381 |
| Km3 | .957 | .576 | |||
| Dombrock | Doa | .420 | .361 | .059 | |
| Dob | .580 | .639 | |||
| Diego | Dia | .001 | .019 | .018 | |
| Dib | .999 | .981 | |||
| Haptoglobin | 16q22.1 | Hp1 | .397 | .544 | .147 |
| Hp2 | .603 | .456 | |||
| Albumin | 4q11-q13 | Ala | .999 | .960 | .039 |
| Alp | .001 | .040 | |||
| Gc | 4q12 | Gc1 | .720 | .887 | .167 |
| Gc2 | .280 | .113 | |||
| Transferrin | 3q21 | Tf c | .993 | .973 | .020 |
| Tf b01 | .007 | .027 | |||
| HLA-A | 6p21.3 | 02 | .286 | .561 | .275 |
| 24 | .103 | .342 | .239 | ||
| 31 | .029 | .080 | .051 | ||
| 99 | .582 | .018 | .564 | ||
| HLA-B | 6p21.3 | 5102 | .001 | .075 | .074 |
| 4005 | .001 | .143 | .142 | ||
| 27 | .034 | .099 | .065 | ||
| 35 | .105 | .173 | .068 | ||
| 39 | .020 | .111 | .091 | ||
| 48 | .001 | .187 | .186 | ||
| 51 | .062 | .057 | .005 | ||
| 60 | .038 | .036 | .002 | ||
| 61 | .021 | .049 | .028 | ||
| 99 | .717 | .070 | .647 | ||
| HLA-C | 6p21.3 | 02 | .042 | .102 | .060 |
| 03 | .126 | .224 | .098 | ||
| 04 | .117 | .154 | .037 | ||
| 07 | .245 | .115 | .130 | ||
| 08 | .037 | .167 | .130 | ||
| 99 | .433 | .238 | .195 | ||
| HLA-DRB1 | 6p21.3 | 02 | .157 | .071 | .086 |
| 03 | .121 | .001 | .120 | ||
| 04 | .128 | .105 | .023 | ||
| 08 | .030 | .048 | .018 | ||
| 1402/6 | .001 | .735 | .734 | ||
| 99 | .563 | .040 | .523 | ||
Map locations for the Dombrock and Diego loci were not available.
Allele HLA*99 in table 1 represents the sum of allele frequencies that are present in European Americans but that are absent or have a very low frequency in Pimans.
|p1−p2|.
Figure 1 presents the distribution of individual genetic admixture. There were 2,285 persons who have mi > 0.0 and 5,711 Pimans who had a point estimate of 0.0. The large majority of admixed persons have IA estimates in the range 0.01–0.35. Mean of IA is 0.096. Average standard error for IA is 0.447.
Figure 1.

Distribution of IA estimates. There are 2,285 subjects with IA estimates > 0 and 5,711 persons with an IA value of 0. The mean of IA in the sample of 7,996 subjects is 0.096 (SD 0.201). The large number of persons with no detectable genetic admixture suggests that it has been recent and that genetic recombination has not yet uniformly distributed the new alleles in the population. This, in turn, leads to the association between the new alleles and the disease susceptibility gene(s) for type 2 diabetes and obesity.
Represented in the 7,996 IA estimates are different sets of genetic markers, 6–18 (table 2). The largest category is 8 loci, 2,759 persons. These reflect the systems that have been typed since the early years of the long-range study of diabetes: ABO, MNSs, Rhesus, Duffy, Kidd, Kell, Gm, and Km. Table 2 also represents the relationship between the number of loci in the IA values and standard error. As the number of loci increases the mean of the standard error for those persons who were typed for that number of loci generally decreases. The lowest standard error, 0.298, is for subjects typed for 18 loci.
Table 2.
Persons Typed for IA within Each Number of Loci in the Estimate, 6–18, with the Mean Standard Error and Mean IA
| No. ofLoci in IA | No. of Persons Typed | Mean Standard Error | Mean IA |
| 6 | 613 | .707 | .203 |
| 7 | 700 | .480 | .124 |
| 8 | 2,759 | .454 | .109 |
| 9 | 420 | .440 | .087 |
| 10 | 403 | .391 | .068 |
| 11 | 475 | .371 | .066 |
| 12 | 544 | .401 | .064 |
| 13 | 976 | .438 | .077 |
| 14 | 285 | .426 | .060 |
| 15 | 222 | .328 | .066 |
| 16 | 359 | .341 | .038 |
| 17 | 210 | .309 | .030 |
| 18 | 30 | .298 | .005 |
The number of persons typed for each locus, the proportion of information that the locus represents among all IA estimates, and the information per person typed are found in table 3. Locus Gm contributed the largest amount of information in the IA estimates, 22.7%, followed by Rh, 15.2%; Km, 12.7%; and HLA-B, 12.4%. However, the largest amount of information per person typed is furnished by the HLA-DRB1 locus, 4.427, followed closely by HLA-B, 4.012.
Table 3.
Information by Locus for 7,996 IA Estimates
| Locus | No. of Persons Typed | Information | Information per Person Typed | Proportion of Total |
| Gm | 7,096 | 13,747.4 | 1.397 | .227 |
| Rhesus | 7,979 | 9,251.0 | 1.159 | .152 |
| Km | 7,150 | 7,722.9 | 1.080 | .127 |
| HLA-B | 1,883 | 7,554.6 | 4.012 | .124 |
| Duffy | 7,979 | 4,702.5 | .589 | .078 |
| ABO | 7,970 | 4,412.9 | .554 | .073 |
| HLA-A | 2,173 | 3,929.1 | 1.808 | .065 |
| MNSs | 7,976 | 2,564.0 | .321 | .042 |
| HLA-DRB1 | 541 | 2,395.0 | 4.427 | .039 |
| HLA-C | 1,507 | 1,265.7 | .840 | .021 |
| Gc | 2,352 | 1,159.6 | .493 | .019 |
| Kell | 7,973 | 515.5 | .065 | .009 |
| Kidd | 3,055 | 448.2 | .147 | .007 |
| Haptoglobin | 2,508 | 447.7 | .179 | .007 |
| Diego | 4,252 | 230.8 | .054 | .004 |
| Albumin | 2,369 | 190.3 | .080 | .003 |
| Transferrin | 2,695 | 94.8 | .035 | .002 |
| Dombrock | 2,617 | 60.8 | .023 | .001 |
| Total | 60,693.8 | 1.000 |
A logistic regression was performed with a diagnosis of type 2 diabetes as the response variable, individual European genetic admixture as the primary explanatory variable, with age and sex as model covariates (table 4). There were 7,796 persons with nonmissing data in the model; 2,029 had type 2 diabetes mellitus and 5,767 were nondiabetic. In comparing full-heritage European Americans with full-heritage Pimans, the logistic odds ratio for diabetes is 0.329 (95% CI 0.225–0.482). The predicted odds ratios as a function of increasing IA are found in table 5 and are plotted in figure 2.
Table 4.
Odds Ratios (95% CI) for Logistic Regressions of Type 2 Diabetes Mellitus, in 2,029 Affected Pimans, on IA, Stated Indian Heritage, Age, and Sex in 7,796 Total Subjects
| IA | Stated Heritage | Age | Sex | −2 Log Likelihood |
| 1.077 (1.073–1.081) | 1.567 (1.383–1.775) | 6,408.6 | ||
| .329 (.225–.482) | 1.076 (1.072–1.080) | 1.557 (1.374–1.765) | 6,372.6 | |
| .205 (.132–.320) | 1.075 (1.071–1.079) | 1.541 (1.359–1.747) | 6,350.7 | |
| .571 (.373–.876) | .276 (.169–.453) | 1.075 (1.071–1.079) | 1.541 (1.359–1.747) | 6,343.9a |
An interaction term for IA and Stated Heritage was not statistically significant and was removed from the model.
Table 5.
Predicted Model Logistic Odds Ratios for Five Categories of IA, Controlled for Age and Sex
| IA Category | Odds Ratio (95% CI) |
| .1 | .894 (.612–1.309) |
| .3 | .717 (.490–1.048) |
| .5 | .574 (.393–.839) |
| .7 | .459 (.314–.672) |
| .9 | .368 (.252–.538) |
Figure 2.

Logistic regression of diabetes on IA, age, and sex was performed with 0.0 non-Indian admixture as the reference. The predicted odds ratio as a function of individual genetic admixture is presented. The parameter estimate was −1.110 (standard error 0.194). The predicted, model odds ratios and their 95% CIs are included for IAs of 0.1, 0.3, 0.5, 0.7, and 0.9.
IA was compared with stated admixture in a series of logistic regressions with diabetes as the response variable and age and sex as covariates. When each is used as the primary explanatory variable, stated admixture has a larger difference of −2 log likelihood (when compared to the model with age and sex alone), 57.9 versus 36 for IA; however, the 95% CIs for the odds ratios overlap (table 4). When IA is added to a logistic model that has stated admixture as an explanatory variable, it adds information (difference in model −2 log likelihoods = 6.8, 1 df, P<.05). The same is true when stated admixture is added to a model with IA (difference in model −2 log likelihoods = 28.7, 1 df, P<.05). When an interaction term is added to a model with both IA and stated admixture, its estimate is not significantly different from zero (table 4).
To incorporate time into the calculation of risk for type 2 diabetes as a function of IA in Pimans, a proportional-hazards analysis was also performed. A sample of 5,482 persons were nondiabetic at first clinical examination, had at least two biennial examinations, and had also been typed for ⩾6 genetic markers in table 1. There were 1,215 Pimans who developed diabetes during the study and 4,267 who were censored at their last biennial examination. Average follow-up time was 12.1 years/person, with a total of 66,352 person-years. IA has a strong, protective effect on developing diabetes in Pimans (hazard risk ratio [HRR] = 0.455; 95% CI 0.301–0.688). Covariates age (HRR = 1.037; 95% CI 1.033–1.040) and sex (HRR = 1.295; 95% CI 1.152–1.457) were significant risk factors for diabetes in this population.
On average, nondiabetic persons had nearly twice as much European admixture as did those with the disease. The mean of IA for the 2,029 persons with the disease is 0.057 (95% CI 0.051–0.063), while the mean for the 5,767 subjects without diabetes is 0.108 (95% CI 0.102–0.114). The CIs for the two estimates do not overlap.
The effect of individual European admixture on fasting glucose, 2-h glucose, and BMI in Pimans was assessed by linear regression of these variables at last biennial examination on IA, age, and sex, stratified by diabetes (table 6). The regression lines were adjusted to mean age and sex of the nondiabetic persons to construct figure 3. Both fasting and 2-h glucose have a strong relation with IA in nondiabetic subjects; their parameter estimates for IA in the regressions were significantly different from zero, with a negative slope. In contrast, IA was not significantly related to these risk factors in the diabetic strata. The linear model fitted to fasting glucose predicts a 3.1% reduction in nondiabetic persons (from 92.5 to 89.6 mg/dl) (fig. 3). Observed is an average reduction in the age- and sex-adjusted means of 4.8% (from 93.1 to 89.3 mg/dl) (table 7). The linear model fitted to 2-h glucose predicts a reduction of 4.6% (from 105.0 to 100.2 mg/dl) (fig. 3), this compared to the observed average reduction of 6.2% (from 109.3 to 102.5 mg/dl) (table 7).
Table 6.
Linear Regressions of Fasting and 2-h Glucose and BMI on IA, Age, and Sex Stratified by Type 2 Diabetes, All Persons Typed with at Least Six Genetic Loci[Note]
|
Coefficient (95% CI) |
|||||
| Variable | Diabetes | βIA | βAGE | βSEX | n |
| Fasting Glucose | No | −.017 (−.223 to −.012) *** | .0009 (.0008 to .0010) *** | −.012 (−.014 to −.010) *** | 4,501 |
| Yes | .015 (−.048 to .078) ** | −.0011 (−.0017 to −.0005) *** | −.013 (−.032 to .006) ** | 1,594 | |
| 2-h Glucose | No | −.025 (−.039 to −.012) *** | .0018 (.0017 to .0020) *** | .033 (.028 to .039) *** | 5,508 |
| Yes | .004 (−.056 to .064) ** | −.0007 (−.0013 to −.0002) * | −.001 (−.018 to .018) ** | 1,598 | |
| BMI | No | −.051 (−.065 to −.037) *** | .0026 (.0024 to .0028) *** | .035 (.029 to .041) *** | 5,709 |
| Yes | −.008 (−.034 to .019) ** | −.0026 (−.0029 to −.0024) *** | .032 (.024 to .040) *** | 1,958 | |
Note.—Response variables were log10 transformed in the linear regressions.
P<.05.
P>.05.
P<.001.
Figure 3.

Linear regressions of 2-h glucose (blackened squares) and fasting glucose (unblackened squares) and BMI (blackened triangles) on age, sex, and IA in nondiabetic persons are presented (table 6). The regressions have been adjusted to the sex and mean age of nondiabetic subjects in the sample and have a negative slope; the three quantitative risk factors for diabetes decrease with increasing IA. A likely explanation is that the high-risk disease susceptibility genes in full-heritage persons are being replaced by lower-risk alleles from Europeans, which leads to lower concentrations of fasting and 2-h glucose, and a smaller BMI, in admixed persons. The similar pattern for the three variables is consistent with linkage results that suggest a common genetic component on chromosome 11q for obesity and diabetes in Pima Indians.
Table 7.
Age- and Sex-Adjusted Mean Values for Quantitative Risk Variables in Nondiabetic Pima Indians
|
Fasting Glucose |
2-h Glucose |
BMI |
||||
| IA | Mean (95% CI) | n | Mean (95% CI) | n | Mean (95% CI) | n |
| .0 | 93.1 (92.8–93.5) | 3,110 | 109.3 (108.4–110.1) | 3,848 | 29.2 (28.9–29.4) | 3,963 |
| .1 | 92.8 (92.0–93.7) | 416 | 107.5 (105.2–109.8) | 511 | 28.4 (27.7–29.1) | 532 |
| .3 | 91.6 (90.8–92.4) | 459 | 107.1 (104.9–109.3) | 551 | 27.9 (27.2–28.5) | 578 |
| .5 | 92.0 (91.0–93.1) | 277 | 105.7 (102.9–108.6) | 327 | 27.9 (27.1–28.8) | 338 |
| .7 | 91.0 (89.5–92.4) | 145 | 105.8 (101.7–109.9) | 162 | 27.2 (26.1–28.4) | 178 |
| .9 | 89.3 (87.5–91.1) | 94 | 102.5 (97.5–107.5) | 109 | 25.7 (24.3–27.1) | 120 |
The trend for BMI for nondiabetic subjects follows that of the glucose variables for nondiabetics, who have a strong negative relation between BMI and IA, while there is no significant effect for the diabetic stratum (table 6). Predicted from the linear model is an 9.0% reduction in BMI (from 27.7 to 25.2 kg/m2) (fig. 3), whereas the observed mean reduction in age- and sex-adjusted BMI is 12.0% (from 29.2 to 25.7 kg/m2) (table 7).
To determine the extent to which individuals differ in their admixture proportions in the sample of 7,996 IA estimates, the heterogeneity c2 statistic was calculated for each estimate mi, by using the mean of IA in the sample, 0.096, as the parameter estimate, μ. The value for c2 is 2,517.5. A sample with the same structure and mean admixture, but with admixture distributed as expected under many generations of random mating, was simulated 1,000 times. The distribution of the resulting statistic is found in figure 4a. The mean of the simulated c2 values is 1,907.7 with range 1,763.1–2,072.4. For each simulation, the mean of IA was calculated and its distribution is found in figure 4b. The mean of the distribution of means is 0.096, the point estimate of the average IA in the observed sample, which demonstrates that the structure of the observed sample was maintained during the simulations.
Figure 4.

a, Distribution of the heterogeneity c2 statistic for IA in 1,000 simulated random-mating samples, with uniform distribution of genetic admixture. This distribution was generated by computing formula (2) for the 7,996 persons who had at least six genetic marker phenotypes from which a point estimate of IA was calculated, while using the mean of IA over all persons as the parameter estimate. For each simulation, the sample structure was maintained; a random genotype was chosen only for each marker tested for each person. The mean of the 1,000 simulations is 1,907.7 with a range of 1,763.1 to 2,072.4. The observed heterogeneity c2 statistic is 2,517.5, which is represented by the vertical line. b, Distribution of means for IA in the 1,000 simulations. In the observed sample, the mean of IA is 0.096. The mean of means for the 1,000 simulations is also 0.096.
The actual value of mixture disequilibrium in this sample is unknown. To illustrate the hypothetical decay of mixture disequilibrium in the Pimans, values were assigned to the variables in equation (3) to calculate its magnitude at time 0, after which equation (1) was used to compute its decay at five levels of recombination: 0.1, 0.2, 0.3, 0.4, and 0.5. For pre-existing mixture disequilibrium in the parental populations,  ; m = 0.096, the mean of IA in the sample; ΔA=0.197, the average difference in the 63 alleles and haplotypes at the 18 loci; ΔB=0.264, the difference in disease-allele frequency when assuming a dominant model for the disease locus with two alleles and using the age-adjusted prevalence rate in Europeans and Pimans (King and Rewers 1993) to estimate the allele frequencies. Assuming a single “pulse” of genetic admixture for the Pimans, then from equation (3),
  . As recombination between the disease and marker loci increases, the decay of mixture disequilibrium accelerates (fig. 5). When two loci are not linked (r=0.5), the association between them is virtually lost in three or four generations, decreasing by half with each generation. When the loci are closely linked (r=0.1), substantial mixture disequilibrium can remain in the population for many generations.
Figure 5.

Decay of mixture disequilibrium, calculated for five values of genetic recombination after the method of Chakraborty and Weiss (1988). When a disease and marker locus are not linked, r=0.5, the association between them decreases very rapidly, and, within three to four generations, the ability to detect mixture disequilibrium will be lost. Even when r<0.5, after 20–30 generations the mixture disequilibrium is going to be small. This may be the reason that associations between disease alleles and American Indian admixture in Mexican Americans has not been found. See text for details.
Discussion
Single-allele and multiallelic weighted least-squares estimates of sample mean genetic admixture from Europeans have been characterized in this population and applied in a number of reports: its magnitude for the entire population is estimated as 0.054 (95% CI 0.044–0.063) (Williams et al. 1992); estimates derived from genetic marker data are strongly correlated with the self-reported heritage variable (Williams et al. 1986); European-derived genes come primarily and indirectly from Mexican Americans (Williams et al. 1992), who themselves are a hybrid of European, American Indian, and African ancestors (Long et al. 1991); and European admixture can be a confounding variable in studies of association between disease and genetic markers (Knowler et al. 1988).
We have now extended this work to measure admixture at the level of the person and to relate IA to quantitative predictors of diabetes in Pimans. Measures of fasting and 2-h glucose are bimodal in Pimans; the distributions of these variables can be described by two overlapping normal distributions, the lower component representing nondiabetic levels of plasma glucose and the upper distribution representing diabetes and a higher risk of its associated complications (Miller et al. 1968; Rushforth et al. 1971; Rushforth et al. 1979; Knowler et al. 1990). Whereas a person’s glucose concentration moves from one distribution to the other, the critical value that separates the distributions varies little with age (Rushforth et al. 1971).
Obesity plays a large role in the incidence of diabetes in Pima Indians (Knowler et al. 1981). Age- and sex-specific incidence rates of diabetes are higher in categories of larger BMI in both sexes and all age groups above 15 years (Knowler et al. 1990). Even in modest ranges of BMI, 20–25 kg/m2, the age- and sex-adjusted incidence rate in Pimans is about eight times that in Europeans (Knowler et al. 1981). Other factors, such as diabetes in the parents, can modify the effect of obesity in the incidence of the disease; however, diabetes does develop much less frequently in thin Pima Indians, even those with the potential inherited risk of parental diabetes (Knowler et al. 1990).
European IA in Pimans is inversely related to the levels of fasting and 2-h glucose and BMI in nondiabetic persons (tables 6 and 7 and fig. 3). Nondiabetic individuals have nearly twice as much admixture on average as do diabetic persons, a difference that is statistically significant. These observations suggest that European admixture is replacing high-risk susceptibility alleles in Pimans with lower-risk alleles from European-derived populations. Therefore, admixed persons with a different genetic background, with lower plasma concentrations of glucose and lower mean BMI, are less likely to be obese or to have diabetes.
This conclusion is supported by the lower diabetes prevalence in admixed persons, when age and sex are controlled for. The adjusted odds ratio, comparing the risk for diabetes in full-heritage European Americans with full-heritage Pimans, is 0.329, which is significantly different from 1.0 (table 4). In table 5 and figure 2 are the adjusted odds ratios predicted from the fitted logistic model for the five categories of IA. While the high prevalence of diabetes in Pimans precludes using the adjusted odds ratio as a risk ratio, the odds ratio does act as a general measure of the protective effect of IA on developing diabetes in an admixed person. For instance, the children of a full-heritage Piman parent and one who is full-heritage European American would have an IA of 0.5 and a predicted adjusted odds ratio of 0.574, which is also significantly different from 1.0 (table 5).
A genetic component to diabetes in the Pimans was an early hypothesis in this long-range study. The bimodal normality of the glucose distributions led to early, simple models for the inheritance of type 2 diabetes in Pimans (Rushforth et al. 1971). This hypothesis was further supported by the pattern of inheritance in family studies (Knowler et al. 1981), the association of the disease with the HLA-A2 antigen (Williams et al. 1981), and segregation analysis (Hanson et al. 1995), and it has culminated in the genomic search for the relevant disease loci (Hanson et al. 1998). Recent reports also support a likely genetic component to obesity in this population (Price et al. 1994; Hanson et al. 1998).
Of particular interest for the present work is the segregation analysis of Hanson et al. (1995), which was consistent with the hypothesis that a major gene influences the risk for type 2 diabetes in Pima Indians by affecting the age at onset. Our proportional-hazards analysis, in which time was calculated between the first biennial examination and age at onset for persons who developed diabetes, also supports this hypothesis. When age and sex are controlled for, the hazard risk ratio for IA is 0.455. Reduction in the hazard of diabetes is, therefore, 0.545, for which there are two interpretations. First, it is an estimate for the proportion of risk attributable to IA in this population. Second, if one assumes that admixture fully captures the genetic susceptibility, it provides an estimate for the partition of risk between genes, 0.545, and environmental factors, 0.455.
The very similar trend of decreasing value with increasing IA, for fasting glucose, 2-h glucose, and BMI, suggests a correlation in the effects of IA on both diabetes (as measured by hyperglycemia) and obesity (as measured by high BMI), which, in turn, is a risk factor for diabetes. The autosomal genomic scan of Hanson et al. (1998) found evidence for a pleiotropic effect on chromosome 11q in the region between loci D11S4464 and D11S912. A multipoint bivariate analysis implied that one locus in this region contributed both to diabetes and obesity (i.e., the genetic correlation between the obesity and diabetes loci was 1.0). Whether a single locus is responsible for the strong associations of IA with both diabetes and obesity remains to be determined.
The association of diabetes and obesity with IA and the results of the genomic scan also support the hypothesis of a New World syndrome of metabolic diseases in American Indians that share a common genetic and evolutionary basis (Weiss et al. 1984; Weiss 1993). Type 2 diabetes, obesity, and gallbladder disease are epidemic among American Indians and admixed groups such as Mexican Americans (Weiss et al. 1984). The similar pattern of diabetes and obesity with IA, along with the mapping results of Hanson et al. 1998, would be consistent with a common genetic background for two of the three complex diseases in the syndrome. The relationship between gallbladder disease and IA in Pimans has not yet been determined.
Detection of an association between IA estimates and disease depends on several factors: (1) the disease is clinically well defined, with a genetic component and differences in prevalence between the parental populations; (2) a large number of persons have been typed with informative genetic markers; (3) a powerful technique for calculating IA is employed; and (4) there is mixture disequilibrium and a nonuniform distribution of admixture in the sample.
In addition to the clinical definition and the inherited component, which have already been discussed, it is necessary that the parental populations whose allele frequencies are used for the IA estimates differ in their prevalence of the disease. King and Rewers (1993) report directly comparable global estimates of the prevalence of glucose intolerance and diabetes mellitus. In persons aged 30–64 years, when compared to the NHANES II sample of non-Hispanic whites, Pima and Tohano O’odham Indians of Arizona have an age-adjusted prevalence rate of diabetes mellitus 10 times as high in men (5.0 vs. 49.4) and 7 times as high in women (7.2 vs. 51.1) (King and Rewers 1993). While this difference is large, it must be viewed cautiously, because there might be other demographic covariates that differ between the NHANES II sample and Pima Indians.
Attempts to measure the contribution of a parental population at the level of the individual is a difficult problem, because, unlike estimates of the average admixture, in which the entire sample can be used, each subject represents a sample of n=1. In order to compute IA, one must instead use a battery of phenotypes from informative genetic loci for which the person has been typed. Maclean and Workman (1973a, 1973b) developed a Bayesian approach to calculate an individual’s proportion of ancestry and a regression method to test the association of this estimate with a quantitative variable. They reported a statistically significant association of diastolic blood pressure and estimated proportion of African alleles (MacLean et al. 1974). Reed (1973) presented a formula for calculating the minimum number of genetic loci for a precise estimate of IA, 18 “ideal” loci of two alleles each for estimating IA with a 95% CI of 0.20. An “ideal” represents a diallelic locus, one allele of which would be monomorphic in each parent population, or Δ=1. In the present study, the large majority of persons were typed for ⩾8 loci (table 2).
If one were to design a similar study today, there are certainly better and more numerous admixture markers available. However, while many of the loci incorporated in the present work would be classified as “traditional” markers, they are matched with epidemiological data from a longitudinal study of 34 years. Genetic and clinical information are available for persons from the beginning, many of whom can no longer be sampled. Also, the large sample size allows the data to be partitioned with reasonable numbers of observations in the strata. Parental frequencies are available for the genetic loci, because many population reports have been published. With these markers, hazard analyses can be performed with many person-years of follow-up time. Finally, genetic information can be gleaned from any polymorphism irrespective of the level of testing—product or gene. Particularly good markers for genetic admixture include Gm1;21 (Δ=0.695), Gm3;5,13,14 (Δ=0.688), HLA-DRB1*1402/6 (Δ=0.734), and the HLA*99 allele categories that include those with low-to-negligible frequency in full-heritage American Indians at HLA-A, B, C, and DRB1 where the respective Δ values are 0.564, 0.647, 0.195, and 0.523 (table 1). The very high Δ value of HLA-DRB1 is reflected in the highest value per person in table 3, 4.427.
The third necessary component to IA estimation is a powerful statistical technique. In the present study, a maximum-likelihood method was used to estimate IA in the 7,996 subjects in the GRIC after the procedure of Hanis et al. (1986) and Chakraborty (1986), who applied it to Mexican Americans. An important addition to their method is the calculation of the variance of the estimate of IA for each person and the emphasis placed on the joint representation of the point estimate of admixture and a measure of information in a set {mi,Imi}. The information in an IA estimate is related to differences between the parental populations at a genetic locus and the number of genetic loci in the estimate. Even at an informative locus, the phenotypes will often vary greatly in the amount of information that they possess for the estimate of IA. Phenotypes with alleles with large values of Δ will add a large amount of information to the estimate (decreasing the variance), whereas those with alleles of similar frequencies in the parents will add little information.
The demonstration of the relationships between disease risk and genetic admixture also depends upon the presence of a nonuniform distribution of genetic ancestry in the population. When genetic admixture includes loci that confer either higher or lower risk of a disease and the admixture is recent, the disease loci and marker loci for admixture will be correlated in the admixed persons, even when the loci are not linked. In addition, at this early stage of genetic admixture, the alleles from the parental populations will not be spread evenly through the population but will be concentrated in a proportion of admixed persons. This will be reflected in IA by a heterogeneous distribution of estimates. Many persons in a population with genetic admixture will be full heritage, while a proportion will have 0.0<mi<1.0. The expected situation is observed in figure 1 in the present sample. More than half of the subjects (5,711) have IA 0, while the remainder vary in their admixture estimates; this is reflected in the observed heterogeneity c2 statistic, 2,517.5, which is well outside the range of values in the simulations (1,763.1–2,072.4) (fig. 4a). The distribution of European-American admixture (fig. 1) and this simulation demonstrate that there are significant differences in genetic admixture between individuals in this population, a heterogeneity that has been exploited to demonstrate the relationships between admixture and diabetes.
This recent, nonuniform distribution of admixture also creates the “mixture disequilibrium” defined by Chakraborty and Weiss (1988), who were particularly interested in linked genes and the effect that admixture would have on the detection of linkage. Their formula can also be applied to unlinked genes (r=0.5). From the hypothetical model in figure 5, it can be seen that the association between admixture and disease alleles decays very rapidly when r is large, even when the initial amount of mixture disequilibrium is also large (0.104). The rapid decline depends upon the assumption that random mating will quickly and uniformly disperse the new alleles throughout the population. If, however, there is nonrandom mating caused by the nonuniform distribution of admixed alleles over a large geographic area that serves as a barrier to the random association of gametes, then this loss of association, even when r=0.5, could be retarded.
Decay of mixture disequilibrium may play a role in the absence of an association of disease risk for diabetes mellitus and American Indian admixture in the Mexican Americans. Hanis et al. (1986) used 16 genetic loci to test the association of individual risk of diabetes and gallbladder diseases among 1,073 Mexican Americans in Starr County, Texas, but did not demonstrate a statistically significant (P<.05) association between either disease and the individual proportion of American-Indian genes. Similarly, Tseng et al. (1998) found that gallstone disease is not associated with increasing American-Indian admixture in Mexican Americans. If the genetic admixture from Europeans and Africans occurred early in the genesis of the Mexican-American population in the 16th century, then, given a generation period of 20 years, there have been 20–25 generations since the origin of the population (Long et al. 1991). From figure 5, it can be seen that, except for the most closely linked genes, the association between disease gene and marker will have been lost.
In Pimans, IA and stated admixture give similar results in the logistic models for type 2 diabetes, but they are not identical. Whether to employ stated admixture or IA to assess the association of admixture with a disease in a proposed study would depend upon a number of factors. Clearly, when the population is small, the admixture is recent, and nearly complete pedigrees have been developed for the large majority of persons in the group, then stated admixture will provide accurate estimates of non-Indian heritage (Knowler et al. 1988; Williams et al. 1992). However, when the mixture of alleles occurred many generations ago, then one might wish to employ the method of estimating IA from informative markers. Estimates of IA, because they employ genetic markers, are free from the limitations of time and memory, whereas stated admixture can only be accurately determined for perhaps three to five generations. Therefore, stated admixture also has a variance, but it often cannot be measured. If the admixture is recent, the variance of stated admixture is close to zero. As the mixture event moves farther back in time, the variance of the estimate becomes larger. Also, in populations in which the genetic admixture has been present for generations, such as Mexican and African Americans, for many persons, the concept of stated admixture has little meaning. In addition, parental allele and haplotype frequencies have been specifically chosen to measure European-American admixture in the IA estimates, whereas stated admixture can reflect a greater number of parental populations (Williams et al. 1992). Finally, because each measure of admixture might contain its own unique component, if resources and circumstances permitted, one might wish to compute IA and collect stated admixture from pedigrees.
Summary and Conclusions
Genetic admixture is the result of an evolutionary mechanism, gene flow, by which alleles from two once geographically isolated populations unite to form a third, admixed group. The result of gene flow is the addition of new variation and a change in the allele-frequency distribution at a locus; this is the modern genetic definition of evolution. As European-American alleles enter the American Indian community, the high-frequency susceptibility alleles for type 2 diabetes and obesity are replaced by lower-risk alleles. This process can be considered a “natural experiment” in human population biology, one that will occur frequently in the future as once-isolated human gene pools join to form new combinations of alleles, genetic variation that will confer new risks, higher and lower, of diseases in admixed persons.
Acknowledgments
We thank the members of the GRIC for their cooperation and participation in this study, and we thank the staff of the Diabetes and Arthritis Epidemiology Section at the National Institute of Diabetes, Digestive, and Kidney Diseases for conducting the examinations. We also thank Dr. Kenneth Weiss for his helpful comments on the manuscript. R. C. W. dedicates his contribution to the manuscript to the memory of Dr. Henry Gershowitz and acknowledges the first author’s continuing debt to him as mentor, colleague, and friend. This research was partially supported by grant BSF45-3,4 from Blood Systems Foundation, Blood Systems, Inc., Scottsdale, AZ.
Electronic-Database Information
Accession numbers and the URL for data in this article are as follows:
- Online Mendelian Inheritance in Man (OMIM), http://www.ncbi.nlm.nih.gov/Omim/ (for type 2 diabetes mellitus [MIM 125853] and obesity [MIM 601665])
References
- Allison P (1995) Survival analysis using the SAS system, a practical guide. SAS Institute Inc., Cary, North Carolina [Google Scholar]
- Baur MP, Neugebaur M, Albert ED (1984) Reference tables of two-locus haplotype frequencies for all MHC marker loci. In: Albert ED, Baur MP, Mayr WR (eds) Histocompatibility testing 1984. Springer-Verlag, Berlin [Google Scholar]
- Chakraborty R (1986) Gene admixture in human populations: Models and predictions. Yearbook Phys Anthropol 29:1–43 [Google Scholar]
- Chakraborty R, Weiss KM (1988) Admixture as a tool for finding linked genes and detecting that difference from allelic association between loci. Proc Nat Acad Sci USA 85:9119–9123 [DOI] [PMC free article] [PubMed]
- Hanis CL, Chakraborty R, Ferrell RE, Schull WJ (1986) Individual admixture estimates: disease associations and individual risk of diabetes and gallbladder disease among Mexican-Americans in Starr County, Texas. Am J Phys Anthropol 70:433–441 [DOI] [PubMed]
- Hanson RL, Ehm MG, Pettitt DJ, Prochazka M, Thompson DB, Timberlake D, Foroud T, et al (1998) An autosomal genomic scan for loci linked to type II diabetes mellitus and body-mass index in Pima Indians. Am J Hum Genet 63:1130–1138 [DOI] [PMC free article] [PubMed] [Google Scholar]
- Hanson RL, Elston RC, Pettitt DJ, Bennett PH, Knowler WC (1995) Segregation analysis of non-insulin-dependent diabetes mellitus in Pima Indians: evidence for a major-gene effect. Am J Hum Genet 57:160–170 [PMC free article] [PubMed]
- King H, Rewers M (1993) Global estimates for prevalence of diabetes mellitus and impaired glucose tolerance in adults. Diabetes Care 16:157–177 [DOI] [PubMed]
- Kleinbaum DG (1994) Logistic regression, a self-learning text. Springer-Verlag, New York [Google Scholar]
- Knowler WC, Bennett PH, Hamman RF, Miller M (1978) Diabetes incidence and prevalence in Pima Indians: a 19-fold greater incidence than in Rochester, Minn. Am J Epidemiol 108:497–505 [DOI] [PubMed]
- Knowler WC, Pettitt DJ, Saad MF, Bennett PH (1990) Diabetes mellitus in the Pima Indians: incidence, risk factors and pathogenesis. Diabetes Metab Rev 6:1–27 [DOI] [PubMed]
- Knowler WC, Pettitt DJ, Savage PJ, Bennett PH (1981) Diabetes incidence in Pima Indians: contributions of obesity and parental diabetes. Am J Epidemiol 113:144–156 [DOI] [PubMed]
- Knowler WC, Williams RC, Pettitt DJ, Steinberg AG (1988) Gm(3;5,13,14) and type 2 diabetes mellitus: an association in American Indians with genetic admixture. Am J Hum Genet 43:520–526 [PMC free article] [PubMed]
- Long JC, Williams RC, McAuley JE, Medis R, Partel R, Tregellas WM, South SF, et al (1991) Genetic variation in Arizona Mexican Americans: estimation and interpretation of admixture proportions. Am J Phys Anthropol 84:141–157 [DOI] [PubMed]
- MacLean CJ, Adams MS, Leyshon WC, Workman PL, Reed TE, Gershowitz H, Weitkamp LR (1974) Genetic studies on hybrid populations. III. Blood pressure in an American black community. Am J Hum Genet 26:614–626 [PMC free article] [PubMed]
- MacLean CJ, Workman PL (1973a) Genetic studies on hybrid populations. I. Individual estimates of ancestry and their relation to quantitative traits. Ann Hum Genet 36:341–351 [DOI] [PubMed]
- ——— (1973b) Genetic studies on hybrid populations. II. Estimation of the distribution of ancestry. Ann Hum Genet 36:459–465 [DOI] [PubMed]
- Miller M, Bennett PH, Burch TA (1968) Hyperglycemia in Pima Indians: a preliminary appraisal of its significance. In: Biomedical challenges presented by the American Indian. Publication 165. Pan American Health Organization, Washington, DC, pp 89–103 [Google Scholar]
- Price RA, Charles MA, Pettitt DJ, Knowler WC (1994) Obesity in Pima Indians: genetic segregation analyses of body mass index complicated by temporal increases in obesity. Hum Biol 66:251–274 [PubMed]
- Reed TE (1973) Number of gene loci required for accurate estimation of ancestral population proportions in individual human hybrids. Nature 244:575–576 [DOI] [PubMed]
- Roychoudhury AK, Nei M (1988) Human polymorphic genes world distribution. Oxford University Press, Oxford [Google Scholar]
- Rushforth NB, Bennett PH, Steinberg AG, Burch TA, Miller M (1971) Diabetes in the Pima Indians: evidence of bimodality in glucose tolerance distributions. Diabetes 20:756–765 [DOI] [PubMed]
- Rushforth NB, Miller M, Bennett PH (1979) Fasting and two-hour post-load glucose levels for the diagnosis of diabetes: the relationship between glucose levels and complications of diabetes in the Pima Indians. Diabetologia 16:373–379 [DOI] [PubMed]
- Silver H (1982) Probability of inclusion in paternity testing: a technical workshop. American Association of Blood Banks, Arlington, Virginia [Google Scholar]
- Sokal RR, Rohlf FJ (1981) Biometry. W.H. Freeman and Company, New York [Google Scholar]
- Tills D, Kopec AC, Tills RE (1983) The distribution of the human blood groups and other polymorphisms, supplement 1. Oxford University Press, Oxford [Google Scholar]
- Tseng M, Williams RC, Maurer KR, Schanfield MS, Knowler WC, Everhart JE (1998) Genetic admixture and gallbladder disease in Mexican Americans. Am J Phys Anthropol 106: 361–371 [DOI] [PubMed]
- Weiss KM (1993) Genetic variation and human disease, principles and evolutionary approaches. Cambridge University Press, Cambridge [Google Scholar]
- Weiss KM, Ferrell RE, Hanis CL (1984) A new world syndrome of metabolic diseases with a genetic and evolutionary basis. Yearbook Phys Anthropol 27:153-178 [Google Scholar]
- Williams RC, Knowler WC, Butler WJ, Pettitt DJ, Lisse JR, Bennett PH, Mann DL, et al (1981) HLA-A2 and type 2 (insulin independent) diabetes mellitus in Pima Indians: an association of allele frequency with age. Diabetologia 21:460–463 [DOI] [PubMed]
- Williams RC, Knowler WC, Pettitt DJ, Long JC, Pokala DA, Polesky HF, Hackenberg RA, et al (1992) The magnitude and origin of European-American admixture in the Gila River Indian Community of Arizona: a union of genetics and demography. Am J Hum Genet 51:101–110 [PMC free article] [PubMed]
- Williams RC, McAuley JE (1992a) HLA class I variation controlled for genetic admixture in the Gila River Indian Community of Arizona: A model for the Paleo-Indians. Hum Immunol 33:39–46 [DOI] [PubMed]
- ——— (1992b) HLA class II variation in the Gila River Indian Community of Arizona: alleles, haplotypes, and a high frequency epitope at the HLA-DR locus. Hum Immunol 33:29–38 [DOI] [PubMed]
- Williams RC, Steinberg AG, Gershowitz H, Bennett PH, Knowler WC, Pettitt DJ, Butler W, et al (1985) Gm allotypes in Native Americans: evidence for three distinct migrations across the Bering land bridge. Am J Phys Anthropol 66:1–19 [DOI] [PubMed]
- Williams RC, Steinberg AG, Knowler WC, Pettitt DJ (1986) Gm3;5,13,14 and stated-admixture: independent estimates of admixture in American Indians. Am J Hum Genet 39:409–413 [PMC free article] [PubMed]