

Abstract
Methods based on variance components are powerful tools for linkage analysis of quantitative traits, because they allow simultaneous consideration of all pedigree members. The central idea is to identify loci making a significant contribution to the population variance of a trait, by use of allele-sharing probabilities derived from genotyped marker loci. The technique is only as powerful as the methods used to infer these probabilities, but, to date, no implementation has made full use of the inheritance information in mapping data. Here we present a new implementation that uses an exact multipoint algorithm to extract the full probability distribution of allele sharing at every point in a mapped region. At each locus in the region, the program fits a model that partitions total phenotypic variance into components due to environmental factors, a major gene at the locus, and other unlinked genes. Numerical methods are used to derive maximum-likelihood estimates of the variance components, under the assumption of multivariate normality. A likelihood-ratio test is then applied to detect any significant effect of the hypothesized major gene. Simulations show the method to have greater power than does traditional sib-pair analysis. The method is freely available in a new release of the software package GENEHUNTER.
The recent explosion in genetic-mapping data has placed a premium on the development of nonparametric methods for the detection of linkage to quantitative traits. The most widely used such method is based on regression of trait differences between sib pairs on the number of alleles shared identical by descent (IBD) at a locus being tested (Haseman and Elston 1972). Because this approach confines analysis to sib pairs, much inheritance information in general pedigrees is wasted.
An alternative approach that simultaneously examines all pedigree relationships has recently been developed from classical variance-components analysis. The classical technique simply separates the total variance into components due to genetic and environmental effects (Lange et al. 1976). Hopper and Matthews (1982) first suggested adapting the method to linkage analysis by modeling an additional variance component for a hypothesized quantitative-trait locus (QTL) near a marker site. Linkage to the locus is indicated by a statistically significant nonzero value for the QTL component. As an additional benefit, the relative size of the component gives a measure of the magnitude of the effect of a detected locus.
The earliest versions of this method were based on analysis of only one or two markers at a time (Goldgar 1990; Schork 1993; Amos 1994). Almasy and Blangero (1998) improved on this by using an approximation to a multipoint algorithm. Their method estimates IBD sharing at arbitrary points along the chromosome, by means of regression on IBD values at marker loci. Simulation studies have shown variance-components analysis to be more powerful than Haseman-Elston regression (Amos et al. 1996, 1997; Pugh et al. 1997; Williams et al. 1997; Almasy and Blangero 1998).
Here we present a new implementation of the variance-components method, which offers the added power of an exact multipoint approach. Our version builds on previously developed algorithms for extracting the full probability distribution of allele sharing across a chromosome (Kruglyak et al. 1996; Kruglyak and Lander 1998). The implementation is freely available in a new release of the software package GENEHUNTER and can rapidly analyze general pedigrees of moderate size (i.e., up to 16 nonfounding members, on current workstations).
At each chromosome position to be examined, the quantitative trait X is fitted to the following mixed model: X=g+G+ΣiβiKi+e, where g is a random effect due to a major gene linked to the locus being tested, G is a random effect due to other genes at unlinked loci, and e is a residual environmental effect. The βi are fixed effects, including the population mean as well as regression coefficients for the measured covariates Ki. The random effects are assumed to be normally distributed with mean 0 and variances σ2g, σ2G, andσ2e. The genetic variances can be optionally decomposed into additive and dominance effects, with σ2g=σ2ga+σ2gd and σ2G=σ2Ga+σ2Gd. If we assume that g, G, and e are uncorrelated with each other, then the total trait variance is σ2ga+σ2gd+σ2Ga+σ2Gd+σ2e. (The model can also be readily extended to include interactions between effects, as well as multiple trait-affecting loci.)
The trait covariance between any two pedigree members can be expressed as a weighted sum of the variance components:
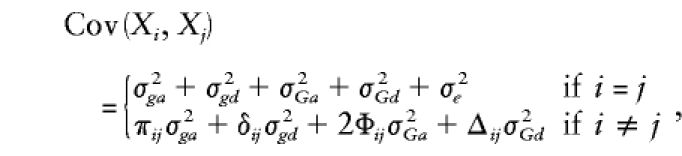 |
where Xi and Xj are the trait values of the ith and jth relatives. Each genetic variance component is weighted by an appropriate measure of genetic similarity: πij is the proportion of alleles at the major locus that are IBD in the ith and jth relatives (on the basis of genotyping data); δij is the probability that both alleles at the locus are IBD (also on the basis of genotyping data); Φij is the kinship coefficient of relatives i and j, with 2Φij giving their coefficient of relationship (i.e., the mean probability that they share alleles IBD, across the entire genome); and Δij is the expected probability that the relatives share both alleles IBD (only on the basis of their degree of relatedness).
If we assume multivariate normality, it is easy to write an expression for the likelihood of the data in terms of these variances and covariances:
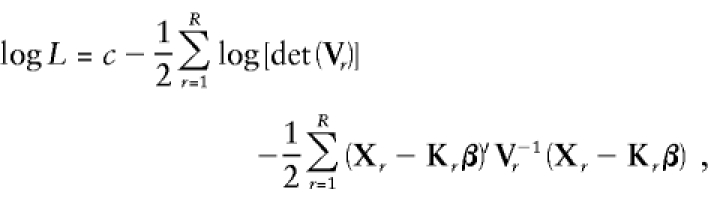 |
where Xr is the vector of individual trait values for the rth pedigree, Vr is the variance-covariance matrix of the rth pedigree, Kr is the matrix of covariates for the rth pedigree, R is the number of pedigrees analyzed, and β is the vector of fixed effects. Parameter values that maximize this likelihood are then found by use of Fisher’s scoring method (Jennrich and Sampson 1976; Lange et al. 1976). In order to avoid meaningless estimates, the variance components are all constrained to have values ⩾0.
This procedure is carried out at any desired number of positions along the mapped chromosome. IBD-sharing probabilities for each position are derived from the exact multipoint algorithms already implemented in GENEHUNTER (Kruglyak et al. 1996; Kruglyak and Lander 1998). Linkage to a particular position is detected by taking the ratio of the maximum likelihood to that of a constrained model in which σ2ga and σ2gd are fixed at 0 (i.e., the null hypothesis of no linkage). In the simplest case, in which only σ2ga is modeled, twice the loge-likelihood ratio has an asymptotic distribution that is a 1/2: 1/2 mixture of a χ21 variable and a point mass at 0 (Self and Liang 1987). The expected distribution of the likelihood ratio when more than one variance component is tested is not well described, but, in general, it continues to be a mixture of χ2 variables (Self and Liang 1987). For models including both additive and dominance components, we have taken a conservative approach and compared the test statistic to a χ22 distribution.
We evaluated the performance of the method on a series of simulated pedigrees with the structure shown in figure 1. Of particular interest were the accuracy of parameter estimates and the power and significance levels, compared with those of sib-pair methods. For each power test, a total of 1000 pedigrees were simulated, and 100 replicates, each consisting of 60 pedigrees, were randomly resampled from this initial set. Marker loci were simulated every 1 cM on a 100-cM chromosome. Each marker had four equally frequent alleles, corresponding to a heterozygosity of .75. A QTL with two equally frequent alleles was located at exactly 50 cM. Trait alleles were randomly assigned to pedigree founders and then were randomly segregated to offspring. Phenotypic values were assigned as follows, on the basis of genotype at the QTL: AA homozygotes received a mean trait value of μ-a, BB homozygotes a mean value of μ+a, and AB heterozygotes a mean value of μ+d. The additive variance attributable to the QTL is given by  , the dominance variance by 4p2q2d2, where p and q are the frequencies of the A and B alleles, respectively. The parameters a and d were chosen to provide a total QTL-based variance of 2.0. In some tests, all of this variance was additive and in others it was equally divided between additive and dominance components. In addition, a deviate was added to each value, to provide for environmental variance. This deviate was taken either from a normal distribution of mean 0 and variance 2.0 or from a Bernoulli distribution in which 10% of individuals received a deviate of 4.24 and 90% a deviate of −0.471. In both cases, the parameters of the distribution were chosen to give a total environmental variance of 2.0. Thus, 50% of the total trait variance was attributable to the QTL.
Figure 1.

Pedigree structure used in the power and significance simulations. Founding members (i.e., those without parents) were assumed to be unavailable for genotyping.
The same pedigree structure was used for significance tests, but markers were generated every 2 cM on each of 23 chromosomes 150 cM in length. This approach evaluated the expected number of false positives in a whole-genome scan with a dense genetic map. In addition, another data set was simulated with only a single marker, to directly test agreement with the nominal false-positive rates. Trait values were assigned in the same manner as for the power tests, except that they were based on a dummy allele unlinked to any of the marker loci. For both power and significance tests, the data were also analyzed by Haseman-Elston regression, by use of an expectation/maximization algorithm (Kruglyak and Lander 1995).
The variance-components method provided consistently greater power than did Haseman-Elston regression (tables 1 and 2 and fig. 2A), with LOD scores higher by a mean factor of two to three. This was especially true at the more stringent nominal significance levels appropriate for whole-genome scans with dense maps (Lander and Kruglyak 1995). This large difference is attributable to the great loss of information imposed by extracting only sib pairs from the pedigrees, compared with analyzing all pedigree relationships simultaneously. Power was not greatly affected by use of a strongly nonnormal Bernoulli distribution to generate the environmental deviate. Whereas the Haseman-Elston method suffered a large drop in power relative to its performance on data with normal residual variance, the variance-components method performed nearly as well as it did on the normal data (table 1).
Table 1.
Parameter Estimates Based on Simulations[Note]
|
Generating Values and Maximum-Likelihood Estimates of Parameters(Mean ± SE) |
||||||
| Test | σ2ga | σ2gd | σ2Ga | σ2e | μ | Location (cM) |
| Additive/additive/normal | ||||||
| Generated | 2.0 | .0 | .0 | 2.0 | 4.0 | 50.0 |
| Estimated | 1.95±.032 | Not modeled | .097±.020 | 1.93±.023 | 3.99±.012 | 50.2±.506 |
| Dominance/additive/normal | ||||||
| Generated | 1.0 | 1.0 | .0 | 2.0 | 4.0 | 50.0 |
| Estimated | 1.39±.035 | Not modeled | .033±.012 | 2.52±.030 | 4.03±.010 | 51.5±.864 |
| Dominance/dominance/normal | ||||||
| Generated | 1.0 | 1.0 | .0 | 2.0 | 4.0 | 50.0 |
| Estimated | .911±.046 | 1.21±.046 | .127±.028 | 1.84±.031 | 4.00±.013 | 50.3±.919 |
| Additive/additive/Bernoulli | ||||||
| Generated | 2.0 | .0 | .0 | 2.0 | 4.0 | 50.0 |
| Estimated | 1.95±.041 | Not modeled | .210±.033 | 1.98±.039 | 4.03±.013 | 47.9±.990 |
Note.— The first part of each model name indicates whether the trait was simulated with a dominance variance component or with purely additive variance. The second part indicates whether the model used to analyze the data included a dominance component or only an additive component. The third part indicates the distribution used for the residual environmental variance. For those simulations without a dominance variance component, the trait means for AA, AB, and BB genotypes at the QTL were 2.0, 4.0, and 6.0, respectively; for those with a dominance component, the means were 1.6, 5.0, and 5.4, respectively.
Table 2.
Power Comparisons Based on Simulations[Note]
|
Power to detect linkage (%) at P = |
|||||
| Test andMethod | .05 | .01 | .001 | .0001 | .00005 |
| Additive/additive/normal | |||||
| VC | 100 | 100 | 96 | 83 | 79 |
| H-E | 97 | 90 | 49 | 22 | 16 |
| Dominance/additive/normal | |||||
| VC | 100 | 90 | 65 | 36 | 28 |
| H-E | 93 | 56 | 21 | 3 | 0 |
| Dominance/dominance/normal | |||||
| VC | 99 | 97 | 85 | 60 | 52 |
| H-E | 99 | 85 | 44 | 18 | 10 |
| Additive/additive/Bernoulli | |||||
| VC | 100 | 99 | 86 | 64 | 61 |
| H-E | 91 | 63 | 18 | 4 | 4 |
Note.— Power was defined as the percentage of 100 data sets in which the appropriate threshold was exceeded. For the Haseman-Elston tests and for the variance-components models without a dominance component, the thresholds used for asymptotic significance levels of .05, .01, .001, .0001, and .00005 were 0.59, 1.17, 2.07, 3.00, and 3.30, respectively. For the variance-components model with a dominance component, the corresponding thresholds were 1.30, 2.00, 3.00, 4.00, and 4.30. The value .00005 is the pointwise significance that corresponds to a genomewide significance of .05. VC = variance components method; H-E = Haseman-Elston regression.
Figure 2.

A, Multipoint LOD score profiles, averaged over 200 simulations. The same data were analyzed with both a 1-cM map (thicker lines) and a 5-cM map (thinner lines) and by both Haseman-Elston regression (dashed lines) and variance-components (solid lines) methods. A QTL accounting for 50% of trait variance is located at 50 cM. The same generating values were used as for the first, purely additive model in table 1. B, Profile of mean variance-component estimates for the same simulations (using the 1-cM map), expressed as a proportion of total variance.
Estimates of the variance components were good but generally showed a small downward bias (table 1 and fig. 2B). This result is similar to earlier findings with a single-marker approach (Amos 1994; Amos et al. 1996) and appears to be due to the incorrect attribution of some variance to polygenic factors. When a trait with dominance variance was analyzed with a model lacking a dominance component, the additive component was inflated by misidentified dominance variance. Location estimates did not differ significantly from the generating values.
False-positive rates for whole-genome scans were consistent with expected values (table 3). In particular, the nominal significance level of .00005, theoretically expected to correspond to a genomewide significance level of .05 (Lander and Kruglyak 1995), was exceeded in 4.7% of the simulated genome scans. In contrast, Haseman-Elston regression gave a more conservative test (table 3). Simulations of tests with a single marker were consistent with these patterns (table 4). In addition, they showed that the variance-components method is conservative when the test statistic is compared with a χ22 distribution, for models that include both additive and dominance variance components for the QTL.
Table 3.
Significance Comparisons Based on Simulations of a Whole-Genome Scan
|
Genomewide False-Positive Rate at Nominal P =a (%) |
|||||
| Method | .05 | .01 | .001 | .0001 | .00005 |
| Variance components | 100.0 | 98.3 | 47.0 | 9.7 | 4.7 |
| Haseman-Elston | 100.0 | 84.3 | 15.7 | 2.7 | .7 |
Percentages are of 300 data sets in which the nominal significance level was exceeded at least once somewhere in the genome. Data sets were generated under the assumption that there is no linked trait–influencing locus at any position. The test statistic was compared with threshold values appropriate for a model without a dominance component, as given in table 1.
Table 4.
Significance Comparisons Based on Simulations of a Single-Locus Test
|
False-Positive Rate at Nominal P =a(%) |
|||
| Method | .05 | .01 | .001 |
| Variance components additive | 5.70 | .97 | .10 |
| Variance components dominance | 1.97 | .50 | .07 |
| Haseman-Elston | 3.60 | .67 | .07 |
Percentages are of 3,000 data sets in which the nominal significance level was exceeded. Data sets were generated under the assumption that there is no linked QTL at the locus being tested. The variance-components method was applied twice to each data set: once with a model including only an additive variance component and once with a model including both additive and dominance components. Test statistics were compared with appropriate threshold values, as given in table 1.
The simulation analyses of Allison et al. (1999) found a similar robustness to the moderate platykurtosis that is expected when a trait is influenced by a single major gene. Their simulations looked only at sib pairs genotyped at a single perfectly informative marker. The present results extend their findings to larger and more-complex pedigrees analyzed with partially informative markers across the entire genome. Although these findings offer encouragement, caution must still be used in dealing with data that violate the assumption of multivariate normality. Other kinds of nonnormality (particularly leptokurtosis and skewness) have been found to yield excessive false positives, especially in the presence of high phenotypic correlations among pedigree members (Allison et al. 1999).
The variance-components method described here has been incorporated into a new version of the computer package GENEHUNTER (version 2.0). The program is freely available at the Whitehead Institute Genome Center Web site. This version also includes all linkage-analysis methods, for quantitative and discrete traits, that were previously released in MAPMAKER/SIBS (Kruglyak and Lander 1995).
Acknowledgments
We thank Mike Boehnke, Richard Watanabe, Jerry Lanchbury, and anonymous referees for helpful feedback. This work was supported in part by grants from the National Human Genome Research Institute and the National Institute of Mental Health. L.K. is a James S. McDonnell Centennial Fellow.
Electronic-Database Information
URLs for data in this article are as follows:
- Whitehead Institute Genome Center, http://www.genome.wi.mit.edu/ftp/distribution/software/genehunter (for GENEHUNTER software)
References
- Allison DB, Neale MC, Zannolli R, Schork NJ, Amos CI, Blangero J (1999) Testing the robustness of the likelihood-ratio test in a variance-component quantitative-trait loci-mapping procedure. Am J Hum Genet 65:531–544 [DOI] [PMC free article] [PubMed]
- Almasy L, Blangero J (1998) Multipoint quantitative-trait linkage analysis in general pedigrees. Am J Hum Genet 62:1198–1211 [DOI] [PMC free article] [PubMed]
- Amos CI (1994) Robust variance-components approach for assessing genetic linkage in pedigrees. Am J Hum Genet 54:535–543 [PMC free article] [PubMed]
- Amos CI, Krushkal J, Thiel TJ, Young A, Zhu DK, Boerwinkle E, de Andrade M (1997) Comparison of model-free linkage mapping strategies for the study of a complex trait. Genet Epidemiol 14:743–748 [DOI] [PubMed]
- Amos CI, Zhu DK, Boerwinkle E (1996) Assessing genetic linkage and association with robust components of variance approaches. Ann Hum Genet 60:143–160 [DOI] [PubMed]
- Goldgar DE (1990) Multipoint analysis of human quantitative genetic variation. Am J Hum Genet 47:957–967 [PMC free article] [PubMed]
- Haseman JK, Elston RC (1972) The investigation of linkage between a quantitative trait and a marker locus. Behav Genet 2:3–19 [DOI] [PubMed]
- Hopper JL, Matthews JD (1982) Extensions to multivariate normal models for pedigree analysis. Ann Hum Genet 46:373–383 [DOI] [PubMed]
- Jennrich RI, Sampson PF (1976) Newton-Raphson and related algorithms for maximum likelihood variance component estimation. Technometrics 18:11–17 [Google Scholar]
- Kruglyak L, Daly MJ, Reeve-Daly MP, Lander ES (1996) Parametric and nonparametric linkage analysis: a unified multipoint approach. Am J Hum Genet 58:1347–1363 [PMC free article] [PubMed]
- Kruglyak L, Lander ES (1995) Complete multipoint sib-pair analysis of qualitative and quantitative traits. Am J Hum Genet 57:439–454 [PMC free article] [PubMed]
- ——— (1998) Faster multipoint linkage analysis using Fourier transforms. J Comput Biol 5:1–7 [DOI] [PubMed]
- Lander ES, Kruglyak L (1995) Genetic dissection of complex traits: guidelines for interpreting and reporting linkage results. Nat Genet 11:241–247 [DOI] [PubMed]
- Lange K, Westlake J, Spence MA (1976) Extensions to pedigree analysis. III. Variance components by the scoring method. Ann Hum Genet 39:485–491 [DOI] [PubMed]
- Pugh EW, Jaquish CE, Sorant AJM, Doetsch JP, Bailey-Wilson JE, Wilson AF (1997) Comparison of sib-pair and variance components methods for genomic screening. Genet Epidemiol 14:867–872 [DOI] [PubMed]
- Schork NJ (1993) Extended multipoint identity-by-descent analysis of human quantitative traits: efficiency, power, and modeling considerations. Am J Hum Genet 53:1306–1319 [PMC free article] [PubMed]
- Self SG, Liang KY (1987) Asymptotic properties of maximum likelihood estimators and likelihood ratio tests under non-standard conditions. J Am Stat Assoc 82:605–610 [Google Scholar]
- Williams JT, Duggirala R, Blangero J (1997) Statistical properties of a variance components method for quantitative trait linkage analysis in nuclear families and extended pedigrees. Genet Epidemiol 14:1065–1070 [DOI] [PubMed]