

Abstract
The identification of genes contributing to complex diseases and quantitative traits requires genetic data of high fidelity, because undetected errors and mutations can profoundly affect linkage information. The recent emphasis on the use of the sibling-pair design eliminates or decreases the likelihood of detection of genotyping errors and marker mutations through apparent Mendelian incompatibilities or close double recombinants. In this article, we describe a hidden Markov method for detecting genotyping errors and mutations in multilocus linkage data. Specifically, we calculate the posterior probability of genotyping error or mutation for each sibling-pair-marker combination, conditional on all marker data and an assumed genotype-error rate. The method is designed for use with sibling-pair data when parental genotypes are unavailable. Through Monte Carlo simulation, we explore the effects of map density, marker-allele frequencies, marker position, and genotype-error rate on the accuracy of our error-detection method. In addition, we examine the impact of genotyping errors and error detection and correction on multipoint linkage information. We illustrate that even moderate error rates can result in substantial loss of linkage information, given efforts to fine-map a putative disease locus. Although simulations suggest that our method detects ⩽50% of genotyping errors, it generally flags those errors that have the largest impact on linkage results. For high-resolution genetic maps, removal of the errors identified by our method restores most or nearly all the lost linkage information and can be accomplished without generating false evidence for linkage by removing incorrectly identified errors.
Introduction
Sibling-pair designs are routinely used to map genes for complex diseases and quantitative traits (see, e.g., Kruglyak and Lander 1995; Risch and Zhang 1995). The current analytic strategy often consists of an initial genome scan based on microsatellite markers or short tandem repeat polymorphisms (STRPs) at 10–20-cM density, followed by the investigation of interesting regions with additional markers at 1–5-cM density. Because such studies frequently require the determination of hundreds of thousands, or even millions, of genotypes, genotyping errors and marker mutations are inevitable. This problem is particularly troublesome for sibling-pair data, where the chance of detecting errors and mutations through gross violations of Mendelian inheritance or the presence of close double recombinants is reduced, relative to that in richer pedigree structures.
Genotyping errors occur when the observed genotype does not correspond to the true underlying genotype because of laboratory error or incorrect data interpretation or entry. In general, the spectrum of genotyping errors depends on the type of marker and method of analysis but for STRPs might include the reading of a heterozygote as a homozygote or the missizing of either allele by a single repeat unit. Marker mutations, which are relatively frequent for STRPs (Weber and Wong 1993), can mimic genotyping errors. Both errors and mutations can have the unfortunate consequence of introducing spurious recombinants or negating true recombinants. In high-resolution multipoint maps, where markers are close together and recombination is rare, errors and mutations are much more likely to appear as apparent but false double recombinants (Buetow 1991). Such high-resolution maps are often employed in regions of greatest interest.
Methods of linkage analysis based on the sibling-pair design generally examine the genome for regions of excess (or decreased) marker allele sharing, either identical by descent (IBD) or identical by state (IBS), between affected (or discordant) sibling pairs. Undetected genotyping errors and marker mutations often lead to a reduced level of allele sharing IBS and, consequently, to a reduced estimated level of allele sharing IBD between sibling pairs. For affected sibling-pair (ASP) designs, the net effect is to diminish evidence for linkage. Moreover, as additional markers are typed in regions of potential linkage, genotyping errors and marker mutations may decrease or even reverse the expected gain in linkage information (Feakes et al. 1999). For discordant sibling-pair designs, undetected errors and mutations may lead to false evidence for linkage or may simply add noise to existing linkage signals. Methods of error and mutation detection thus have potential to be useful tools in evaluating evidence for linkage in sibling-pair studies.
For sibling-pair data, comparison of single-point and multipoint results and repeat multipoint analyses dropping individual markers allow some assessment of data quality. In practice, however, these approaches identify problem markers, not problem genotypes. Much of the literature to date regarding genotyping error and mutation focuses on the detection of conspicuous inheritance inconsistencies (Lathrop et al. 1983; Ott 1993; Stringham and Boehnke 1996; O’Connell and Weeks 1998). Most methods require nuclear-family or extended-pedigree data (Brzustowicz et al. 1993; Ehm and Kimmel 1995; Ehm et al. 1996) for successful implementation. With the exception of a new error-checking module implemented in ASPEX 2.2, few of these methods capitalize on multipoint data. Thus, there is a clear need for a multipoint method of error and mutation detection in sibling-pair genotype data.
In this article, we propose a method to identify likely genotyping errors and marker mutations for a sibling pair in the context of multipoint mapping (Douglas et al. 1998). Specifically, we use a hidden Markov model to calculate the posterior probability of genotyping error or mutation for each sibling-pair-marker combination, given all the available marker data, an assumed genotype-error rate, and a known genetic map. This method is designed to detect genotyping errors and mutations in sibling-pair data when parental data are unavailable. Through Monte Carlo simulation, we investigate the effects of map density, marker-allele frequencies, marker position, and genotype-error rate on the accuracy of our method. We also examine the impact of genotyping errors and error correction on linkage information in multipoint mapping. We demonstrate that, although our method flags fewer than half of the genotyping errors and mutations, it flags exactly those errors that have the largest impact on multipoint linkage results. The result is substantial recovery of linkage information that otherwise would be lost. Moreover, so long as we select a small false-positive rate (on the order of .001–.0001), our method does not generate false evidence for linkage by removing incorrectly identified errors.
Methods
Here we calculate the posterior probability of genotyping error or mutation for each sibling-pair-marker combination, conditional on all marker data and an assumed genotype-error model and rate. The subset of combinations for which this posterior error probability is high may be considered for exclusion, review, or retyping.
Data, Notation, and Assumptions
Assume that genotype data are observed for a sibling pair across a fixed map of M genetic markers. At marker k for sibling j, let xkj be the observed genotype and gkj be the true genotype if no mutation occurred. Let Xk=(xk1,xk2) and Gk=(gk1,gk2) be the observed and true genotype vectors for the sibling pair at marker k and  be the observed genotype data for all M markers. Let ikp=1 if the pair share their allele at marker k from parent p (father or mother) IBD and 0 otherwise. Let Ik=(ikf,ikm) and θkp be the sex-specific recombination fraction between markers k and k+1. Assume that the markers are autosomal, codominant, and linked, with known allele frequencies, map order, and intermarker distances. Further, assume Hardy-Weinberg and linkage equilibrium and no crossover interference.
To model genotyping error, we assume that xkj=gkj (with certainty and not at random) with probability 1-e and that xkj is chosen at random in accord with population genotype frequencies with probability e. Although this model is not very realistic in practice, it simplifies the calculation of the posterior error probability. More important, the success of our method under this relatively simple error model suggests that the incorporation of more complex error models is unnecessary. Here the assumed genotype-error rate e can be set to some fixed positive number or might be estimated by duplicate-genotyping a subset of the data. Note that, for most markers, the rate of genotyping error largely determines e; the rate of mutation is relatively insignificant by comparison.
Posterior Probability of Incorrect Genotype
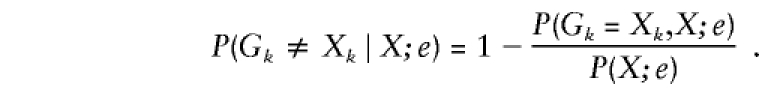
For each marker k, we calculate the posterior probability  that the observed marker genotype of at least one sibling is incorrect, given all marker data for the sibling pair. Here and in what follows, by “incorrect” we mean different from the true, underlying genotype if no mutation occurred. To calculate this probability, we write
 |
By the assumption of no interference,
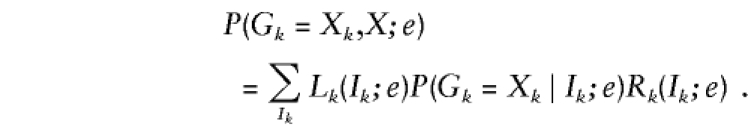 |
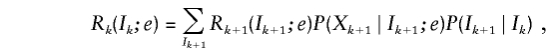
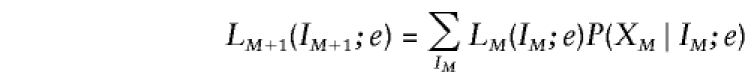
Here Lk(Ik;e)=P(X1,…,Xk-1,Ik;e) is the joint probability of the data for markers 1 to k-1 and the IBD vector Ik at marker k, and Rk(Ik;e)=P(Xk+1,…,XM∣Ik;e) is the conditional probability of the data for markers k+1 to M given the IBD vector Ik.
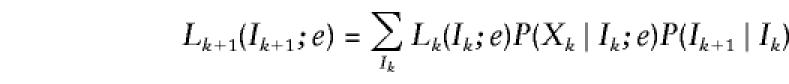
Under the assumption of no interference, the unknown IBD vectors I1,…,IM form a hidden Markov chain. Hence,  and
and  are easily determined by the forward recurrence
 |
and the backward recurrence
 |
following Baum (1972). By definition, L1(Ii;e)= 1/4, because all four IBD vectors are, a priori, equally likely, and by convention, RM(IM;e)=1. Note that the final summation
 |
yields P(X;e). Furthermore, allowing for sex-specific recombination fractions,
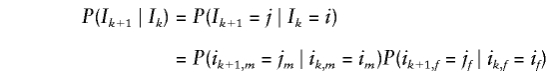 |
is the probability of moving from IBD vector  at marker k to IBD vector
  at marker k+1. For example, for full siblings, P(ik+1,p=jp∣ikp=ip)=(1-Ψkp)∣jp-ip∣Ψ1-∣jp-ip∣kp, where Ψkp=θ2kp+(1-θkp)2.
According to our error model, genotyping errors and mutations result in siblings with independent observed genotypes, Xk1 and Xk2. Hence,
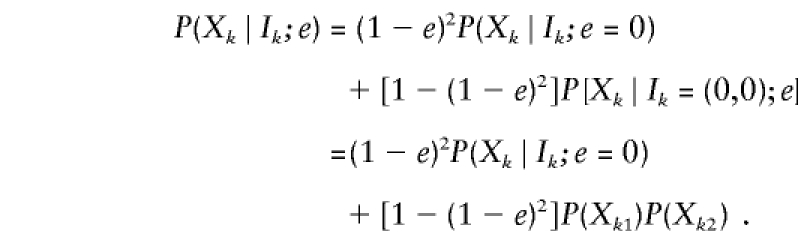 |
Here, under the assumption of Hardy-Weinberg equilibrium,  can be easily calculated from marker-allele frequencies. Moreover, each sibling’s genotype is correct for certain with probability (1-e) or randomly chosen with probability e. The genotype of sibling j is correct at random with probability
  so that
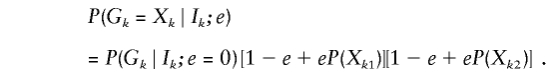 |
The derivation of this formula depends on the independence of Xk1 and Xk2 when either is resampled. Of course, the genotypes Gk1 and Gk2 are constrained by the assumed IBD relation. The conditional probability of the observed or true genotypes at marker k given the IBD vector of the pair and no error or mutation, P(Xk∣Ik;e=0) or P(Gk∣Ik;e=0), is easily calculated from marker-allele frequencies (Thompson 1975) (table 1).
Table 1.
Conditional Probabilities for Sibling-Pair Ordered Genotypes [Note]
| Genotype | P(Xk∣Ik;e=0) | |||
| X1 | X2 | Ik=(0,0) | Ik=(0,1) or (1,0) | Ik=(1,1) |
| ii | ii | p4i | p3i | p2i |
| Ii | ij | 2p3ipi | p2ipj | 0 |
| ii | jj | p2ip2j | 0 | 0 |
| ii | jk | 2p2ipjpk | 0 | 0 |
| ij | ij | 4p2ip2j | pipj(pi+pj) | 2pipj |
| ij | ik | 4p2ipjpk | pipjpk | 0 |
| ij | kl | 4pipjpkpl | 0 | 0 |
Note.— X1 and X2 are the observed genotypes for the sibling pair at a single genetic marker; i, j, k, and l are distinct alleles with frequencies pi, pj, pk, and pl.
Classifying Likely Errors and Mutations
A high posterior error probability is indicative of a likely genotyping error or mutation. Thus, the natural decision is to remove, rescore, and/or retype a pair of genotypes at a marker when the posterior error probability P(Gk≠Xk∣X;e) is above a certain cutoff constant, c. Calculating the cutoff constant c can be accomplished in the usual decision-analysis framework. Specifically, we choose c to be as small as possible in order to maximize the true-positive rate—that is, the frequency with which errors are detected when they are present—while at the same time guarding against a high false-positive rate—that is, the frequency with which errors are detected when none are present. In the formal statistical setting, this is the equivalent of choosing c to minimize the type II error rate—that is, the frequency with which errors are not detected when they are present—while simultaneously guarding against a high type I error rate (table 2).
Table 2.
Classification of the Posterior Error Probability
| Marker k Status |
 a a
|
 a a
|
| Error | True positive | False negative (type II error) |
| No error | False positive (type I error) | True negative |
c is the cutoff constant determined by the prescribed type I error rate.
We initially proposed to calculate the posterior error probability for each sibling-pair-marker combination, rank them in order of decreasing magnitude, and classify as likely genotyping errors and mutations combinations with posterior error probabilities exceeding the cutoff constant c (Douglas et al. 1998). Preliminary simulation work, however, demonstrated that the cutoff constant c for the posterior error probability depends strongly on the map density and the assumed genotype-error rate and, to a lesser extent, on the position of the marker and its allele frequencies. Thus, applying a fixed cutoff constant c is inappropriate as a general strategy. Instead, c should depend on the marker k in question in addition to the overall map and prior error rate.
On the basis of this observation, we have chosen to use Monte Carlo simulation to determine the appropriate cutoff constant, ck, for each marker k. Specifically, we simulate marker data for a large number of sibling pairs for the observed marker map. We simulate no error at marker k, but at all other markers we simulate random genotype error with probability e. We then calculate the posterior error probability at marker k for each replicate sibling pair. The resulting posterior error probabilities form an empirical distribution for marker k under the null hypothesis of no genotyping error or mutation for either sibling at marker k. From the empirical distribution, the cutoff constant, ck, is determined by use of the prescribed size of the test (or false-positive rate). We repeat this process for each marker k. Genotypes with observed posterior error probabilities exceeding ck are classified as likely genotyping errors or marker mutations. We choose a small false-positive rate (⩽.001) to keep the overall false-positive rate low and so to avoid falsely generating evidence for linkage by removing correct genotypes.
Assessment of Method by Computer Simulation
To evaluate the true-positive rate of our method as function of map density, marker-allele frequencies, marker position, and assumed genotype-error model and rate, we performed computer simulations. For each simulation, we assumed a 100-cM autosome with codominant markers equally spaced at 1-, 2-, 3-, 5-, or 10-cM intervals. Anticipating that genome scans might soon be performed with dense arrays of biallelic markers or single-nucleotide polymorphisms (SNPs), we also performed a limited number of simulations with 100 biallelic markers equally spaced at 0.1- or 0.01-cM intervals. We applied Kosambi’s (1944) mapping function to relate map distance and recombination fraction. For all simulations, we used a sex-averaged recombination fraction and assumed both Hardy-Weinberg and linkage equilibrium. In most cases, we simulated markers with four equally frequent alleles (heterozygosity H=.75). To examine the impact of marker-allele frequencies on our ability to detect errors, we also considered markers with heterozygosity of H≈.75 but seven (.40, .20, .20, .05, .05, .05, and .05) or eight (.32, .30, .20, .10, .05, .02, .005, and .005) alleles, as well as markers with 2 (H=.50) or 10 (H=.90) equally frequent alleles. For SNP simulations, we simulated markers with two equally frequent alleles (H=.50) or nonequally frequent alleles (.90, .10; H=.18). We simulated genotyping errors using error rates of 0.1%–3%. These error rates are consistent with estimated mutation rates of 0–8×10⁻³ for STRPs (Weber and Wong 1993) and the levels of genotyping error commonly reported for linkage data (Lathrop et al. 1983; Buetow 1991; Dracopoli et al. 1991; Brzustowicz et al. 1993; Ghosh et al. 1997).
To estimate the false-positive rate—that is, the frequency with which our method suggested an error when none was present—we generated marker data for 100,000 sibling pairs with no genotyping error at marker k and random error at all other markers. We calculated posterior error probabilities for each replicate at marker k and used them to construct the empirical distribution. On the basis of these simulated data, we noted the posterior error probability or equivalently, the cutoff constant ck that yielded false-positive rates of .0001, .0005, .001, .005, and .01. To estimate the true-positive rate, we then generated marker data for 10,000 sibling pairs with genotyping error at marker k for at least one member of the pair, again introducing random error at all other markers. The errors were introduced by one of the four mechanisms described below. Again, we calculated posterior error probabilities for each replicate sibling pair. We estimated the true-positive rate corresponding to each false-positive rate by computing the fraction of those genotyping errors with posterior error probabilities exceeding the appropriate cutoff constant ck determined under the assumption of no error. We generally estimated the true-positive and false-positive rates for a marker k at either the middle of the map or at the end of the map. In a subset of our simulations, we considered several intermediate positions. Also note that we used the same prior genotype-error rate for error detection as we used to simulate our data. To examine the impact of under- or overestimation of the genotype-error rate e, we simulated a few data sets under different rates.
To test the accuracy of our error-detection method, we simulated four different genotyping error and mutation mechanisms: (i) random genotype error, (ii) random allele error, (iii) heterozygote-to-homozygote genotype error, and (iv) homozygote-to-heterozygote genotype error. Under random genotype error, new genotypes were assigned at random in accord with marker-allele frequencies and Hardy-Weinberg equilibrium; this is the error model that we use in our error-detection method. Under random allele error, one allele in a genotype was randomly reassigned to another allele in accord with marker allele frequencies. For heterozygote-to-homozygote genotype error, the error was introduced by randomly replacing one of the alleles present in the heterozygous genotype by the other allele. In practice, PCR amplification failure might account for errors of this kind. For homozyote-to-heterozygote genotype error, homozygous genotypes were randomly replaced by adjacent-allele heterozygous genotypes. These types of errors might arise from the presence of stutter bands after PCR amplification.
Application to Simulated Linkage Data
To examine the impact of genotyping errors and mutations on the results of multipoint linkage analyses and to assess the value of our method for correction of those errors, we simulated marker data under an additive disease model (Risch 1990) for samples of 400 sibling pairs. We generated data assuming a recurrence-risk ratio of λ=1, 1.25, 2, or 4. In each simulation, the disease locus was centered between two markers at the middle of the map. For these simulations, we assumed a 100-cM autosome with codominant markers equally spaced at 1-, 2-, 5-, or 10-cM intervals and introduced genotyping errors across the map according to either the random genotype- or random allele-error mechanism. For each simulation, we generated and separately analyzed the sample without errors, the sample with errors, and the sample with likely errors removed. We remaximized the LOD score, allowing the maximization position to vary in each case. Note that we removed genotypes at marker k when the posterior error probability  for a sibling pair exceeded the cutoff constant ck; genotypes for the pair at all other markers were kept in the analysis.
Results
Posterior Error Probability
Table 3 illustrates the strong dependence of the estimated posterior error probabilities on the prior genotype-error rate e. As expected, higher prior-error rates require correspondingly higher posterior error cutoffs to maintain a fixed false-positive rate. For example, at 1-cM marker spacing and a false-positive rate of .001, likely errors and mutations are identified by choosing posterior error probabilities exceeding .110 or .582, depending on the prior error rate e, 0.1% or 1.0%, respectively. More important, the prior -error rate e does not noticeably alter the true-positive rate (data not shown).
Table 3.
Posterior Error–Rate Cutoffs for Fixed False-Positive Rates [Note]
|
Prior Error Rate e |
|||||
| Marker Spacing and False-Positive Rate | .1% | .5% | 1% | 2% | 3% |
| l cM: | |||||
| .0001 | .409 | .856 | .893 | .965 | .955 |
| .0005 | .207 | .627 | .763 | .885 | .899 |
| .001 | .110 | .438 | .582 | .767 | .789 |
| 2 cM: | |||||
| .0001 | .255 | .631 | .801 | .874 | .912 |
| .0005 | .157 | .463 | .658 | .777 | .840 |
| .001 | .115 | .396 | .539 | .694 | .765 |
| 3 cM: | |||||
| .0001 | .161 | .522 | .731 | .882 | .886 |
| .0005 | .128 | .418 | .589 | .750 | .785 |
| .001 | .075 | .309 | .486 | .663 | .702 |
Note.—Assume a 100-cM map and markers with four equally frequent alleles. Data for 100,000 sibling pairs were simulated without genotype error or mutation at the marker in the middle of the map; random genotype errors were introduced for all other markers with probability equal to the analysis error rate e.
Note that the estimated posterior error cutoffs also vary substantially according to the map density and, naturally, the desired false-positive rate (table 3). In general, dense maps require larger posterior error probabilities than do less dense maps. Though the posterior error probabilities vary predictably in direction according to the false-positive rate, the magnitude of change is strongly influenced by the desired false-positive rate. For example, at 1-cM marker spacing and prior error rate e=.005, flagging sibling-pair-marker combinations with posterior error probabilities >.856 will give an estimated false-positive rate of .0001, whereas flagging those combinations with probabilities >.438 will give an estimated false-positive rate of .001. The posterior error probabilities are also a function of marker position; this is particularly true for markers at the ends of the map (data not shown). These results reinforce the inappropriateness of applying a common posterior error cutoff when classifying likely errors and mutations.
Accuracy of Error Detection
For the cases considered, simulation results suggest that our method detects only 5%–50% of genotyping errors, depending on map density, marker position, marker-allele frequencies, the desired false-positive rate, and the true underlying error mechanism. Figure 1 illustrates the effect of map density on correctly detecting a genotyping error for a given false-positive rate, assuming a genotype-error rate e=.01 and markers with four equally frequent alleles. In this case, random genotype errors were introduced at the same rate of .01. Not surprisingly, the true-positive rate increases as the distance between adjacent markers decreases. For the true genotyping error rates considered, our method detects approximately twice as many errors in a 1-cM map than in a 5-cM map, depending on the false-positive rate. At lower levels of map resolution—for example, at 10-cM marker spacing—our method detected a maximum of 15% of errors for false-positive rates <.01 (data not shown).
Figure 1.

True-positive rate versus false-positive rate, assuming a genotype-error rate of .01, markers with four equally frequent alleles, and a 100-cM map with markers equally spaced at 1-, 2-, 3-, or 5-cM intervals. True-positive rates were based on introduction of random genotype error for at least one member of the sibling pair at the marker in the middle of the map.
Increasing marker heterozygosity by simulating markers (equally spaced at 1-cM intervals) with 10 equally frequent alleles consistently gave true-positive rates >50% for false-positive rates of .001–.01 (data not shown). Decreasing marker heterozygosity by simulating markers (again equally spaced at 1-cM intervals) with two equally frequent alleles gave true-positive rates of 20%–32% for these same false-positive rates. Fixing marker heterozygosity at 0.75 and varying the allele frequencies to allow the inclusion of rare alleles had no appreciable impact on the true-positive rate (data not shown).
In simulations for biallelic markers, our method detected 34%–37% and 24%–33% of genotyping errors for markers equally spaced at 0.1-cM intervals with equally frequent and nonequally frequent (.90, .10) alleles, respectively. These true-positive rates correspond to false-positive rates of .0001–.01. Increasing map density to 0.01-cM marker spacing had negligible impact on true-positive rates. In general, our method detected ⩽40% of genotyping errors for false-positive rates <.01.
Figure 2 displays the impact of marker position within the map on the true-positive rate, on the assumption of a 1% genotype-error rate and a fixed false-positive rate of .001. As anticipated, error detection is less accurate for markers near the ends of the map. Markers 5–10 cM from the end of the map, however, depending on map density (1–5 cM), display true-positive rates nearly equivalent to those of markers in the middle of the map. In fact, for the map densities shown, true-positive rates for markers at the middle of the map are ⩽1.06 times the rates for markers 5–10 cM from the end of the map. Note that these estimates of the true-positive rates are based on simulating marker data for a single set of 10,000 sibling pairs, so an estimate of the sampling variability was not pursued.
Figure 2.

True-positive rate as a function of marker distance from the end of the map, on the assumption of a true genotype-error rate of .01, markers with four equally frequent alleles, and a 100-cM map with markers equally spaced at 1-, 2-, 3-, or 5-cM intervals. True-positive rates were based on introduction of random genotype error for at least one member of the sibling pair at the positioned marker. The false-positive rate was fixed at .001.
Table 4 gives the true-positive rates under all four genotype error and mutation mechanisms. The power of our method to detect errors and mutations is similar for random genotype error and heterozygous-to-homozygous error, except at the smallest false-positive rate of .0001. The power to detect errors is somewhat less for random allele error and noticeably less for homozygous-to-heterozygous error. Such differences in true-positive rates can be explained and quantified in terms of the expected reductions in allele sharing between siblings resulting from these different error mechanisms (J. A. Douglas and M. Boehnke, unpublished data).
Table 4.
True-Positive Rate under Four Genotype Error and Mutation Mechanisms [Note]
|
True-Positive Rate |
||||
| False-PositiveRate | RandomGenotypea | RandomAlleleb | Het→Homc | Hom→Hetd |
| .0001 | .160 | .064 | .012 | .001 |
| .0005 | .264 | .206 | .244 | .166 |
| .001 | .326 | .251 | .310 | .188 |
| .005 | .400 | .317 | .387 | .223 |
| .01 | .419 | .338 | .411 | .232 |
Note.—Assume markers with four equally-frequent alleles equally spaced at 1-cM intervals in a 100-cM map. True-positive rates were estimated by simulating marker data for 10,000 sibling pairs and by introducing genotype error for at least one member of the sibling pair at the marker in the middle of the map according to the specified error mechanism. Under the same error mechanism, additional genotype errors were introduced for all other markers with probability equal to the analysis error rate e=.01.
Random genotype error.
Random allele error.
Heterozygous genotype changed to incorrect homozygous genotype.
Homozygous genotype changed to incorrect heterozygous genotype.
Impact of Errors and Error Detection on Linkage Information
The presence of genotyping errors and mutations can substantially reduce power to detect a disease locus by multipoint linkage analysis and sibling-pair data. Table 5 gives the proportion of the maximum LOD score retained for recurrence risk ratios of 1.25, 2, and 4 in the presence of genotyping error. Even a moderate genotype-error rate of 1% can result in the loss of 21%–58% of the linkage information for the situations considered. These data were generated under random genotype error. Introducing random allele error results in a similar loss of information; 8%–38% and 19%–60% of linkage information is lost for error rates of 1% and 2%, respectively.
Table 5.
Impact of Error and Error Detection on Proportion of Maximum LOD Score Retained and Restored [Note]
|
Recurrence-Risk Ratio |
||||||
|
λ=1.25 |
λ=2 |
λ=4 |
||||
| Marker Spacing and Error Rate | Before | After | Before | After | Before | After |
| 1 cM: | ||||||
| .5% | .72 | .98 | .86 | .98 | .89 | .98 |
| 1.0% | .47 | .89 | .73 | .95 | .79 | .96 |
| Expected LODa | 2.17 | 11.06 | 24.91 | |||
| 2 cM: | ||||||
| .5% | .72 | .90 | .84 | .93 | .89 | .95 |
| 1.0% | .42 | .70 | .72 | .86 | .78 | .88 |
| Expected LODa | 2.13 | 10.46 | 23.56 | |||
| 5 cM: | ||||||
| .5% | .70 | .87 | .86 | .93 | .90 | .95 |
| 1.0% | .47 | .71 | .73 | .83 | .79 | .87 |
| Expected LODa | 1.77 | 9.22 | 21.25 | |||
| 10 cM: | ||||||
| .5% | .72 | .84 | .85 | .90 | .90 | .93 |
| 1.0% | .47 | .62 | .71 | .79 | .77 | .85 |
| Expected LODa | 1.42 | 7.69 | 16.70 | |||
Note.—Data were simulated for 400 sibling pairs under an additive model with the disease locus centered between markers at the middle of a 100-cM map. Markers are equally spaced with four equally frequent alleles. Random genotype errors were introduced for all markers with probability equal to the analysis error rate e. Estimates are based on 1,000 replicate data sets each. The results after error detection are based on removal of sibling-marker combinations with high posterior error probabilities (i.e. P(Gk≠Xk∣X;e)>ck, where ck is the cutoff value corresponding to a false-positive rate of .001).
LOD score expected in the absence of genotype error.
Figure 3 shows the impact of a 1% genotype-error rate, error identification, and data removal on results for simulated linkage data. We generated a single replicate data set of 400 affected sibling pairs, assuming a recurrence-risk ratio of λ=1.25. In this sample, the simulation introduced 709 marker-typing errors. Under the assumption of a false-positive rate of .001, our method flagged 269 sibling-pair-marker combinations; of these, 233 (87%) were errors. Perhaps the most striking result is that removing <40% of the errors restores essentially all of the linkage information. The maximum LOD score increases from 1.34, in the presence of errors, to 2.69 after removing the 269 likely errors, whereas the true maximum LOD score is 2.61. More important, excluding only the 233 errors yields a maximum LOD score of 2.49, so the inflation in linkage information as a result of removing the 36 correct genotypes is trivial. Additional replicate data sets under both the same and different recurrence risk ratios (λ=2 or 4) gave qualitatively similar results.
Figure 3.

Impact of genotyping errors and error detection on linkage information, as measured by maximum LOD score. Linkage data were simulated for 400 sibling pairs on the assumption of a recurrence-risk ratio λ=1.25. Results shown are based on a 100-cM map, markers with four equally frequent alleles equally spaced at 1-cM intervals, and a disease locus placed at 50.5 cM. Random genotype errors were introduced in each sibling at each marker with probability equal to the genotype-error rate of 1%. Error removal (— —) gives linkage results after removing sibling-pair-marker combinations with high posterior error probabilities, on the assumption of a false-positive rate of .001.
The 36 (13%) sibling-pair-marker combinations incorrectly flagged by our method in this example are consistent with using a fixed false-positive rate of .001 for each of 100 markers; on average, we would expect to flag falsely .001×100×400=40 sibling-pair-marker combinations from 400 sib pairs. Haplotype analysis of these 36 sibling pairs indicates that 5 involve close (<5-cM) double recombinants. The remaining 31 involve two or more crossovers on the same haplotype. Of course, our data were generated in the absence of interference. In practice, we are likely to encounter some level of positive interference, so our reported false-positive rates may actually be overestimates.
Table 5 illustrates the impact of our method on the restoration of linkage information, after removing the subset of likely errors, for a range of map densities. Not unexpectedly, a larger fraction of the lost linkage information is restored at higher map densities. For example, for a recurrence risk ratio of 1.25 and prior genotype-error rate of 1%, our method restores the maximum LOD score to 89% of its true value at 1-cM map density versus 71% of its true value at 5-cM map density. As a fraction of lost linkage information, these values represent information recovery of 79% versus 45%. Note that the results after error detection in table 5 are based on a false-positive rate of .001, which corresponds to a true-positive rate of at most 33% (the approximate upper bound for 1-cM map density). At 1-cM map density and prior error rate e=.01 or .005, ∼90% or more of the true maximum LOD score is restored (regardless of genetic effect). Remarkably, nearly all of the lost linkage information can be recovered in spite of removing only 33% of errors.
Table 6 illustrates the effect of removing data for sibling-pair-marker combinations on the maximum LOD score in the absence of linkage (λ=1). For the map densities and error rates considered and a small false-positive rate (.001), removing the subset of likely errors does not, on average, increase the true maximum LOD score—that is, the value that would have been determined in the absence of errors or mutations. In fact, the average maximum LOD score after removing likely errors is always less than the true-average maximum LOD score. Note that, among a total of 8,000 replicate data sets, the maximum increase in LOD score was ⩽.405. Moreover, the increase in maximum LOD score was <0.193 in 99.9% of all replicates.
Table 6.
Impact of Removing Likely Errors in the Absence of Linkage (λ=1) [Note]
| Marker Spacing and Error Rate | Mean Increase in LOD Scorea (SD) | Maximum Increase in LOD Score |
| 1 cM: | ||
| 0.5% | −.027 (.093) | .405 |
| 1.0% | −.111 (.109) | .361 |
| 2 cM: | ||
| 0.5% | −.086 (.093) | .068 |
| 1.0% | −.227 (.181) | .000 |
| 5 cM: | ||
| 0.5% | −.090 (.098) | .218 |
| 1.0% | −.152 (.150) | .064 |
| 10 cM: | ||
| 0.5% | −.090 (.121) | .155 |
| 1.0% | −.232 (.160) | .037 |
Note.—Estimates are based on 1,000 replicate data sets of 400 sibling pairs.
Difference between maximum LOD score with subset of likely errors removed and without error.
Discussion
Even the most rigorous quality-control measures cannot be expected to eliminate errors in genotype data, and they certainly will not eliminate marker mutations. Increasing genetic map resolution and sample size combined with the widespread use of sibling-pair data demand appropriate methods for the detection of genotyping error and mutation. The advantages of detecting genotyping error and mutation under even modest error rates are demonstrated by the results of our simulated linkage data.
The value of our method of error detection is directly related to map density; it is most advantageous for dense maps such as those used to examine regions identified as interesting in initial genome scans. For example, consider a region of interest with 20 markers spaced at ∼1-cM intervals. Typing 400 sib pairs in this region requires determination of 16,000 genotypes. A combined error and mutation rate of 1% would result in ∼160 problem genotypes. Using our error-detection method and a false-positive rate of .001 would be expected to require reinspection of 53 sibling-pair-marker combinations. Of these, ∼44 would be the result of true genotyping errors or mutations. If λ=1.25, identifying these errors would be expected to recover ∼72% of the lost linkage information. This corresponds to a maximum LOD score of 0.81 (with the errors), 1.51 (with a subset of errors removed), and 1.78 if no errors are present.
In our simulations, we have removed data for sibling-pair-marker combinations with unusually high posterior error probabilities. Of course, removal of true recombinant genotypes can increase evidence for linkage, as seen in figure 3. In fact, relaxing the false-positive rate can substantially increase the maximum LOD score even in the absence of linkage. For example, imposing a false-positive rate as large as .01 and removing flagged genotypes increases the maximum LOD score by an average of one unit in additional simulations, on the assumption of a sample of 400 sibling pairs, λ=1, 1-cM marker spacing, and a 1% genotype-error rate. This is not surprising, because several thousand correct and likely true recombinant genotypes are removed. For this reason, we strongly discourage the application of increasing false-positive rates as a means of maximizing linkage information.
In practice, investigators might consider rescoring and/or retyping the identified subset of likely errors and mutations, depending on such factors as time, cost, and potential benefit. Where these investigations are not practical, it is important to emphasize that the increases in linkage information as a result of removing a subset of sibling-pair marker combinations are likely to be minimal for small false-positive rates such as .0001 or .001. Moreover, as can be seen in table 6, removing the subset of likely errors or mutations in the absence of linkage is unlikely to produce evidence for linkage when it is not present, subject again to small false-positive rates (on the order of .001–.0001). We suggest use of larger false-positive rates only if rescoring or retyping will be carried out. Even then, the advantage of more complete error detection must be balanced against the additional effort required to rescore and possibly retype a much larger subset of potential errors and mutations. At minimum, researchers can confidently exclude genotypes for which the posterior error probabilities are extremely high, for example, >.90. Posterior error probabilities for correct genotypes rarely, if ever, exceeded a value of .90 under any simulation condition we considered.
Our simulation results suggest that our method detects 10%–35% of genotyping errors for dense maps (1–3 cM) of markers with marker heterozygosity H=.75 and acceptable false-positive rates (.0001–.001). It is clear that these low detection rates are partially constrained by the need to maintain a small false-positive rate. They also, however, reflect the lack of information in sibling-pair genotype data. For example, examination of the 709 errors introduced into the simulated linkage data displayed in figure 3 revealed that 47% of the undetected errors produced no change in IBS sharing between the sibling pair at the marker of interest. In contrast, 100% of detected errors produced either 1 or 2 allele decreases in IBS sharing. Analyses of other simulated data sets revealed a similar pattern. The relationship between change in IBS sharing and error detection explains why our method flags exactly those errors that have the largest impact on linkage results: the easiest errors to detect are typically those that have the largest impact on linkage information.
We have used Monte Carlo simulation to determine marker-specific cutoff constants to identify unusually high posterior error probabilities. We have made this choice for two reasons. First, our simulations confirmed that the empirical distributions of the posterior error probabilities are a function of map density, prior error rate, marker position, and marker allele frequencies, parameters which will vary from one data set to the next. Second, Monte Carlo simulation has the advantage of being completely specific to the data at hand, thereby providing a mechanism for controlling the false-positive rate, and is both quick and simple to implement with sibling-pair data.
Our rather simple error model (as a first approximation) was generally robust to the underlying error-generating mechanism. Our ability to detect heterozygous-to-homozygous errors was closest to that for random genotype error. Random allele errors were somewhat more difficult to detect, whereas homozygotes being mistaken as adjacent-allele heterozygotes were noticeably more difficult to detect. Still, the recovery of lost linkage information by our method of error detection is comparable across these error mechanisms. Further, the differences in detection rates can largely be explained by the reduction in IBS allele sharing resulting from these different mechanisms. In fact, analytical calculation reveals that the reduction in IBS allele sharing is greatest under random genotype error and least under homozygous-to-heterozygous error. Additional information regarding the nature of possible errors for specific markers might suggest the incorporation of more complex error models. Given the success of our method in recovering linkage information lost to genotyping error, we have not pursued this further.
In the simulations we reported, we assumed that markers were equally spaced and of known order and that the genotype-error rate was correctly specified. Additional simulations with unequal marker spacing (data not shown) and analysis of type 2 diabetes data from the FUSION study (Ghosh et al. 1999) demonstrate that the equal-spacing assumption is not critical. To test the effect of misspecified marker order, we altered the map by changing the order of two nearby markers, either flanking our marker of interest or immediately adjacent to it. For marker spacings of 1–5 cM, the ability to detect errors was essentially unchanged by these sorts of misspecifications in marker order. This is not surprising, because the level of allele sharing across a set of such tightly linked markers will be largely unaffected by modest errors in marker order. In addition, repeat analyses with analysis genotype-error rates different from the true genotype-error rates had little impact on the detection rates or the restoration of linkage information.
Identifying likely genotyping errors and mutations by our method is simple and quick; the posterior error calculations for a sample of 400 sibling pairs genotyped on 100 markers required <1 min computation time on a SUN workstation. Monte Carlo simulation to determine the marker-specific cutoff constants required an additional 20 min. We have written the FORTRAN 77 program SIBMED (sib-pair mutation error detection) to carry out the computations and simulations on a set of linked markers for a sample of sibling pairs. Our program also allows the user to forgo Monte Carlo simulation and instead produce a ranked list of posterior error probabilities with the associated sibling-pair-marker combination information. The program is freely available both on the World Wide Web (see Electronic-Database Information section) and from us, via electronic mail (jddoug@umich.edu or boehnke@umich.edu).
Acknowledgments
We thank William L. Duren and Beth Hauser for making subroutines from their computer programs available to us. This research was supported by NIH grants T32 HG00040 (to J.A.D.), R01 HG00376 (to M.B.), MH59490 (to K.L.), and GM53275 (to K.L.) and by a University of Michigan Rackham Predoctoral Fellowship (to J.A.D.).
Electronic-Database Information
Accession numbers and URLs for data in this article are as follows:
- ASPEX (Affected Sib Pairs EXclusion Map) version 2.2, ftp://lahmed.stanford.edu/pub/aspex/index.html
- SIBMED program, http://www. sph.umich.edu/group/statgen/software
References
- Baum LE (1972) An inequality and associated maximization technique in statistical estimation for probabilistic functions of Markov processes. Inequalities 3:11–18 [Google Scholar]
- Brzustowicz LM, Merette C, Xie X, Townsend L, Gilliam TC, Ott J (1993) Molecular and statistical approaches to the detection and correction of errors in genotype databases. Am J Hum Genet 53:1137–1145 [PMC free article] [PubMed] [Google Scholar]
- Buetow KH (1991) Influence of aberrant observations on high-resolution linkage analysis outcomes. Am J Hum Genet 49:985–994 [PMC free article] [PubMed] [Google Scholar]
- Douglas J, Boehnke M, Lange K (1998) Identifying marker genotyping errors and mutations in sibling-pair linkage data. Am J Hum Genet Suppl 63:A1661 [DOI] [PMC free article] [PubMed] [Google Scholar]
- Dracopoli NC, O’Connell P, Elsner TI, Lalouel J-M, White RL, Buetow K, Nishimura DY, et al (1991) The CEPH consortium linkage map of human chromosome 1. Genomics 9:686–700 [DOI] [PubMed] [Google Scholar]
- Ehm M, Kimmel M (1995) Error detection in genetic linkage data for human pedigrees using likelihood ratio methods. J Biol Syst 3:13–25 [Google Scholar]
- Ehm MG, Kimmel M, Cottingham RW Jr (1996) Error detection for genetic data using likelihood methods. Am J Hum Genet 58:225–234 [PMC free article] [PubMed] [Google Scholar]
- Feakes R, Sawcer S, Chataway J, Coraddu F, Broadley S, Gray J, Jones HB, et al (1999) Exploring the dense mapping of a region of potential linkage in complex disease: an example in multiple sclerosis. Genet Epidemiol 17:51–63 [DOI] [PubMed] [Google Scholar]
- Ghosh S, Karanjawala ZE, Hauser ER, Ally D, Knapp JI, Bayman JB, Musick A, et al (1997) Methods for precise sizing, automated binning of alleles, and reduction of error rates in large-scale genotyping using fluorescently labeled dinucleotide markers. Genome Res 7:165–178 [DOI] [PubMed] [Google Scholar]
- Ghosh S, Watanabe RM, Hauser ER, Valle T, Magnuson VL, Erdos MR, Langefeld CD, et al (1999) Type 2 diabetes: evidence for linkage on chromosome 20 in 716 Finnish affected sib pairs. Proc Natl Acad Sci USA 96:2198–2203 [DOI] [PMC free article] [PubMed] [Google Scholar]
- Kosambi DD (1944) The estimation of map distances from recombination values. Ann Eugenics 12:172–175 [Google Scholar]
- Kruglyak L, Lander ES (1995) Complete multipoint sib-pair analysis of qualitative and quantitative traits. Am J Hum Genet 57:439–454 [PMC free article] [PubMed] [Google Scholar]
- Lathrop GM, Hooper AB, Huntsman JW, Ward RH (1983) Evaluating pedigree data. I. The estimation of pedigree error in the presence of marker mistyping. Am J Hum Genet 35:241–262 [PMC free article] [PubMed] [Google Scholar]
- O’Connell JR, Weeks DE (1998) PedCheck: a program for identification of genotype incompatibilities in linkage analysis. Am J Hum Genet 63:259–266 [DOI] [PMC free article] [PubMed] [Google Scholar]
- Ott J (1993) Detecting marker inconsistencies in human gene mapping. Hum Hered 43:25–30 [DOI] [PubMed] [Google Scholar]
- Risch N (1990) Linkage strategies for genetically complex traits. III. The effect of marker polymorphism on analysis of affected relative pairs. Am J Hum Genet 46:242–253 [PMC free article] [PubMed] [Google Scholar]
- Risch N, Zhang H (1995) Extreme discordant sib pairs for mapping quantitative trait loci in humans. Science 268:1584–1589 [DOI] [PubMed] [Google Scholar]
- Stringham HM, Boehnke M (1996) Identifying marker typing incompatibilities in linkage analysis. Am J Hum Genet 59:946–950 [PMC free article] [PubMed] [Google Scholar]
- Thompson EA (1975) The estimation of pairwise relationships. Ann Hum Genet 39:173–188 [DOI] [PubMed] [Google Scholar]
- Weber JL, Wong C (1993) Mutation of human short tandem repeats. Hum Mol Genet 2:1123–1128 [DOI] [PubMed] [Google Scholar]