

Abstract
An immobilized sequence-specific oligonucleotide (SSO) probe system consisting of 16 SSO probes that detect sequence polymorphisms within five regions of the mtDNA control region was used to investigate the frequency of heteroplasmy in human mtDNA. Five regions of hypervariable region II (HVII) of the control region were studied in blood-, muscle-, heart-, and brain-tissue samples collected from 43 individuals during autopsy. An initial search for heteroplasmy was conducted by use of the SSO probe system. Samples in which multiple probe signals were detected within a region were sequenced for the HVII region, to verify the typing-strip results. The frequency of heteroplasmy was 5 of 43 individuals, or 11.6%. The frequency of heteroplasmy differed across tissue types, being higher in muscle tissue. The difference in the frequency of heteroplasmy across different age groups was statistically significant, which suggests that heteroplasmy increases with age. As a test for contamination and to confirm heteroplasmy, the samples were sequenced for the HVI region and were typed by use of a panel of five polymorphic nuclear markers. Portions of the tissues that appeared to be heteroplasmic were extracted at least one additional time; all gave identical results. The results from these tests indicate that the multiple sequences present in individual samples result from heteroplasmy and not from contamination.
Introduction
Since the human mitochondrial genome was completely sequenced in 1981 by Anderson et al., analysis of mitochondrial DNA (mtDNA) sequence variation has been a favored tool for evolutionary studies. mtDNA has also proven to be a useful target for the analysis of forensic materials because of its high copy number and maternal inheritance (Giles et al. 1980; Case and Wallace 1981). In addition, the noncoding control region of the mitochondrial genome that includes the origin of H-strand replication (Anderson et al. 1981), and two origins of transcription (Cantatore and Attardi 1980) contain a high degree of sequence variability between individuals. The highest degree of polymorphism lies within two hypervariable regions of the noncoding region, HVI and HVII, that can be amplified and sequenced separately (Aquadro and Greenberg 1983; Greenberg et al. 1983; Piercy et al. 1993). Although these features of mtDNA make it a particularly useful target for forensic analyses, there are biological aspects of the organelle that need to be considered to ensure that mtDNA typing results are interpreted appropriately; in particular, the presence of more than one mtDNA sequence within an individual (heteroplasmy) can lead to ambiguous results (Butler and Levin 1998). Although most instances of heteroplasmy have been observed in individuals with mitochondrial diseases (Wallace 1992), individuals with more than one mtDNA sequence have been observed in the normal population. Heteroplasmy is most often detected in the control region as length variation within the homopolymeric tract of cytosine residues in the HVI and HVII regions (Hauswirth and Clayton 1985; Bendall and Sykes 1995; Bendall et al. 1996; Marchington et al. 1996, 1997). Heteroplasmic point mutations were once thought not to occur in the normal population (Monnat and Loeb 1985; Monnat and Reay 1986), but there is increasing evidence that the frequency of these point mutations in the normal population is significant (Gill et al. 1994; Comas et al. 1995; Jazin et al. 1996; Parsons et al. 1997; Calloway 1998).
Specialized laboratories currently use DNA sequence analysis of the HVI and HVII regions for identification of telogen hairs and the remains of missing persons (Ginther et al. 1992; Sullivan et al. 1992; Holland et al. 1993; Wilson et al. 1995a, 1995b; Allen et al. 1998). This method of analysis has been also proposed for the identification of mass disaster remains, which often consist of a variety of small tissue samples from many individuals. Differences in the level of heteroplasmy across tissues, however, have been observed in individuals with mtDNA diseases (Ciafaloni et al. 1991; Larsson et al. 1992). Therefore, prior to the routine use of mtDNA typing in cases of mass disaster, the frequency of heteroplasmy and differences in levels across tissues from individuals in the normal population should be determined. In the present study, tissue samples (heart, brain, muscle, and blood) were collected upon autopsy from 43 individuals ranging in age from 11 to 85 years. The extracted samples were typed by use of 16 immobilized sequence-specific oligonucleotide (SSO) probes that detect sequence variation within five regions of HVII. Heteroplasmy was detected by the immobilized probes in one or more tissues from 5 of the 43 individuals and was confirmed by sequence analysis of the HVII region. The frequency and level of heteroplasmy clearly differed across tissue types and the frequency of heteroplasmy differed significantly with age.
Material and Methods
Collection of Samples
Postmortem tissue samples were collected from 43 individuals at the Georgia Bureau of Investigation (GBI) morgue. A blood sample, as well as two heart and two brain samples, were collected during autopsies of each of the 43 individuals. A deep-muscle sample was collected from 37 of the 43 individuals. The samples were carefully collected by means of forceps that had been soaked in 10% bleach for several minutes between collection of each tissue sample. Tissue samples were stored in 1.5-ml microcentrifuge tubes at −70°C. Blood samples were stored at 4°C in vials with EDTA to prevent clotting.
Extractions
DNA from tissue and blood samples was extracted utilizing Chelex 100 chelating resin (Walsh et al. 1991). This protocol was modified for tissue extractions as follows: a small piece of tissue was placed into a screw-cap tube, and 150 μl of sterile Nanopure water and 10 μl of 20 mg/ml proteinase K were added to the tube. The sample was then incubated at 56°C for ⩾1.5 h. Following the incubation, 50 μl of 20% Chelex solution was added. Samples in which multiple sequences were detected were extracted a second time, by the Chelex extraction method. In addition, five replicate samples from each collected tissue from several individuals (including individuals 10, 13, and 43) were extracted by an organic extraction method (Maniatis manual).
Quantitation and Amplification
Nuclear DNA was quantitated by the chemiluminescent method (Walsh et al. 1992). The amount of nuclear DNA was estimated from slot blot analysis, and ∼1 ng of DNA was amplified. The quantity of mtDNA added is unknown and may be variable between different types of tissues. The mtDNA was amplified in reactions containing 12 mM Tris-HCl, pH 8.3, 60 mM KCl, 2.4 mM MgCl2, 0.2 mM each dNTP, .25 U/μl AmpliTaq Gold DNA polymerase (PE Biosystems), and 0.2 μM of each primer. Biotinylated primers, HVIIL and HVIIR (sequences are described in table 1) were used to amplify a 415-bp PCR product. Primers L16521 and H285 (table 1) were used to center the heteroplasmic positions, which were near the HVIIL primer. To test for contamination, primers HVIL and HVIR (table 1) were used to amplify a 444-bp PCR product from the HVI region. Each product was amplified by use of the following PCR cycling conditions carried out in a programmable thermal cycler (Perkin Elmer) model 9600: 1 cycle at 92°C for 12 min; 34 cycles of amplification, consisting of denaturation at 92°C for 30 s, annealing at 60°C for 30 s, and extension at 72°C for 30 s; and 1 cycle at 72°C for 10 min. After amplification, the PCR product was electrophoresed on a 1.75% agarose gel in the presence of 1% TBE buffer containing ethidium bromide to determine product yield.
Table 1.
Sequences of Primers Used to Amplify mtDNA Products for the HVI and HVII Regions[Note]
| Primer Pair | Primer Sequencea(5′→3′) |
| 1: | |
| HVIL | CTCCACCATTAGCACCCAA |
| HVIR | ATTTCACGGAGGATGGTG |
| 2: | |
| HVIIL | XCACCCTATTAACCACTCACG |
| HVIIR | XCTGTTAAAAGTGCATACCGCCA |
| 3: | |
| L16521 | TCTGGTTCCTACTTCAGGGTCA |
| H285 | XGGGGTTTGGTGGAAATTTTTTTG |
Note.— The three pairs of primers were used to amplify the PCR products, as follows: HVIL and HVIR were used to amplify a 444-bp product in the HVI region; HVIIL and HVIIR were used to amplify a 415-bp product in the HVII region; and L16521 and H285 were used to center the heteroplasmic positions in the HVII region that were close to the upstream primer.
“X” denotes biotin label.
SSO Probe System
An immobilized SSO probe system (Reynolds et al., in press) was used to detect heteroplasmy in the HVII region. This system utilizes 17 SSO probes that are immobilized on a nylon membrane: one SSO probe designated “S” serves as an intensity control, and 16 SSO probes detect sequence polymorphisms within five regions of the HVII (referred to as regions A–E). The S probe corresponds to positions 362–394 of the Anderson (1981) sequence, which is relatively conserved across populations and between individuals, and therefore all amplified HVII products can hybridize to this probe. The polymorphic positions detected by this system are listed in table 2. Regions A–D detect 1–3-nt substitutions relative to the Anderson (1981) sequence, whereas region E detects a length variation or insertion of one or more cytosines at nt positions 303–309. If two probes from the same region hybridized to the PCR product, heteroplasmy was suspected in that region for that sample. Although some heteroplasmic mixtures will produce a weaker E2 signal, heteroplasmy in region E (HVII C-stretch heteroplasmy) is difficult to assess solely by the SSO typing system, because there is only one probe in region E. Therefore, heteroplasmy for this region is not reported in this study. To confirm length heteroplasmy, however, we are currently sequencing each sample.
Table 2.
Sequence Variation in the HVII Region, as Detected by 16 SSO Probes[Note]
|
Sequence Variation Detected at Position |
||||||||||
| Probea | 73 | 146 | 150 | 152 | 189 | 195 | 198 | 200 | 247 | 309.1 |
| A1 | A | |||||||||
| A2 | G | |||||||||
| B1 | T | C | T | |||||||
| B2 | C | C | T | |||||||
| B3 | T | C | C | |||||||
| B4 | C | C | C | |||||||
| B5 | T | T | T | |||||||
| B6 | T | T | C | |||||||
| B7 | C | T | C | |||||||
| C1 | A | T | C | A | ||||||
| C2 | A | C | C | A | ||||||
| C3 | A | C | T | A | ||||||
| C4 | G | T | C | G | ||||||
| D1 | G | |||||||||
| D2 | A | |||||||||
| E2 | C | |||||||||
The amount of PCR product was estimated from the postamplification gel, and as much as 20 μl of the PCR product was mixed with an equal amount of denaturing solution (0.5 M sodium hydroxide). The hybridization strips were labeled and placed in wells of the typing tray. Three milliliters of hybridizing solution (5× SSPE, 0.5% SDS) was added to each well and incubated in a rotating water bath at 55°C for 10 min. Following each hybridization and wash step, the solution was aspirated. After the prehybridization wash step, the denatured PCR product was added to 3 ml of the hybridization solution, and the solution was added to wells containing the corresponding strip and incubated for 15 min. The hybridization strips were then rinsed with 3 ml of wash solution (2× SSPE, 0.5% SDS) by gently rocking the typing tray. Three milliliters of conjugate solution (3.3 ml of hybridization solution, 8 μl of SA-HRP conjugate per strip) were added to each well and incubated for 5 min. The hybridization strips were rinsed with 3 ml of wash solution by rocking the typing tray. Three milliliters of wash solution were added to each well and incubated for 12 min at 55°C. Afterward, the strips were rinsed with 3 ml of wash solution by rocking the typing tray. Three milliliters of 0.1 M citrate buffer, pH 5, were added to each well, and the tray was placed on an orbital shaker at 50 rpm for 5 min at room temperature. Three milliliters of color-developing solution (3 ml of 0.1 M citrate buffer pH 5.0, 3 μl of 3% H2O2, and 150 μl of chromogen solution per strip) were added to each well. The tray was then placed on an orbital shaker for ∼20 min or until the S control signal was visible. The hybridization strips were washed three times with 3 ml of Nanopure water for 5–10 min. Polaroid photographs were taken of the wet strips overlaying an acetate interpretation sheet.
Sequencing
The samples that appeared to be heteroplasmic were sequenced to verify the results from the hybridization strips. The HVI and HVII regions of the samples were manually sequenced by the cycle-sequencing method using [33P]dATP and the AmpliCycle DNA sequencing kit (Perkin Elmer) following the protocol recommended by the manufacturer. A 6% acrylamide, 7 M urea gel was electrophoresed for 1.5–3 h.
As a control, the HVII region of the heteroplasmic samples was also sequenced in both the forward and reverse directions by the Molecular Genetics Instrumentation Facility at the University of Georgia with the ABI Prism 373 Genetic Analyzer, following the recommended protocol for the BigDye dye terminator chemistry. Muscle and heart samples from individuals 10, 13, 28, and 43 were sequenced; heart and brain samples from individual 34 were sequenced. To confirm these results, samples from a second extraction (heart, brain, muscle, and blood) were also sequenced; the HVI and HVII regions of these samples were sequenced by use of the Big Dye sequencing kit (PE Biosystems) with the ABI Prism 310 Genetic Analyzer following the recommended protocol for the BigDye dye terminator chemistry. Sequencing data were analyzed by SEQUENCHER software packages (Gene Codes Corporation).
AmpliType PM
In addition to sequence analysis of the HVI and HVII regions, the AmpliType PM PCR Amplification and Typing kit (Perkin Elmer) was used to determine whether the detected mixtures were due to contamination. The AmpliType PM kit genotypes five loci simultaneously and two unrelated individuals will have the same genotypes <1% of the time (Budowle et al. 1995; Fildes and Reynolds 1995). The protocol recommended by the manufacturer was followed.
Statistical Analysis
A χ2 test for independence and a randomization test were used to determine whether the frequency of heteroplasmy differed significantly with age. Statistical analysis to determine whether the frequency of heteroplasmy differed significantly with race or sex could not be performed because the sample set was predominantly Caucasian males (table 3). Individuals were grouped according to age in years into the following categories: 11–35, (14 individuals); 36–60, (21 individuals); and 61–85, (six individuals). The categories were determined by dividing the range of ages into three equal groups. The observed numbers of heteroplasmic and homoplasmic for each of the three categories are presented in the 2×3 χ2 in table 4. The ages, as well as the sex, race, and mitotype, of each individual are noted in table 3. The ages of two individuals (indicated by a question mark [?] in table 3) were not available; thus, these two individuals were excluded from the statistical analysis.
Table 3.
Age, Race, Sex, and Mitotype of Each Individual, Sorted by Age
|
Probe Signal for Mitotypeb |
|||||||
| Sample | Agea(years) | Race (Sex) | A | B | C | D | E |
| 25 | ? | White (M) | 2 | 1 | 1W | 1 | 0 |
| 39 | ? | African American (M) | 1 | 1 | 0 | 2 | 0 |
| 41 | 11 | White (M) | 2 | 2 | 4 | 1 | 2 |
| 32 | 18 | White (M) | 1 | 1 | 2 | 1 | 2 |
| 8 | 19 | African American (M) | 2 | 0 | 2 | 1 | 2 |
| 11 | 23 | White (F) | 1W | 1 | 2 | 1 | 2 |
| 12 | 23 | African American (M) | 2 | 7 | 0 | 0 | 0 |
| 47 | 24 | White (M) | 2 | 2 | 1 | 1 | 2 |
| 23 | 25 | Asian (M) | 2 | 1 | 2W | 1 | 2 |
| 33 | 26 | White (M) | 1 | 1 | 1 | 1 | 0 |
| 35 | 26 | African American (F) | 2 | 7 | 4 | 1 | 0 |
| 9 | 31 | White (M) | 2 | 2 | 2 | 1 | 2 |
| 21 | 33 | African American (F) | 2 | 7 | 4 | 1 | 2 |
| 27 | 33 | White (F) | 2 | 1W | 1 | 1 | 2 |
| 50 | 33 | White (M) | 2 | 1 | 1 | 1 | 0 |
| 49 | 35 | White (M) | 2 | 6 | 1 | 1 | 0 |
| 29 | 37 | African American (M) | 2 | 0 | 2 | 1 | 2 |
| 19 | 38 | White (F) | 2 | 5 | 1 | 1 | 0 |
| 46 | 38 | White (M) | 2 | 1W | 2 | 1 | 2 |
| 16 | 39 | White (M) | 2 | 1 | 0 | 1 | 2 |
| 22 | 39 | White (M) | 2 | 1 | 1 | 1 | 0 |
| 24 | 39 | White (M) | 2 | 1 | 1 | 1 | 0 |
| 18 | 40 | African American (M) | 2 | 4 | 2 | 1 | 2 |
| 26 | 41 | Asian (M) | 2 | 5 | 1W | 1 | 0 |
| 34 | 41 | African American (M) | 2 | 5<6 | 2 | 1 | 2 |
| 14 | 43 | African American (M) | 2 | 0 | 2 | 1 | 0 |
| 48 | 43 | White (M) | 2 | 5 | 1 | 1 | 0 |
| 37 | 45 | White (F) | 2 | 6 | 1 | 1 | 2 |
| 30 | 47 | White (F) | 2 | 1 | 1 | 1 | 2 |
| 7 | 48 | White (M) | 2 | 1 | 0 | 1 | 0 |
| 20 | 50 | White (M) | 2 | 1W | 2 | 1 | 2 |
| 17 | 52 | African American (F) | 2 | 0 | 0 | 2 | 2 |
| 31 | 54 | White (M) | 2 | 1 | 1 | 1 | 0 |
| 44 | 55 | White (M) | 2 | 1 | 1W | 1 | 0 |
| 40 | 56 | African American (M) | 2 | 4 | 1 | 1 | 0 |
| 42 | 57 | White (M) | 2 | 1 | 1 | 1 | 0 |
| 45 | 60 | White (M) | 1 | 1 | 1 | 1 | 2 |
| 28 | 63 | White (M) | 2 | 1>3 | 1 | 1 | 0 |
| 15 | 69 | African American (F) | 2 | 5 | 2 | 1 | 0 |
| 10 | 73 | White (M) | 1>2 | 1 | 1 | 1 | 2 |
| 13 | 81 | White (M) | 1>2 | 3 | 1 | 1 | 0 |
| 43 | 81 | White (M) | 1>2 | 1 | 1 | 1 | 0 |
| 38 | 85 | White (M) | 2 | 1 | 1 | 1 | 2 |
A question mark (?) denotes that the age was unknown.
Designations are as described in table 2. If two probe signals were detected within a region in any tissue sample, both probes are indicated, with the relative signal amount being indicated by an equality sign. Except for individuals 10, 13, 28, 34, and 43, the single mitotype listed for each individual in the table was observed in all tissue samples; a summary of the mitotypes of these five individuals in whom multiple probe signals were observed is presented in table 5. A weak probe signal (designated by “W”) or no probe signal (designated by “0”) may be observed if the sequence within the probe-binding region varies from that of the probes (Reynolds et al., in press). For example, the mitotype for sample 25 is as follows: A2, B1, C1W (the weak signal observed indicated that this sequence varies at some position within the probe-binding region, thereby affecting hybridization), D1, E0 (no probe signal was observed; thus, there is no length difference vis-à-vis the Anderson [1981] sequence).
Table 4.
Observed Numbers of Heteroplasmic and Homoplasmic Individuals of Each Age Group, Presented in a χ2 Table, with Results[Note]
|
No. of Individuals in Age Range |
||||
| Category | 11–35 years | 36–60 years | 61–85 years | Total |
| Heteroplasmic | 0 | 1 | 4 | 5 |
| Homoplasmic | 14 | 20 | 2 | 36 |
| Total | 14 | 21 | 6 | 41 |
Note.— A χ2 test for independence and a randomization test was conducted to determine whether the frequency of heteroplasmy differed significantly with age. On the basis of this data set, a χ2 value of 19.65 was obtained and P value associated with this χ2 value and 2 df was highly significant, P>.005; a randomization test was conducted to obtain a more accurate P value, which also was also highly significant, P=.00085. Thus, it was determined that the frequency of heteroplasmy differed significantly with age.
To determine whether heteroplasmy differed with age, a 2×3 contingency table was constructed and χ2 values were calculated (Sokal and Rohlf 1995). A randomization test was used to determine the significance of the calculated χ2 value for the collected data (Manly 1997). In this case, a randomization test was used to obtain a more accurate P value, because probability estimates for χ2 tests can be inaccurate when cells contain five or fewer individuals (Sokal and Rohlf 1995). Randomization approaches are powerful alternatives to analyze data when the standard assumptions, such as minimum sample sizes, do not hold (Manly 1997). The randomization approach was followed as described below. Within the data set, each individual was assigned its real age. The 5 heteroplasmic states and 36 homoplasmic states were then randomly reassigned among all individuals. From this new, randomized data set, a new χ2 value was calculated. This procedure was repeated 20,000 times, recalculating new χ2 values for each of the randomized data sets. The probability P associated with the χ2 test of whether heteroplasmy varied with age was given by the frequency of randomized χ2 values that were greater than or equal to the original χ2 value.
Results
SSO Probe Analysis
The mtDNA typing strips shown in figure 1A (for individual 28) are representative of results obtained from a heteroplasmic individual. Heteroplasmy was suspected if two probe signals within a region were observed. The intensity of a probe signal generally reflects the amount of DNA that hybridizes to the probe. Therefore, the two probe signals within a region on the same strip can be compared to determine relative amounts of each sequence in the sample. Absolute probe signals cannot be compared between strips because different amounts of PCR product may have been added to the strips, which is reflected in the intensity of the S probe signal. Two probe signals in region B (B1 and B3) were observed in the tissue samples of the individual shown in figure 1A; therefore, heteroplasmy was suspected in this region and the samples were then sequenced to verify the typing results.
Figure 1.

Immobilized SSO probe strip and DNA sequencing results from a heteroplasmic individual. A, Immobilized SSO probe strip results. The immobilized SSO probe system utilizes 16 SSO probes that detect sequence polymorphisms within five regions of the HVII, referred to as regions A–E. Regions A–D detect 1–3 nt substitutions, and region E detects an insertion of one or more C residues within the HVII C stretch (positions 303–309). Most samples have either one or no positive signal within each of the five regions. If two probes within a region are observed, the sample contains a mixture of two sequences, a mixture that may be due to either contamination or heteroplasmy. For this individual, the two probe signals observed in region B (B1 and B3) are due to heteroplasmy. Probe signals B1 and B3 are clearly observed in the muscle- and brain-tissue samples. A B1 probe signal and a weaker B3 probe signal were observed in the heart and blood tissues of this individual. Because the intensity of a probe signal correlates with the amount of DNA that hybridizes to a probe and is reflected in the S probe signal, probe signals on the same strip can be compared to determine relative amounts of each sequence in the sample; however, because the PCR-product input may vary between strips, absolute signals cannot be compared between strips. B, Sequence results for the region in which multiple sequences were detected from all collected tissues from individual 28. Because the sequences of both sections of the heart and brain tissues (designated as “1” and “2”) were identical, only results from heart 1 and brain 1 are presented. Sequence results verify the multiple sequences observed by the SSO probe system. Multiple sequences (both T and C) were clearly detected by sequencing at position 152 in the muscle and brain tissue of this individual. Although multiple probe signals were detected corresponding to this position in blood and heart tissue, multiple sequences are not detected by sequencing. This observation may be explained by the greater sensitivity of the SSO probe system relative to sequencing.
Two probe signals were detected by the SSO probe system in 5 of the 43 individuals. The typing strip results from individuals in which two probes hybridized within a region are presented in table 5. The probes that hybridized to the particular sample for each region are indicated by the corresponding probe number. Two probe signals were clearly observed in region B of the brain and muscle tissue of individual 28 shown in figure 1A. These probe sequences differ from each other at position 152 and detect T or C at this position (table 2). In muscle tissue, the B3 probe signal was almost equal in intensity to the B1 probe signal, whereas in the brain sample, the B3 probe signal is weaker than the B1 probe signal. A B1 probe signal and a very weak B3 probe signal were observed in the blood and heart samples, suggesting that all tissues from this individual are heteroplasmic but contain different ratios of the two sequences. Two probe signals were detected in all of the sampled tissues (heart, brain, and blood; muscle tissue was not collected) from individual 34 in region B, corresponding to probes 5 and 6. These probe signals differ from the Anderson (1981) sequence at position 150 (T) and differ from each other at position 152, detecting T or C (table 2). The B5 probe signal (secondary mtDNA type) is almost equal in intensity to the B6 probe signal (primary mtDNA type) in the heart, whereas in the brain and blood samples, the B5 probe signal is weaker than the B6 probe signal.
Table 5.
Mitotypes of Samples in Which Two SSO Probe Signals Were Detected
|
HVII Mitotype in Regiona |
|||||
| Sample and Tissue | A | B | C | D | E |
| 10: | |||||
| Heart | 1 | 1 | 1 | 1 | 2 |
| Brain | 1 | 1 | 1 | 1 | 2 |
| Blood | 1 | 1 | 1 | 1 | 2 |
| Muscle | 1≫2 | 1 | 1 | 1 | 2 |
| 13: | |||||
| Heart | 1 | 3 | 1 | 1 | 0 |
| Brain | 1 | 3 | 1 | 1 | 0 |
| Blood | 1 | 3 | 1 | 1 | 0 |
| Muscle | 1>2 | 3 | 1 | 1 | 0 |
| 43: | |||||
| Heart | 1 | 1 | 1 | 1 | 0 |
| Brain | 1 | 1 | 1 | 1 | 0 |
| Blood | 1 | 1 | 1 | 1 | 0 |
| Muscle | 1>2 | 1 | 1 | 1 | 0 |
| 28: | |||||
| Heart | 2 | 1≫3 | 1 | 1 | 2 |
| Brain | 2 | 1>3 | 1 | 1 | 2 |
| Blood | 2 | 1≫3 | 1 | 1 | 2 |
| Muscle | 2 | 1>3 | 1 | 1 | 2 |
| 34: | |||||
| Heart | 2 | 6≅5 | 2 | 1 | 2 |
| Brain | 2 | 6>5 | 2 | 1 | 2 |
| Blood | 2 | 6>5 | 2 | 1 | 2 |
If two probe signals were detected within a region in any tissue sample, both probes are indicated, with the relative signal amount being indicated by an equality sign, as follows: “>” indicates that both signals were clearly visible, with one being greater than the other; “≫” indicates that a weak probe signal from a secondary sequence was detected; and “≅” denotes almost equal intensity. A zero (0) was recorded if no probe signal was detected; for example, the mitotype for sample number 10, muscle tissue, is as follows: A1 and A2 (the detection of the weak A2 probe signal indicates a low level of a secondary sequence), B1, C1, D1, E2.
Two probe signals were detected in region A of the muscle samples of three individuals (10, 13, and 43) corresponding to probes 1 and 2. These probes detect a polymorphism at position 73 (table 2). In these three individuals, two probe signals were observed in muscle tissue but not in heart, brain, or blood tissue. In muscle samples from these three individuals, a weak A2 probe signal was observed. In the muscle tissue of individual 10, the A1 probe signal was significantly weaker relative to the probe signals in regions B–E, with only a very faint or trace A2 probe signal present. Again, a weaker A1 probe signal relative to the probe signals detected in regions B–E, and a weak A2 probe signal was observed in the muscle tissue of individual 43. Both an A1 probe signal, which was almost of equal intensity in relation to the probe signals detected in regions B–E, and a weak A2 probe signal were observed in the muscle tissue of individual 13. It is interesting to note that two probe signals were detected only in the muscle tissue and in the same region (corresponding to A and G at position 73) of these three individuals.
HVII-Region Sequencing Results
The HVII region from all available tissues from the five individuals presented in table 6 were sequenced by use of BigDye chemistry with the ABI Prism 310 Genetic Analyzer to verify that the multiple sequences detected by the typing strips were due to heteroplasmy. Prior to implementing this sequencing method, some tissues were also sequenced manually or with the ABI Prism 373 Genetic Analyzer, as noted in table 6. When heteroplasmy was observed, the secondary base detected at a position is noted in lowercase letters. If the peak heights or signal intensity of the primary and secondary bases were almost equal, both bases were noted in capital letters; however, equivalent peaks do not necessarily indicate equal amounts of the two sequences, because the base-specific probe signals at a particular position can be markedly different relative to a neighboring base.
Table 6.
HVI and HVII Sequence Variation Detected by Direct DNA Sequence Analysis Using ABI 310 and BigDye Dye Terminator Chemistry
|
Sequence Variation inb |
|||||||||||||||||||||||||
| HVII |
HVI |
||||||||||||||||||||||||
| 64 | 72 | 73 | 114 | 146 | 150 | 152 | 189 | 195 | 263 | 309.1 | 315.1 | 16126 | 16129 | 17172 | 16183 | 16189 | 16192 | 16223 | 16224 | 16287 | 16294 | 16296 | 16304 | 16320 | |
| Referencea | C | T | A | C | T | C | T | A | T | A | … | … | T | G | T | A | T | C | C | T | T | C | C | T | C |
| Samples: | |||||||||||||||||||||||||
| 10: | |||||||||||||||||||||||||
| Heartc | . | . | . | . | . | . | . | . | . | G | C | C | . | A | . | . | . | . | . | . | . | . | . | . | . |
| Brainc | . | . | . | . | . | . | . | . | . | G | C | C | . | A | . | . | . | . | . | . | . | . | . | . | . |
| Blood | . | . | . | . | . | . | . | . | . | G | C | C | . | A | . | . | . | . | . | . | . | . | . | . | . |
| Musclec | . | t/C | A/g | . | . | . | . | A/G | . | G | C | C | . | A | . | . | . | . | . | . | . | . | . | . | . |
| 13: | |||||||||||||||||||||||||
| Heartc | . | . | . | . | . | . | C | . | . | G | . | C | . | . | . | . | . | . | . | . | . | . | . | . | . |
| Brain | . | . | . | . | . | . | C | . | . | G | . | C | . | . | . | . | . | . | . | . | . | . | . | . | . |
| Blood | . | . | . | . | . | . | C | . | . | G | . | C | . | . | . | . | . | . | . | . | . | . | . | . | . |
| Muscle | . | T/c | A/g | . | . | . | C | A/G | . | G | . | C | . | . | . | . | . | . | . | . | . | . | . | . | . |
| 43: | |||||||||||||||||||||||||
| Heartc | . | . | . | . | . | . | . | . | . | . | . | C | . | . | . | . | . | T | . | . | . | . | . | . | . |
| Brain | . | . | . | . | . | . | . | . | . | . | . | C | . | . | . | . | . | T | . | . | . | . | . | . | . |
| Blood | . | . | . | . | . | . | . | . | . | . | . | C | . | . | . | . | . | T | . | . | . | . | . | . | . |
| Musclec | C/a | t/C | A/g | . | . | . | . | A/G | . | . | . | C | . | . | . | . | . | T | . | . | . | . | . | . | . |
| 28: | |||||||||||||||||||||||||
| Heartc | . | . | G | . | . | . | . | . | . | G | . | C | C | . | . | . | . | . | . | . | . | T | T | C | . |
| Brainc | . | . | G | . | . | . | c/T | . | . | G | . | C | C | . | . | . | . | . | . | . | . | T | T | C | . |
| Blood | . | . | G | . | . | . | . | . | . | G | . | C | C | . | . | . | . | . | . | . | . | T | T | C | . |
| Musclec | . | . | G | . | . | . | c/T | A/G | . | G | . | C | C | . | . | . | . | . | . | . | . | T | T | C | . |
| 34: | |||||||||||||||||||||||||
| Heartc | . | . | G | . | . | T | C/t | . | C | G | C | C | . | . | C | C | C | * | T | . | . | . | . | . | T |
| Brainc | . | . | G | . | . | T | C/t | . | C | G | C | C | . | . | C | C | C | * | T | . | . | . | . | . | T |
| Blood | . | . | G | . | . | T | C/t | . | C | G | C | C | . | . | C | C | C | * | T | . | . | . | . | . | T |
| Analystd | . | . | . | T | C | . | C | . | C | G | . | C | . | . | . | . | . | . | . | C | C | . | . | . | . |
Anderson (1981)
Sequencing was in both directions, by means of ABI 310 and BigDye dye terminator chemistry; if multiple signals were observed at a position, the predominant sequence is denoted by a capital letter. Asterisks (*) denotes that, in all tissues collected from sample 34, a mixture of 10, 11, or 12 C's was detected in the HVI C stretch.
For HVII, tissue sample also was sequenced both by ABI 373 and manually, and, for HVI, tissue sample also was sequenced manually; in all cases, the multiple methods resulted in identical sequences, confirming heteroplasmy.
Also sequenced manually; in all cases, both methods resulted in identical sequences, confirming heteroplasmy.
Heteroplasmy was detected by sequence analysis in the heart, brain, and blood tissue samples of individual 34. As expected from the mtDNA SSO probe typing results, two sequences were detected at position 152 in all collected tissues of this individual (corresponding to the Anderson 1981) sequence. Two sequences were also observed at position 152 of the muscle and brain tissues of individual 28, but not in the blood or heart tissue (fig. 1B). Only a trace of a secondary sequence was detected in the brain tissue of this individual.
Individuals 10, 13, and 43 were heteroplasmic in muscle tissue only. Although both A and G were expected at position 73 (on the basis of SSO probe results), only an A was observed by manual sequencing in these individuals. Both A and G were observed by automated sequencing at position 73; however, the G peak was almost undetectable. Sequencing results from individual 43 showing the A/G heteroplasmy at position 73 are presented in figure 2. The absence of G at position 73 by manual sequencing and the low detection by automated sequencing may be explained by the greater sensitivity of the SSO probe system compared to sequencing, based on the observations of a mixture study (Reynolds et al., in press). Reynolds et al. revealed that the ability to detect mixtures by automated sequencing varied from position to position and that the SSO probe system was more sensitive than sequencing. Specifically, at position 73, a mixture was detectable only at about a 20% level by sequencing but at about a 10% level by typing.
Figure 2.
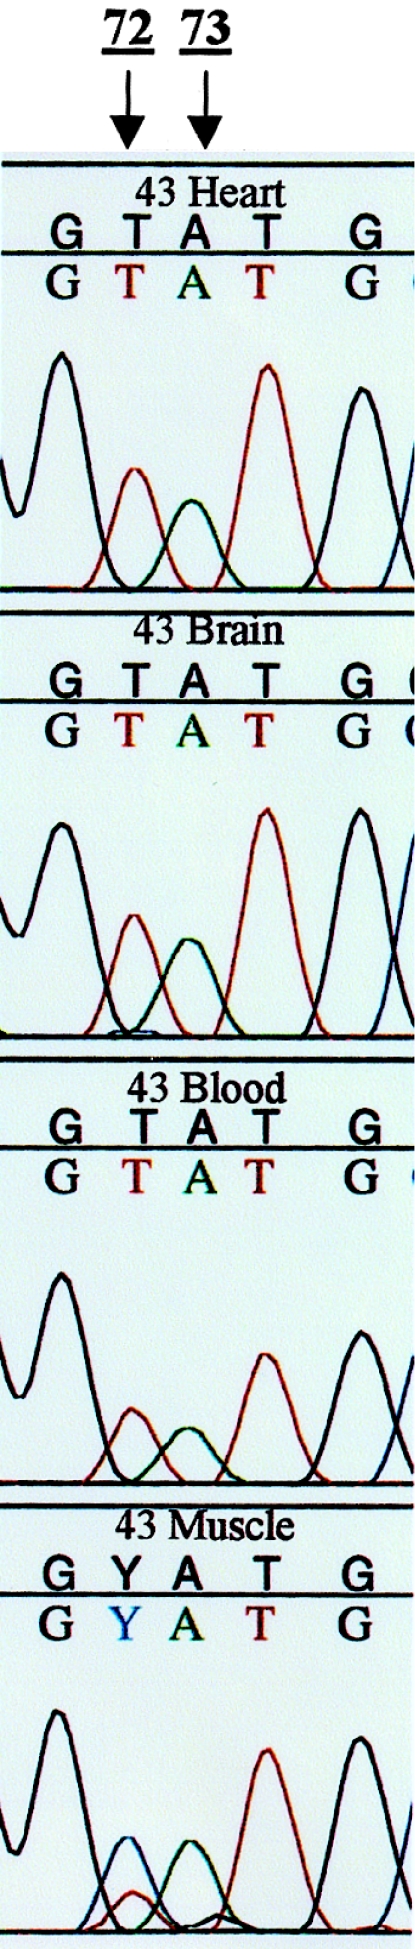
Sequencing results from an individual with heteroplasmy at multiple positions and with a complete switch of mtDNA sequences in the muscle tissue. Multiple sequences were observed at three confirmed positions in the muscle tissue of this individual, 43. Sequencing results from two of the heteroplasmic positions (72 and 73) are represented. The multiple sequences observed at position 73 were detected by the SSO probe system and correspond to region A. Both A and G were detected at position 73 in the muscle tissue, as expected on the basis of the SSO probe analysis. The G peak is off center, but this result was found to be typical of multiple sequences detected at this position. Sequencing analysis also revealed multiple sequences at position 72 in the muscle tissue of this individual. In the heart, brain, and blood, only a T was observed, whereas in the muscle both C and T were observed at this position in the muscle tissue (C→ T). Thus, a switch of predominant mtDNA sequences is observed in the muscle tissue, compared with the other sequenced tissue samples. Similar results were observed in individual 10.
Both manual and automated sequencing (both with the ABI 373 and ABI 310) revealed a second heteroplasmic position within region A of these same three individuals (10, 13, and 43). Two sequences were observed at position 72, again only in the muscle tissue. Figure 2 shows the T/C heteroplasmy at position 72 for individual 43. Thus, the weaker A1 probe signal detected by the SSO probe system can be explained by the C present at position 72, which reduces the binding efficiency of the product to the probe (Reynolds et al., in press). The primary base detected in muscle tissue of individual 13 was T. In contrast, the primary base in muscle tissue from individuals 10 and 43 was C (fig. 2). For these three individuals, only T was observed in heart, brain, and blood. Therefore, in individuals 10 and 43, the primary sequence in muscle has shifted from T to C at position 72 (fig. 2).
Although the heteroplasmy described was observed in both sequencing directions, positions 72 and 73 are close to the upstream (HVII L) primer. A second primer set (L16521 and H285 described in table 1) was designed so that these positions would be centered in the PCR product. Products from the heteroplasmic individuals were typed and sequenced and identical results were observed. From these results, a third possible heteroplasmic position (C/A) was revealed at position 64 in individual 43. These products are being cloned and sequenced to further characterize these multiple sequence variations.
In addition to the heteroplasmy detected at position 72, 73, and 152, an A/G heteroplasmy was detected by both automated and manual sequencing at position 189 in the muscle tissue of individuals 10, 13, 28, and 43. Sequencing data revealing heteroplasmy at position 189 for individuals 28 and 43 are presented in figure 3A and B, respectively. A probe signal in addition to C1 was not observed for these samples because the C2, C4, and C5 probes do not detect the mitotype of the secondary sequence (189 G, 195 T, 198 C, 200 A). The typing data obtained from the SSO probe system is informative, but it is limited to the five most variable regions within the HVII region. Consequently, the frequency of heteroplasmy may be higher than detected in this study. Further investigation of heteroplasmy by sequencing may yield an increased frequency of heteroplasmy in regions undetectable by the SSO probe system. Additional studies are underway to examine the frequency of heteroplasmy by sequencing the remaining individuals who do not appear to be heteroplasmic.
Figure 3.

Sequencing results from two individuals with heteroplasmy at position 189 in the muscle tissue. Heteroplasmy was confirmed at position 189 in four of the five heteroplasmic individuals. Heteroplasmy at this position was observed only in the muscle tissue; muscle tissue was not collected from the fifth heteroplasmic individual. Representative sequencing results of the multiple mtDNA sequences observed at position 189 in the tissue samples sequenced from individuals 28 and 43 are presented (sequencing results of the other positions in which heteroplasmy was detected are presented in figs. 1B and 2). Both A and G signals were observed at nearly equal ratios at this position in muscle tissue.
HVI-Region Sequencing Results
Sequencing of the HVI region of the heteroplasmic individuals was conducted to confirm that the multiple sequences detected in the HVII region were due to heteroplasmy and not contamination. If the mixtures were due to contamination from another individual, the HVI sequence would likely show mixtures at one or more positions, since this region is highly polymorphic. Multiple sequences were not detected by manual or automated sequencing at any position in the HVI region, suggesting that the multiple sequences observed in the HVII region are not a result of contamination; however, multiple sequences varying in the number of cytosine residues in the HVI region (known as the “C stretch”) were detected by both manual and automated sequencing in all collected tissues of individual 34 (table 6). Because length heteroplasmy occurring in this stretch of C residues has been well documented (Bendall and Sykes 1995; Bendall et al. 1996; Marchington et al. 1996, 1997), we concluded that the mixture of these length variants was not due to contamination but rather to heteroplasmy. Also, because five differences compared to the Anderson (1981) sequence were detected in the HVI region of this individual (table 6) and multiple sequences were not detected at any of these positions, the C-stretch length variation is likely due to heteroplasmy and not contamination.
AmpliType PM Results
Tissue samples from each of the heteroplasmic individuals were typed and the results were compared. Each individual had a unique PM genetic profile. Therefore, if contamination between individuals had occurred, it would be detected on these SSO probe strips. Typing results of the tissue samples within an individual were identical, and no more than two alleles were observed at the HBGG and GC loci (each have three common alleles). These results suggest that the observed mixtures in the HVII region are not a result of contamination or sample mix-up.
Frequency Calculations
The percent of heteroplasmic individuals was calculated for each tissue type in the regions detected by the SSO probe system and verified by sequencing. The frequency of heteroplasmy was 5 of 43 individuals, or 11.6%, and differed across tissue types. The frequency of heteroplasmy in muscle tissue was 4 of 37 individuals, or 10.8%. (Note that this calculation does not include the individual who was heteroplasmic for all tissues collected, because no muscle tissue was collected from this individual.) The frequency of heteroplasmy in the HVII region was 2 of 43 individuals, or 4.7%, in brain tissue and 1 of 43 individuals, or 2.3%, in blood and heart tissue. (Note that this calculation does not include individual 28, in whom heteroplasmy was detected by the SSO probes but not by sequencing.)
Statistical Test for Age and Heteroplasmy
The test of independence for association of heteroplasmy and age gave a significant χ2 value of 19.65; the probability P associated with this χ2 value with 2 df was highly significant (P > .005; table 4). To obtain a more accurate P value, a randomization test was conducted. The randomization test gave a highly statistically significant P value of .00085 (table 4). Since highly significant P values were obtained from both tests, we concluded that the frequency of heteroplasmy varies with age. The mean age of homoplasmic individuals was 39.2 years, and the mean age of heteroplasmic individuals was 69 years; thus, heteroplasmy in the HVII region appears to increase with age.
Discussion
Confirmation of Observed Heteroplasmy
Heteroplasmy and the high risk of contamination pose challenges to the interpretation of mtDNA typing results, whether obtained by SSO probe hybridization or sequence analysis. During the collection of autopsy samples and extraction of tissues, extensive measures to prevent contamination were carried out. Both heteroplasmy and contamination may appear as a mixture of sequences. Thus, without further information, heteroplasmy and contamination cannot readily be differentiated. Therefore, following the collection of the samples, replicate extractions and repeated amplifications and typings were performed to confirm the initial results. Five samples from each tissue type from individuals 43, 10, and 13 were typed, and the results were identical for each replicate. On a different day, another portion of each tissue from individual 43 was reextracted, reamplified, and retyped, and the results were identical to the first five samples. Several months after the initial extraction, a second extraction of one sample from each tissue from all five heteroplasmic individuals was performed. The samples were typed and sequenced, and these results were also identical to the initial results. Multiple samples in a blind format were amplified and sequenced at a second location, again with identical results. Because the results were reproducible (the same tissues, and no others, appeared to be heteroplasmic) and multiple sequences were not detected by sequencing the HVI region or typing by the AmpliType PM system, the likelihood that the mixtures of mtDNA detected by the SSO probe system are due to contamination is extremely low. In addition, since the HVI and HVII sequences of the analyst are unique, differing from all 43 individuals of this study, the multiple sequences observed from the heteroplasmic samples cannot be explained by contamination from the analyst (see table 6).
In addition to contamination, PCR replication error and amplification of a nuclear pseudogene have been proposed as other sources of multiple sequences. The possibility that the mixtures of sequences are due to replication error during PCR is unlikely, because identical results from duplicate amplifications were obtained. Also, such errors are unlikely to occur predominantly with DNA extracted from muscle tissue. The possibility that the mixtures of sequences are attributable to amplification of a nuclear pseudogene is also unlikely. In the present study, the highest number of observed heteroplasmic positions was three, and all three of these positions were observed in the HVII region. To date, a pseudogene has not been reported that corresponds to the HVII region. There are, however, two well-characterized nuclear insertions of a portion of the HVI region into chromosomes 11 and 9 (Zischler et al. 1995, 1998). Each of these insertions is ∼300 bp long. One of the insertions differed by an average of 21 substitutions from human mtDNA sequences and the other by more than twice that number. Therefore, if an HVII pseudogene had been coamplified, differences would most likely be observed at a high proportion of the positions within our 415-bp PCR product. To address directly the possibility that the results of this study are due to coamplification of a pseudogene corresponding to the HVII region, the entire control region from the individuals containing three putative heteroplasmic positions was amplified by the HVIL and HVIIR primers, and the individual HVI and HVII regions were sequenced from this PCR product. The results were identical to those obtained with the original primer pair and the alternate primer pair used to center the heteroplasmic positions, and no additional mixtures were observed in either region (data not shown). If the observed mixture of sequences was due to coamplification of nuclear and mitochondrial sequences, then the results obtained from the entire control region product should have been different from the original 415-bp product results.
To address further the issue of a nuclear pseudogene, mtDNA-free cells (ρ° cells) and the parental cell line 143B were tested with PM nuclear primer pairs and our HVII mtDNA primer pair. A portion of the cell pellets (both ρ° and parental) were extracted by use of the same protocol that was used to extract the tissue samples for our study. DNA from both the parental and ρ° cell lines was successfully amplified by the nuclear primer pairs, showing that the nuclear DNA was not compromised by the extraction method. The HVII mtDNA primer pair was only successful in amplifying DNA from the parental strain and not from the mtDNA-free cells (data not shown). Thus, this analysis is further evidence that a nuclear pseudogene was not coamplified and supports our initial conclusion that the multiple sequences we observed are due to heteroplasmy. Therefore, we concluded that the multiple sequences detected in specific tissues by the SSO probe system and confirmed by sequencing can be attributed to heteroplasmy and not to contamination, PCR replication error, or coamplification of a nuclear pseudogene.
Forensic Implications of Increased Heteroplasmy with Age and of Variation across Tissues
Most age-related mutation accumulation studies have focused on the common deletion and point mutations in the coding region (Cortopassi and Arnheim 1990; Hattori et al. 1991; Corral-Debrinski et al. 1992; Cortopassi et al. 1992; Zhang et al. 1993; Melov et al. 1995). The deletion variant comprises <0.1% of the mtDNA and has not been observed at a detectable level by direct sequencing. In one case, a level of 10% was reported in an 80-year-old individual (Corral-Debrinski et al. 1992). Reports of an age-related accumulation of point mutations in the coding region have been contradictory; both age-related accumulations of point mutations (Liu et al. 1998) and no correlation of point mutations have been reported (Pallotti et al. 1996). The preferred region of analysis for human identification applications, because of the high degree of polymorphism, is the control region (specifically, noncoding regions HVI and HVII). Studies of heteroplasmy in the noncoding region have been limited, however, both in the number published and the number of samples analyzed. Jazin et al. (1996) investigated heteroplasmy in the noncoding region of brain samples in three individuals, using a very sensitive method of detection (cloning); their study suggests an increase in point mutations in the noncoding region in brain tissue with age. In our study, point mutation heteroplasmy in the noncoding region was investigated in four tissues of 43 individuals; the frequency of heteroplasmy was highest in muscle tissue, and statistical analysis demonstrated a significant increase of heteroplasmy with age (Calloway 1998). Our results do not necessarily contradict the results of Jazin et al. (1996), since they used a more sensitive detection method and investigated heteroplasmy in various regions of the brain. Results from our initial cloning studies with all of the tissues are consistent with those of Jazin et. al. and our original observations.
Because the frequency of heteroplasmy differed among age groups and statistical analysis showed a significant increase of heteroplasmy with age, the age of the individual in question should be considered when interpreting mtDNA typing results. In particular, age and heteroplasmy should be considered in missing person cases when a significantly older individual is used as a reference for a missing younger maternal relative. Again, the frequency of heteroplasmy seemed to differ across tissue types and appeared to be more frequent in muscle. Thus, tissue samples other than muscle, if available, should be typed when conducting mtDNA analysis for forensic cases to minimize the potential interpretation issues associated with heteroplasmy.
Origin of Observed Heteroplasmy
A cell may become heteroplasmic through a germ line or a somatic mutation; thus, heteroplasmy may be inherited or somatic. Heteroplasmy in humans was once hypothesized to be due to paternal leakage, where the father contributes a small number of mtDNA molecules to the progeny. Although evidence for paternal leakage has been observed in other organisms (Kondo et al. 1990; Gyllensten et al. 1991; Zouros et al. 1992), there is no evidence that the paternal mtDNA makes any significant genetic contribution in humans. Also, because the primary and secondary mtDNA sequences observed in the heteroplasmic individuals in this study are closely related, the variant sequence of these individuals is thought to have a mutational, rather than a paternal, origin. Thus, in the case of heteroplasmy seen across all tissue types in this study (individual 34), the most likely mode of heteroplasmy is inheritance from the mother. Because maternal samples were unavailable for testing, the possibility that the observed heteroplasmy is a result of an early mutational event in oogenesis or zygote development must also be considered; however, somatic mutation is unlikely, because heteroplasmy was detected in all available tissues from this individual.
Heteroplasmy at position 152 observed in muscle and brain tissues and detected by the SSO typing strips from individual 28 is also likely due to an inherited heteroplasmy or a mutation prior to cell differentiation. Although heteroplasmy was detected only in the brain and muscle samples of this individual by fluorescent sequencing, a low level of heteroplasmy was detected by the SSO typing strips in the heart and blood samples. Because the SSO typing strips are more sensitive than sequencing for detecting the presence of a second sequence, heteroplasmy in some tissues may be detected by the SSO typing strips but not by sequencing. Therefore, heteroplasmy at position 152 is thought to occur in all tissues of this individual; however, it should be noted that the ratio of the secondary sequence to the primary sequence differed between tissues (muscle > brain > heart/blood) and that the level of the secondary sequence was >15% in muscle and brain and ∼5%–10% in heart and blood.
Heteroplasmy was observed at position 189 in addition to position 152, in individual 28. In contrast to position 152, heteroplasmy at position 189 was observed only in muscle tissue (by both the SSO probe system and sequencing), and the secondary sequence was observed at approximately a 50% level. Heteroplasmy was also observed only in the muscle tissue of individuals 10, 13, and 43 at positions 72 and 73 as well as position 189; again, the secondary sequence detected at position 189 was observed at approximately a 50% level. Because heteroplasmy was observed only in muscle tissue and at a high level by the SSO probe system sequencing in these individuals, heteroplasmy was not reported for the other tissues. Although heteroplasmy may possibly occur at a level undetectable by both the SSO probe system and sequencing in the other tissues, this rationalization cannot explain the increased level of the secondary sequence observed in muscle tissue compared to other tissues. Therefore, heteroplasmy detected only in the muscle samples is thought to be due to a somatic mutation followed by an amplification event and not an inherited mutation.
An increase in mtDNA mutations may be a result of the production of oxygen radicals during oxidative phosphorylation, which is the primary source of energy for several organs and tissues, including muscle, brain, and heart (Wallace 1992). Tissues with high energy requirements seem to accumulate mtDNA mutations more readily; thus, in general, the accumulation of mtDNA mutations is proportional to its metabolic rate (Shoffner and Wallace 1995). An increase in mutation rate is not sufficient to explain the increased level of heteroplasmy in muscle. The mutation must be followed by an amplification event in order for the level of heteroplasmy to be detectable (for the purposes of this study, >5%–10%). After a mtDNA mutation arises and the heteroplasmic cell divides, its mtDNAs randomly segregate into the daughter cells. After many cell divisions, the random partitioning causes the molecules to drift toward homoplasmy, known as “replicative segregation” (Wallace 1994). As a result of replicative segregation, the level of heteroplasmy may vary within the tissues of an individual (Wallace 1994). A germline mutation or a mutation prior to cell differentiation followed by replicative segregation may also result in a difference in the level of heteroplasmy between tissues. The level of heteroplasmy within a cell may vary even before cytokinesis, because of the imprecise and nonrandom or “relaxed” replication system (Birky 1994), also possibly leading to a difference in the level of heteroplasmy between tissues. Recently Jenuth et al. (1997) have observed tissue-specific segregation, whereby directional segregation occurred in some tissues (one way in some and in the opposite in others) while not occurring in others. This observation, although observed in a mouse model, may explain the increased level of heteroplasmy observed in muscle tissue within an individual as well.
Future Studies
Because all of the heteroplasmic individuals from whom muscle tissue was collected were heteroplasmic at position 189 and the current SSO typing strips do not detect this polymorphism, additional probes have been designed and further investigation and characterization of heteroplasmy at this position are underway. Also, additional studies to investigate the possibility that there are heteroplasmic hot spots and to determine the frequency of the occurrence of multiple heteroplasmic positions within the hypervariable region of an individual are completed. Further characterization of the frequency of heteroplasmy in the HVI and HVII regions across tissue types and age groups by direct sequencing is also completed. This information will be valuable for refining existing interpretation guidelines for mtDNA of casework materials and of remains analysis of mass disaster.
Note added in proof.—After our work was submitted, a manuscript by Michikawa et al. was submitted and published in the October 22, 1999, issue of Science. Their data are consistent with our findings.
Acknowledgments
We thank the medical examiners of the Georgia Bureau of Investigation for the collection of the autopsy samples. The authors particularly thank Dr. Eric Shoubridge for the ρ° and parental cell pellets. We acknowledge Karen Walker and Joe Varlaro for optimization and development of the SSO mtDNA-typing system. We especially thank Dr. Daniel Promislow for his thoughtful suggestions and collaboration with the statistical analysis, specifically the randomization test. We thank our colleagues, Drs. Henry Erlich and Michael Goodisman, and the reviewers for their helpful suggestions and comments on the manuscript. We also thank Drs. John Avise and Ulf Gyllensten for their valuable discussions. This research was supported in part by National Institute of Justice grant 95-IJ-CX-0014 awarded to R.L.R. and to Henry Erlich.
References
- Allen M, Engstrom AS, Meyers S, Handt O, Saldeen T, von Haeseler A, Pääbo S, et al (1998) Mitochondrial DNA sequencing of shed hairs and saliva on robbery caps: sensitivity and matching probabilities. J Forensic Sci 43:453–464 [PubMed] [Google Scholar]
- Anderson S, Bankier AT, Barrell BG, de Bruijn MH, Coulson AR, Drouin J, Eperon IC, et al (1981) Sequence and organization of the human mitochondrial genome. Nature 290:457–465 [DOI] [PubMed] [Google Scholar]
- Aquadro CF, Greenberg BD (1983) Human mitochondrial DNA variation and evolution: analysis of nucleotide sequences from seven individuals. Genetics 103:287–312 [DOI] [PMC free article] [PubMed] [Google Scholar]
- Bendall KE, Macaulay VA, Baker JR, Sykes BC (1996) Heteroplasmic point mutations in the human mtDNA control region. Am J Hum Genet 59:1276–1287 [PMC free article] [PubMed] [Google Scholar]
- Bendall KE, Sykes BC (1995) Length heteroplasmy in the first hypervariable segment of the human mtDNA control region. Am J Hum Genet 57:248–256 [PMC free article] [PubMed] [Google Scholar]
- Birky CJ (1994) Relaxed and stringent genomes: why cytoplasmic genes don't obey Mendel's laws. J Hered 85:355–365 [Google Scholar]
- Budowle B, Lindsey JA, DeCou JA, Koons BW, Giusti AM, Comey CT (1995) Validation and population studies of the loci LDLR, GYPA, HBGG, D7S8, and Gc (PM loci), and HLA-DQ alpha using a multiplex amplification and typing procedure. J Forensic Sci 40:45–54 [PubMed] [Google Scholar]
- Butler JM, Levin BC (1998) Forensic applications of mitochondrial DNA. Trends Biotechnol 16:158–162 [DOI] [PubMed] [Google Scholar]
- Calloway C (1998) The frequency of heteroplasmy in the HVII region of mtDNA in human tissues. MS thesis, University of Georgia, Athens [Google Scholar]
- Cantatore P, Attardi G (1980) Mapping of nascent light and heavy strand transcripts on the physical map of HeLa cell mitochondrial DNA. Nucleic Acids Res 8:2605–2625 [DOI] [PMC free article] [PubMed] [Google Scholar]
- Case JT, Wallace DC (1981) Maternal inheritance of mitochondrial DNA polymorphisms in cultured human fibroblasts. Somat Cell Genet 7:103–108 [DOI] [PubMed] [Google Scholar]
- Ciafaloni E, Ricci E, Servidei S, Shanske S, Silvestri G, Manfredi G, Schon EA, et al (1991) Widespread tissue distribution of a tRNALeu(UUR) mutation in the mitochondrial DNA of a patient with MELAS syndrome. Neurology 41:1663–1664 [DOI] [PubMed] [Google Scholar]
- Comas D, Pääbo S, Bertranpetit J (1995) Heteroplasmy in the control region of human mitochondrial DNA. Genome Res 5:89–90 [DOI] [PubMed] [Google Scholar]
- Corral-Debrinski M, Horton T, Lott MT, Shoffner JM, Beal MF, Wallace DC (1992) Mitochondrial DNA deletions in human brain: regional variability and increase with advanced age. Nat Genet 2:324–329 [DOI] [PubMed] [Google Scholar]
- Cortopassi GA, Arnheim N (1990) Detection of a specific mitochondrial DNA deletion in tissues of older humans. Nucleic Acids Res 18:6927–6933 [DOI] [PMC free article] [PubMed] [Google Scholar]
- Cortopassi GA, Shibata D, Soong NW, Arnheim N (1992) A pattern of accumulation of a somatic deletion of mitochondrial DNA in aging human tissues. Proc Natl Acad Sci USA 89:7370–7374 [DOI] [PMC free article] [PubMed] [Google Scholar]
- Fildes N, Reynolds R (1995) Consistency and reproducibility of AmpliType PM results between seven laboratories: field trial results. J Forensic Sci 40:279–286 [PubMed] [Google Scholar]
- Giles RE, Blanc H, Cann HM, Wallace DC (1980) Maternal inheritance of human mitochondrial DNA. Proc Natl Acad Sci USA 77:6715–6719 [DOI] [PMC free article] [PubMed] [Google Scholar]
- Gill P, Ivanov PL, Kimpton C, Piercy R, Benson N, Tully G, Evett I, et al (1994) Identification of the remains of the Romanov family by DNA analysis. Nat Genet 6:130–135 [DOI] [PubMed] [Google Scholar]
- Ginther C, Issel-Tarver L, King MC (1992) Identifying individuals by sequencing mitochondrial DNA from teeth. Nat Genet 2:135–138 [DOI] [PubMed] [Google Scholar]
- Greenberg BD, Newbold JE, Sugino A (1983) Intraspecific nucleotide sequence variability surrounding the origin of replication in human mitochondrial DNA. Gene 21:33–49 [DOI] [PubMed] [Google Scholar]
- Gyllensten U, Wharton D, Josefsson A, Wilson AC (1991) Paternal inheritance of mitochondrial DNA in mice. Nature 352:255–257 [DOI] [PubMed] [Google Scholar]
- Hattori K, Tanaka M, Sugiyama S, Obayashi T, Ito T, Satake T, Hanaki Y, et al (1991) Age-dependent increase in deleted mitochondrial DNA in the human heart: possible contributory factor to presbycardia. Am Heart J 121:1735–1742 [DOI] [PubMed] [Google Scholar]
- Hauswirth WW, Clayton DA (1985) Length heterogeneity of a conserved displacement-loop sequence in human mitochondrial DNA. Nucleic Acids Res 13:8093–8104 [DOI] [PMC free article] [PubMed] [Google Scholar]
- Holland MM, Fisher DL, Mitchell LG, Rodriquez WC, Canik JJ, Merril CR, Weedn VW (1993) Mitochondrial DNA sequence analysis of human skeletal remains: identification of remains from the Vietnam War. J Forensic Sci 38:542–553 [PubMed] [Google Scholar]
- Jazin EE, Cavelier L, Eriksson I, Oreland L, Gyllensten U (1996) Human brain contains high levels of heteroplasmy in the noncoding regions of mitochondrial DNA. Proc Natl Acad Sci USA 93:12382–12387 [DOI] [PMC free article] [PubMed] [Google Scholar]
- Jenuth JP, Peterson AC, Shoubridge EA (1997) Tissue-specific selection for different mtDNA genotypes in heteroplasmic mice. Nat Genet 16:93–95 [DOI] [PubMed] [Google Scholar]
- Kondo R, Satta Y, Matsuura ET, Ishiwa H, Takahata N, Chigusa SI (1990) Incomplete maternal transmission of mitochondrial DNA in Drosophila. Genetics 126:657–663 [DOI] [PMC free article] [PubMed] [Google Scholar]
- Larsson NG, Tulinius MH, Holme E, Oldfors A, Andersen O, Wahlstrom J, Aasly J (1992) Segregation and manifestations of the mtDNA tRNA(Lys) A→G(8344) mutation of myoclonus epilepsy and ragged-red fibers (MERRF) syndrome. Am J Hum Genet 51:1201–1212 [PMC free article] [PubMed] [Google Scholar]
- Liu VW, Zhang C, Nagley P (1998) Mutations in mitochondrial DNA accumulate differentially in three different human tissues during aging. Nucleic Acids Res 26:1268–1275 [DOI] [PMC free article] [PubMed] [Google Scholar]
- Manly B (1997) Randomization, bootstrap, and Monte Carlo methods in biology. Chapman & Hill, London [Google Scholar]
- Marchington DR, Hartshorne GM, Barlow D, Poulton J (1997) Homopolymeric tract heteroplasmy in mtDNA from tissues and single oocytes: support for a genetic bottleneck. Am J Hum Genet 60:408–416 [PMC free article] [PubMed] [Google Scholar]
- Marchington DR, Poulton J, Sellar A, Holt IJ (1996) Do sequence variants in the major non-coding region of the mitochondrial genome influence mitochondrial mutations associated with disease? Hum Mol Genet 5:473–479 [DOI] [PubMed] [Google Scholar]
- Melov S, Shoffner JM, Kaufman A, Wallace DC (1995) Marked increase in the number and variety of mitochondrial DNA rearrangements in aging human skeletal muscle. Nucleic Acids Res 23:4122–4126 [DOI] [PMC free article] [PubMed] [Google Scholar]
- Monnat RJ Jr, Loeb LA (1985) Nucleotide sequence preservation of human mitochondrial DNA. Proc Natl Acad Sci USA 82:2895–2899 [DOI] [PMC free article] [PubMed] [Google Scholar]
- Monnat RJ Jr, Reay DT (1986) Nucleotide sequence identity of mitochondrial DNA from different human tissues. Gene 43:205–211 [DOI] [PubMed] [Google Scholar]
- Pallotti F, Chen X, Bonilla E, Schon EA (1996) Evidence that specific mtDNA point mutations may not accumulate in skeletal muscle during normal human aging. Am J Hum Genet 59:591–602 [PMC free article] [PubMed] [Google Scholar]
- Parsons TJ, Muniec DS, Sullivan K, Woodyatt N, Alliston-Greiner R, Wilson MR, Berry DL, et al (1997) A high observed substitution rate in the human mitochondrial DNA control region. Nat Genet 15:363–368 [DOI] [PubMed] [Google Scholar]
- Piercy R, Sullivan KM, Benson N, Gill P (1993) The application of mitochondrial DNA typing to the study of white Caucasian genetic identification. Int J Legal Med 106:85–90 [DOI] [PubMed] [Google Scholar]
- Reynolds R, Walker K, Varlaro J, Allen M, Clark E, Alavaren M, Erlich, H. Detection of sequence variation in the HVII region of the human mitochondrial genome in 689 individuals using immobilized sequence-specific oligonucleotide probes. J Forensic Sci (in press) [PubMed] [Google Scholar]
- Shoffner J, Wallace D (1995) Oxidative phosphorylation diseases. In: Scriver C, Beaudet A, Sly W, Valle M (eds) The metabolic and molecular bases of inherited diseases. McGraw Hill, New York, pp 1535–1609 [Google Scholar]
- Sokal R, Rohlf F (1995) Biometry. WH Freeman, New York [Google Scholar]
- Sullivan KM, Hopgood R, Gill P (1992) Identification of human remains by amplification and automated sequencing of mitochondrial DNA. Int J Legal Med 105:83–86 [DOI] [PubMed] [Google Scholar]
- Wallace DC (1992) Mitochondrial genetics: a paradigm for aging and degenerative diseases? Science 256:628–632 [DOI] [PubMed] [Google Scholar]
- Wallace DC (1994) Mitochondrial DNA sequence variation in human evolution and disease. Proc Natl Acad Sci USA 91:8739–8746 [DOI] [PMC free article] [PubMed] [Google Scholar]
- Walsh PS, Metzger DA, Higuchi R (1991) Chelex 100 as a medium for simple extraction of DNA for PCR-based typing from forensic material. Biotechniques 10:506–513 [PubMed] [Google Scholar]
- Walsh PS, Varlaro J, Reynolds R (1992) A rapid chemiluminescent method for quantitation of human DNA. Nucleic Acids Res 20:5061–5065 [DOI] [PMC free article] [PubMed] [Google Scholar]
- Wilson MR, DiZinno JA, Polanskey D, Replogle J, Budowle B (1995a) Validation of mitochondrial DNA sequencing for forensic casework analysis. Int J Legal Med 108:68–74 [DOI] [PubMed] [Google Scholar]
- Wilson MR, Polanskey D, Butler J, DiZinno JA, Replogle J, Budowle B (1995b) Extraction, PCR amplification and sequencing of mitochondrial DNA from human hair shafts. Biotechniques 18:662–669 [PubMed] [Google Scholar]
- Zhang C, Linnane AW, Nagley P (1993) Occurrence of a particular base substitution (3243 A to G) in mitochondrial DNA of tissues of aging humans. Biochem Biophys Res Commun 195:1104–1110 [DOI] [PubMed] [Google Scholar]
- Zischler H, Geisert H, Castresana J (1998) A hominoid-specific nuclear insertion of the mitochondrial D-loop: implications for reconstructing ancestral mitochondrial sequences. Mol Biol Evol 15:463–469 [DOI] [PubMed] [Google Scholar]
- Zischler H, Geisert H, von Haeseler A, Pääbo S (1995) A nuclear “fossil” of the mitochondrial D-loop and the origin of modern humans. Nature 378:489–492 [DOI] [PubMed] [Google Scholar]
- Zouros E, Freeman KR, Ball AO, Pogson GH (1992) Direct evidence for extensive paternal mitochondrial DNA inheritance in the marine mussel Mytilus. Nature 359:412–414 [DOI] [PubMed] [Google Scholar]