

To the Editor:
The traditional transmission/disequilibrium test (TDT) and related tests (see Thomson 1995) require complete triads of genotyped cases plus both parents, in order to test for linkage disequilibrium in the presence of population admixture. A problem in empirical research is that some of the genotype measurements will usually be missing. These incomplete triads must be discarded to ensure the validity of the TDT (Curtis and Sham 1995). Recently, Weinberg (1999a) developed likelihood-ratio tests (LRTs) that used the expectation-maximization (EM) algorithm (Dempster et al. 1977), to use incomplete triads as well. Weinberg's tests capitalize on the fact that parent-child dyads may be informative about the genotype of the missing parent. For instance, if a child and a parent are both homozygous for the variant allele, the genotype of the missing parent should comprise at least one copy. Simulations showed that the EM-LRTs were more powerful than the traditional tests that exclude incomplete triads and that they recaptured much of the loss in information caused by missing parental genotypes.
The widespread use of this valuable approach, however, seems hampered by a lack of accessible software. Weinberg, for instance, used the commercial package GLIM, which is good and flexible software but not very user friendly (see remarks on their Internet site), and it requires programming in order to perform the EM-LRTs. To suggest an alternative, we discuss the script to perform Weinberg's tests (1999b) for linkage disequilibrium, maternal effects, or parent-of-origin effects in LEM, which is a program for log-linear analysis with missing data that uses the EM algorithm (Vermunt 1997a, 1997b). An important advantage of LEM is that, with this script, all the tests discussed by Weinberg (1999b) can readily be performed in the presence of all possible patterns of missing data, without programming work or the need to learn more LEM syntax. Furthermore, the program is optimized for rapid convergence with EM algorithm, and standard errors of the estimates, fit indices, and a number of appropriate tests are automatically reported in the output so that they do not have to be programmed separately. A final advantage is that the program (which has a DOS and a Windows version) and the manual can be downloaded free of charge on the Internet at the Web site for Methoden en Technieken van Onderzoek (mto).
With a biallelic locus assumed, the genotypes of the mother (M), father (P), and child (C) contain no copy, one copy, or two copies of the variant allele. If the D's are dummy variables (e.g., D(C=1) means that the variable is 1 in all triads in which C=1 and is 0 otherwise), then the log of the expected cell counts E(nMPC) of Weinberg's (1999b, see table 1) full model can be written as
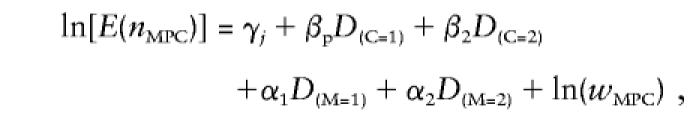 |
where eγj=μj are the mating-type–stratum effects (e is the natural exponent), eβp=Rp is the ratio of the risk of disease for genotypes with one copy versus no copies of the variant allele, eβ2=R2 is the risk ratio when the genotype comprises two versus no copies of the variant allele, eα1=S1 is the risk ratio or maternal effect when the mother has one copy versus no copies of the variant allele, and eα2=S2 is the risk ratio when the mother has two copies versus no copies of the variant allele. The wMPC are cell weights (this becomes clearer when the component is moved to the left-hand side of the equation, so that we obtain ln[E(nMPC)]-ln[E(wMPC)]=ln[E(nMPC/wMPC)] ), or, in GLIM terminology, ln(wMPC) is called the “offset.” The weights can have four different values. First, they can be 0. Because the expected counts in these cells have to be multiplied with eln(0)=0, the implication is that the cell frequencies are fixed at 0. This weight is therefore assigned to combinations—such as M=2, P=2, and C<2—that, for theoretical reasons, cannot occur. They are also useful in the context of recovery of information from incomplete triads. For example, if, in the situation described above, the genotype of the child is missing, the 0 weights for C<2 imply that the missing genotype must comprise two copies of the variant allele. Second, the weights can be 1, so that the expected cell counts are multiplied with eln(1)=1, implying that the frequencies as predicted by Rp, R2, S1, and S2 remain unaltered. Third, in the triads M=2, P=1, C=1; M=2, P=0, C=1; and M=1, P=0, C=1 (M > F), where the child receives the copy of the variant allele from the mother, the weights equal the “parent of origin” or “imprinting” effect Im. Because the models also specify a “main” effect eβp=Rp, the total effect of C=1 on the expected count becomes ImRp. It is a bit unusual to use parameters as weights. The cause is the triads consisting entirely of heterozygotes (M=P=C=1) for whom only the total cell count is observed, and it is unclear how many children receive the variant allele from the mother and how many from the father. As a result, the effect of C=1 on the cell count involves the sum of Rp+ImRp, which cannot be modeled in the usual way as products of effects. The effect of C=1 is therefore written as (1+Im)Rp, where (1+Im) is the cell weight that can be modeled as a sum of effects.
A LEM script that estimates this model in the presence of all possible patterns of missing genotypes is shown in the Appendix. The data are analyzed as a 3×3×3 table (indicated in the script by the last three numbers after the statement dim), defined by the three manifest (man 3) or measured genotypes of the mother, father, and child, labeled “M,” “P,” and “C,” respectively (see lab statement). The cell indices correspond to the number of copies of the variant allele plus one. Thus, the count of the triads M=0, P=2, C=1 falls into cell 1,3,2. The cells are numbered in increasing order, where the last indices change first (1,1,1; 1,1,2; 1,1,3; 1,2,1; 1,2,2; etc.). The statements mod and des are used to specify the model and parameters. The mod statement indicates the number of parameters and the margin of the table that is affected. For instance, fac(C,2) means that two parameters or main effects are estimated for the effects of the genotype of the child. The margin of C consists of three cells, and the des statement specifies how the parameters affect these cells. In this case, “012” means that (1) the effect in all cells where C=0 is 0, so that this category is used as the baseline; (2) the first parameter represents the effect in all cells where C=1 (βp ); and (3) the second parameter represents the effect in all cells where C=2 (β2). The mating-type stratum effects are defined by the specific combination of the maternal and paternal genotype and, therefore, pertain to the margin MP. Although there are 3×3=9 possible combinations, because of the assumed symmetry across parents within each mating type (e.g., M=1, P=2 and M=2, P=1 have equal effects) only six effects are estimated. LEM knows such a symmetric margin as the prespecified design 3a, so that with the use of the statement spe(MP,3a) there is no need for further specification in the des statement. The weights are combinations of constants and the imprinting parameter βm and are specified with the help of a latent variable X (statement lat 1), which has two discrete classes (the second number after the command dim). The effects of the first class are 0, implying an impact of e0=1 on the cell counts, and the effects of the second class are βm, corresponding with the imprinting parameter eβm=Im. Because only one parameter is estimated, and because this parameter is modeled as an effect of the second latent class, fac(X,1) is used in the model statement, and 0 1 is used in the design statement. The command wei(XMPC) means that the effects of the latent classes on the cell counts are mediated by the weight vector. The values for X=1 after the statement sta wei(XMPC) specify which of the 27 cells are affected by the first latent class (“0” means not affected, and “1” means affected), and the values for X=2 indicate the cells that are affected by the second latent class. For the combinations that cannot occur, two 0's are specified, so that the expected cell counts are multiplied with eln(wMPC)=eln(0×1+0×Im)=0×1+0×Im=0 . For the triads in which M > F, a value of 0 is specified for the first latent class, and a value of 1 is specified for the second latent class. This implies an effect of 0×1+1×Im=Im on the cell count. For the triads M=P=C=1, 1's are specified for both latent classes, so that the total impact becomes 1×1+1×Im=(1+Im). Note that, if the effect of the second latent class is fixed to 0 as well (no imprinting βm=0 and eβm=1), the weight becomes 1 for all combinations that can occur and becomes 2 for triads consisting entirely of heterozygotes.
Tests can be performed by merely changing the number of parameters in the mod statement plus the parameter specification in the des statement. For instance, to fit a model without imprinting, we would use fac(X,0) instead of fac(X,1) and 0 0 instead of 0 1. The output of LEM reports the log likelihoods plus a variety of other fit indices, parameter estimates, standard errors of the estimates, and comparisons between estimated and observed cell frequencies. To perform an LRT, one needs to take two times the difference between the log likelihoods of the full model and the model without imprinting. Because one parameter is fixed to 0, this statistic will be χ2 distributed with 1 df. A number of submodels are worth mentioning. If we assume that there are no imprinting and no maternal effects (fac(M,0) and that des = 000), then Schaid and Sommer's (1993) genotype relative-risk method is obtained, in which eβp=P1 and eβ2=P2. Recessive models βp=0, β2>0 can be specified by fac(C,1) and des [001], dominance models βp=β2 by fac(C,1) and des [011]. Although for polygenic traits it may be a somewhat coincidental situation (Van den Oord 1999), a gene-dosage model is obtained by imposing the constraint β2=2×βp by use of cov(C,1) and des [012]. Note that the command cov instead of fac must be used. The reason is that C is now treated as a covariate rather than as a nominal factor, because the expected cell frequencies are linear in C (if C=0, the effect is 0×βp; if C=1, the effect is 1×βp; and, if C=2, the effect is 2×βp). This latter test is asymptotically equivalent to the traditional TDT (Spielman et al. 1993), so that LEM also enables one to perform a variant of the TDT with incomplete triads.
The name after the command dat in the LEM script means that the data are in the file TEST.DAT. The number after rec shows that there are 100 triads. The data are in free format, with one record for each triad. The first two records are 333 and 101. The numbers indicate the cell to which the triad belongs, and 0's are used for missing genotypes. Thus, 333 pertains to a triad in which all three members have two copies of the variant allele (M=F=C=2 ), and 101 pertains to a triad in which the genotype of the father is missing and in which the mother, as well as the child, has 0 copies of the variant allele. There are seven possible data patterns. This is indicated by the first number after the command dim. To inform LEM about the nature of patterns, the statement sub is used. For example, MPC pertains to triads with nothing missing, MC to triads with the genotype of the father missing. Maximum-likelihood estimates are obtained by means of the EM algorithm. The E step of this iterative method is of the form
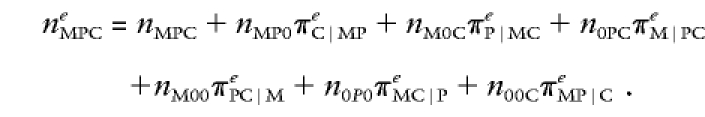 |
The 0's indicate that the genotype is missing, and superscript e indicates that the statistic is estimated and not observed. Thus, estimates of observed cell entries are computed with the use of the observed data plus the current estimates of the predicted cell frequencies that are made on the basis of the information from incomplete triads as well. In the M step of the EM algorithm, the predicted cell counts neMPC are treated as if they were really observed, to obtain new estimates of the log-linear parameters and of the cell frequencies. To speed up the estimation, the program is instructed to switch to Newton-Raphson after 10 iterations (command new). Convergence is usually reached in <1 s on an ordinary computer.
To examine whether the script worked properly, we first computed expected cell frequencies, using the full model. Fitting the script to these frequencies gave a perfect fit, and the correct parameters were recovered. Next, we simulated 1,000 samples of 100 triads in six different conditions for which missing paternal genotypes of 0%, 10%, 20%, 30%, 40%, and 50% were assumed. The data were simulated with the assumption of two completely segregated strata that were mixed, so that the sample comprised approximately equal proportions of triads from each stratum. Within the first stratum, the frequency of the disease allele was .10 and the disease risk was .01; within the second stratum, the frequency of the disease allele was .9 and the disease risk of .1 was 10 times greater. When data were simulated under the assumption of no genetic effects, the null hypothesis βp=β2=0 was rejected in 4.3%, 6.1%, 4.4%, 5.5%, 4.8%, and 4.9% of the 1,000 samples. Z-tests showed that none of the rejection rates differed significantly from the expected type 1 or alpha error of 5%. This showed that the tests for genetic effects were accurate, even in conditions under which the number of missing paternal genotypes was substantial. The whole simulation was repeated by generating the data with β2>0 assumed. The rejection rates of the null hypothesis or the power in the six conditions was 52.1%, 53.4%, 48.0%, 49.9%, 42.2%, and 43.8%. This confirmed results, reported by Weinberg (1999a), showing that, even with many incomplete triads, the EM LRT recaptures much of the loss in information.
The scripts for all the tests discussed in this article, sample data, and output can be downloaded from the first author's Internet site, Pedagogiek Utrecht. We should mention that Weinberg (1999b) proposed an alternative test for parent-of-origin effects that is also valid in situations in which the locus is a marker rather than a candidate gene. A script plus documentation for this parent-of-origin LRT can be found at that site as well.
Appendix:
The following LEM script estimates the full model reported by Weinberg (1999b, table 1). The numbers and text in boldface indicate the only instructions that need to be changed in order to perform significance tests and to adjust the data format to one's own data.

Electronic-Database Information
URLs for data in this article are as follows:
- KUB, Departement Methoden en Technieken van Onderzoek (mto), http://cwis.kub.nl/~fsw_1/mto_snw.htm#software
- Pedagogiek Utrecht, http://www.fss.uu.nl/ped/welcome.html
References
- Curtis D, Sham PC (1995) A note on the application of the transmission disequilibrium test when a parent is missing. Am J Hum Genet 56:811–812 [PMC free article] [PubMed]
- Dempster AP, Laird NM, Rubin DB (1977) Maximum likelihood from incomplete data via the EM algorithm. J R Stat Soc Serv B 39:1–22 [Google Scholar]
- Schaid DJ, Sommer SS (1993) Genotype relative risks: methods for design and analysis of candidate-gene association studies. Am J Hum Genet 53:1114–1126 [PMC free article] [PubMed]
- Spielman RS, McGinnis RE, Ewens WJ (1993) Transmission test for linkage disequilibrium: the insulin gene region and insulin-dependent diabetes mellitus (IDDM). Am J Hum Genet 52:506–516 [PMC free article] [PubMed]
- Thomson G (1995) Mapping disease genes: family-based association studies. Am J Hum Genet 57:487–498 [PMC free article] [PubMed]
- van den Oord EJCG (1999) A comparison between different designs and tests to detect QTLs in association studies. Behav Genet 29:245–256 [Google Scholar]
- Vermunt JK (1997a) LEM: a general program for the analysis of categorical data. Tilburg University, Tilburg, the Netherlands [Google Scholar]
- ——— Vermunt JK (1997b) Advanced quantitative techniques in the social sciences. Vol 8: Log-linear models for event histories. Sage, Thousand Oakes, CA [Google Scholar]
- Weinberg CR (1999a) Allowing for missing parents in genetic studies of case-parent triads. Am J Hum Genet 64:1186–1193 [DOI] [PMC free article] [PubMed] [Google Scholar]
- ——— (1999b) Methods for detection of parent-of-origin effects in genetic studies of case-parents triads. Am J Hum Genet 65:229–235 [DOI] [PMC free article] [PubMed] [Google Scholar]