

Abstract
The mouse mammary gland may undergo cycles of proliferation, terminal differentiation, tissue remodeling, and more importantly malignant transformation. Mammary epithelial stem cells and their progeny participate in these processes. Mammary epithelial stem cells are multipotent, exhibit properties of self renewal (up to 7 divisions) and may exist either as long-lived nondividing cells or as proliferating-differentiating cells. The focus of this study was to locate stem cells by identifying them as long-lived, label-retaining mammary epithelial cells (LRCs) in growth active (developing) or growth static (aged) mammary ducts. Initially, primary epithelial cells were pulse labeled with either fluorescent tracker dye and/or BrdU. Cells were then transplanted into cleared juvenile syngeneic mammary fat pads and held for 5 weeks or 8 weeks. In this study, we demonstrate that LRCs are stem cells and their progeny (transitional cells) are arranged as transitional units (TUs). Additionally, TUs are located every 250 ± 75 μm in ducts or in the terminal end bud 200–600 μm in diameter. Molecules expressed in TUs were Zonula Occludens-1 and α-catenin proteins which were significantly detected in 75%–91% (P < 0.001) of the LRCs cells that make up the TU. These data suggest that transitional units may be a group of label-retaining stem cells and maybe involved in the developmental or cancer process.
INTRODUCTION
One of the most interesting features of the mammary gland is the capacity to maintain an abundant supply of self renewing, undifferentiated stem cells [1, 2, 3, 4, 5, 6]. Mammary epithelial stem cells are believably the targets for the development of breast cancer. As reviewed by Potten and Loeffler [7], stem cells are long-lived undifferentiated cells with the capacity to proliferate, self maintain, produce significant quantities of differentiated progeny (i.e., mammary milk-secretory cells), re-establish tissue function after wounding or maintain the diversity in all four of these options. Thus far, very few reports have illustrated the location of stem cells in epithelial organs. Nevertheless, a model has been proposed [7] that suggests transit cells share similar replication and regenerative capacities with stem cells, but differ in their ability to acquire one or more differentiation markers [7].
In mice, the development of the mammary gland is orchestrated by a process of ductal branching that begins in utero, ceases at birth, and is then reestablished at puberty [8, 9, 10, 11, 12]. Following several hours post-puberty, a large bulbous invasive structure, the terminal end bud (TEB), located at the tip of the mammary duct, can be observed [11]. Several groups have demonstrated that the movement, development, and shape of the TEB are influenced by systemic ovarian hormones, local cytokine stimulus, and other molecules [11, 12, 13, 14]. Epithelial cell types that comprise the mammary duct or TEB have been identified through immunohistochemical and ultrastructure analysis [4, 12, 15, 16]. However, since these observations, only few reports have attempted manipulative or molecular studies to determine the location or expression of cells directly involved in the development of TEBs, ducts or microbreast lesions [13, 17, 18, 19, 20]. The focus of this study was to locate stem cells by identifying them as long-lived, label-retaining mammary epithelial cells (LRCs) in TEBs, and/or mammary ducts. This study was also undertaken to assess possible, differences in gene products between LRCs and other types of epithelial cells that form the duct. To accomplish this, a fluorescent labeling method was developed that pulse labels individual primary mammary epithelial cells with fluorescent TRITC-cell linker membrane label and BrdU. The labeled cells were transferred into the cleared mammary fat pads of syngeneic mice and held for 5 and 8 weeks before examining the position of label-retaining cells. We further probed for cell-cell junctional complexes α-catenin and Zonula Occluden-1 (ZO-1) and the milk proteins β-casein and whey acidic protein (WAP) to determine if these gene products are important intermediaries in establishing an elaborate communication link between LRCs and other cells of the TEB and/or duct [21, 22, 23, 24].
The results from these experiments indicate that LRCs are stem cells and progeny from these cells are arranged as transitional units (TUs) which can be located in terminal end buds 200–600 μm in diameter or every 250 ± 75 μm in ducts.
MATERIALS AND METHODS
Animals
Briefly, a total one hundred mice were used for the entire experiment (50 FVB/N and 50 C57 Bl6N) (NCI/FCRDC, Fredrick, MD). Twenty 3 week-old mice were used for transplantation recipients. Recipients were cleared of the host’s mammary epithelium prior to transplantation [3, 10, 17, 42]. Hosts were sacrificed at estrous by staging vaginal smears every four days [20].
Pulse-labeling and transplantation
For in vitro TLC labeling; TLC pulse labeled HC-11 cells were pulsed at 1 × 10⁶ cells with TLC label (2 × 10⁻⁶ of PKH26-GL) for 3 min and either plated in three 96 well plates or seeded onto 4 well plastic chamber slides (Nunc Inc, Naperville, IL). HC-11 cells were grown from 10–28 days in culture as previously described [26]. Cells were then fixed in 4% paraformaldehyde and counterstained with methyl green.
To pulse label mammary primary cultures with the fluorescent membrane marker, twenty 13 week-old mammary glands from either C57 Bl 6 or FVB/N mice were excised, collagenase digested (1 mg/ml, Sigma) for 12 h in serum free media plus DMEM/F12 [17, 42]. The primary culture was then centrifuged and resuspended into single cells. Fluorescent pulse labeling required pulsing single mammary epithelial cell and carrier inoculum (mammary fibroblasts at 1 × 10⁵) with TLC label (2 × 10⁻⁶ M of PKH26-GL, Sigma Biosciences) in cell linker diluent (Diluent C) for 3 min [27]. The reaction was then stopped with 2% FBS centrifuged twice and resuspended in serum free DMEM/F12 and prepared for transplantation. Transplantation of 1 × 10⁴ of pulsed mammary cells and fibroblast carrier inoculum was carried out as previously described [10, 17, 19]. Briefly, TLC labeled mammary cells were inoculated into the #4 inguinal mammary gland and nonlabeled mammary/fibroblasts were inoculated into the contralateral inguinal mammary gland. Mammary glands were previously cleared of the host’s epithelium prior to transplantation. 5-Bromodeoxyuridine (BrdU) labeling of S-phase mammary cells was carried 30 min post transplantation by supplying animals with 600 mg/ml BrdU in drinking water ad labium for 5 days [26].
Immunohistochemistry and immunofluorescence
Mammary glands were collected by removing the entire #4 inguinal gland, floated in OCT medium and allowed to freeze to −70°C. Mammary sections were sectioned from 7–20 μm and air dried in the dark for 4 h. Sections were blocked for 2 h at room temperature (rt). Anti-rat-BrdU (diluted at 1:50, Sigma Biosciences) was incubated with mammary sections at 4°C overnight. Washes in PBS were performed over a 30 min period involving at least 3 changes. Tissue sections were then incubated with biotinylated rabbit-anti-rat IgG (Sigma Biosciences) 2–3 h at rt. Sections were visualized with DAB (Vector Labs, Burlingame, CA) and counterstained with methyl green as previously described [17, 19].
Immunofluorescence was carried out in mouse mammary glands by removing the entire inguinal gland, stored in OCT medium and allowed to freeze to −70°C. Mammary sections were then sectioned and reacted with 5% blocking buffer for 1 h at rt. Sections were then incubated with either mouse monoclonal α-catenin (diluted at 1:1000) (Transduction Labs, Lexington, KY), mouse monoclonal β-catenin (diluted at 1:500) (Transduction Labs, Lexington, KY), mouse monoclonal E-cadherin (diluted at 1:1000) (Transduction Labs, Lexington, KY), rabbit anti-mouse casein (diluted at 1:250, kindly provided by Dr G. H. Smith, NCI, NIH) rabbit anti-mouse WAP (diluted at 1:50, kindly provided by Dr L. Hennighausen, NIDDK, NIH), or rabbit anti-human ZO-1 (diluted at 1:250) (Zymed Labs, San Francisco, CA). Following primary antibody incubation, fluorescent secondary antibodies anti-rabbit AMCA (1:250, Molecular Probes, Eugene, OR) or anti-mouse FITC (1:50, Boehringer Mannheim, Indianapolis, IN), were carried out at 4°C in the dark. After three washes in PBS, mammary sections were later counterstained with methyl green, mounted and subjected to confocal laser scanning microscopy.
In situ hybridization
Bright field in situ hybridization of OCT-embedded mammary sections were performed as described by Brietshopf et al. [25] and Friedmann et al. [28], using single stranded digoxingen-UTP labeled RNA probes (Genius 4/RNA Labeling Kit) (Boehringer Mannheim, Indianapolis, IN). Mammary sections were digested with 20 μg/ml proteinase K for 30 min [25], washed in PBS twice and blocked for 2 h at rt with 10% blocking serum/PBS. Digoxigenin-labeled RNA probes were prepared and isolated according to Friedmann et al. [28] and kit protocols (Boehringer Mannheim, Indianapolis, IN). The mouse α-catenin 3.45 kb Bam HI-EcoR I, mouse β-catenin 2.4 kb Kpn I-Bam HI, and mouse E-cadherin 2.52 kb Bam HI-EcoRI riboprobes were kindly provided by Dr O. Blashuck (McGill University, Montreal, Canada) and Dr L. Rimm (Yale University, New Haven, CT). Overnight incubation with hybridization mix was performed without rocking at 65°C. After rinsing with buffers [25] slides were incubated with anti-digoxigenin alkaline phosphatase (Boehringer Mannheim, Indianapolis, IN) visualized with NBT-BCIP (Sigma Biosciences), and counterstained with methyl green. Photographs were taken on an Olympus AH-2 Vanox-S microscope using NIH Image and transferred to a Macintosh Power Station. Images were further processed using Adobe Photoshop Software.
In situ hybridization of fluorescent labeled outgrowth were prepared the same as bright field image with the following modifications. Tissue sections were air dried for 4 h in the dark and digested with 20 μg/ml proteinase K/PBS for 30 min. Sections were then blocked with 10% sheep serum in PBS (1 h) before adding the hybridization mix. Hybridizations were carried out at 63°C overnight in the dark. After rinsing with buffers [25] and tissue reacted with anti-digoxigenin FITC (Boehringer Mannheim, Indianapolis, IN), mammary sections were washed with PBS, mounted in mounting medium and prepared for confocal laser microscopy.
Confocal scanning laser microscopy
TLC pulse labeled, in situ and/or immunostained mammary sections were examined with a Zeiss Axiovert 135 Confocal Laser Scanning Microscope equipped with a 15 mW Krypton-argon laser. Images were collected using a 20x or 40x fluorochrome immersion lens and were Kalmon filtered. The pinhole aperture was adjusted to the minimum setting in order to optimize z-axis resolution. In cases where in situ and immunostainable images were visualized, dual images using one fluorescent and one substage fiber optic device to detect another fluorescent channel was used. 3D laser sectioning consisted of 15–25 horizontal sections (X-Y) from 7–20 μm cut mammary sections and processed using Zeiss Image software. Patch size and intensity ratio were calculated by outlining each TLC labeled cell using NIH Image. In all specimens (tissue culture and tissue sections), the amount of TLC label intensity was categorized as either (+) dull (over 25% background), (++) mild (between 40%–60% over background) or (+++) bright (above 70% background). Images were then transferred to Macintosh Power Station where they were processed using Adobe Photoshop Software.
Scoring
Cell positivity was scored by the following method, a total of 5 random fields from each section were used for scoring. All fields that were scored contained more than 100 cells. The percentage of stained cells (positive cells stained brown or purple over green negatively stained cells) was calculated by dividing the number of stained cells by the total number of cells counted as previously described [17, 19]. The results from each field were compared using a two-way analysis of variance.
RESULTS
Pulse-labeling of mammary epithelial cells in vitro
In order to identify the location of stem cells as long-lived label-retaining mammary epithelial cells (LRCs) in the mammary duct in vivo, BrdU [29] and BKH26-GL [26], were utilized as tracking markers. PKH26-GL is a fluorescent cell linker compound (Excitation max = 551 nm, Emission max = 587) that incorporates aliphatic reporter molecules into the cell membrane by selective partitioning [26]. The cells can be visualized under the TRITC channel during immunofluorescence of confocal microscopy. The technology has been limited to a number of model systems in vitro and in vivo. The half-life of elution of PKH26 from rabbit red blood cells is greater than 100 days in vivo. Labeled cells usually vary from bright and uniform labeling to a punctuate or patchy appearance. In addition, the labeling is not a saturation reaction but a function of both dye and cell concentration, therefore 2x10⁻⁶M of linker was used in the experiment. Over-labeling of the cells would result in loss of membrane integrity and cell recovery. We have also evaluated the uniformity of staining, cell viability (by propidium staining), and the coefficient of variation of fluorescent peaks to maximize the optimum dye/cell kinetics [26, 29]. Initially, TRITC-cell linker labeled cells (TLC) were examined for labeling potential in vitro with the nontransformed immortalized mouse mammary epithelial HC-11 cell line. Cells were pulsed for 3 min with TLC and grown as single cells in 96 well plates for 5 days. Following cell fixation and histological counterstaining, the number of cell divisions which is inversely proportional to fluorescent signal was calculated using the image-based format developed by NIH Image. The data suggests that following the first 24 h of growth, cells lose 40% ± 10% of TLC signal after their first cell division (Figure 1). Following the second cell division, HC-11 cells lose an additional 20% of label until reaching basal levels (6–7 cell divisions) (P > 0.05). Similar results were also observed in pulse-labeled mammary epithelial primary cultures established from female FVB mice (Figure 1). The results suggest that the TLC method can be used to track the number of cell divisions in both mammary cell lines and mammary cell cultures in vitro.
Figure 1.

Graph depicting the number of divisions HC-11 cells undergo while losing TLC label. In cells that reached 5 ± 1 generations, over 80% of TLC label was lost. HC-11 cell morphologies (□) and C57BL/6N mouse primary epithelial cultures (□) that were scanned for fluorescent intensities and grown according to materials and methods. Inset, bright TLC labeled stem cell surrounded by differentiated progeny using IF (A), phase contrast (B) and bright field microscopy (C). Arrow in (C) represents pale counterstained stem cell. (D), Differentiated cell and its nearby differentiated daughter cell. (E), One of 4 differentiated HC-11 morphologies that can be labeled using the TRITC cell linker. Scale bars (A–E) 15 μm.
The location of long-lived label-retaining cells in TEBs and developing ducts
The location of LRCs in the mammary duct in vivo was assessed by two methods; first by transplanting TLC pulsed-labeled primary mammary epithelial cells into the cleared mammary fat pads of syngeneic hosts and second, immediately following surgery, animals were given BrdU ad labium for 5 days [29]. Hosts that received transplants were held for either 5 weeks to identify long-lived LRCs in TEBs or 8 weeks to identify the location of these cells in ducts. The initial results suggest that TLC-LRCs are located in the midductal region, subtending, at the tip of the mammary duct and in the TEB. In each of these areas, a significant percentage of bright TLC-LRCs were detected [50%, P < 0.001] (Table 1). Localization of bright BrdU-LRCs were also located in the same areas suggesting LRCs are positioned at distinct sites in the mammary gland. However, in several pulse-labeled outgrowth, several mammary ducts also failed to stain for either TLC or BrdU label (photomicrographs not shown). The explanation for these phenomena is unknown.
Table 1.
Expression of cell-cell molecules located in nonlabeled or pulse-labeled mammary glands.
| Pulse-labeled outgrowths* | ||||
| Nonlabeled glands | ||||
| Dull | Mild | Bright | ||
| mRNA % positive | ||||
| α-catenin | 49 ± 4 | 31 ± 10 | 42 ± 3 | 98 ± 1 |
| β-catenin | 69 ± 2 | 51 ± 26 | 50 ± 7 | 50 ± 7 |
| E-cadherin | 54 ± 4 | 46 ± 5 | 47 ± 10 | 50 ± 7 |
| Protein % positive | ||||
| α-catenin | 19 ± 4 | 22 ± 1 | 41 ± 8 | 75 ± 13 |
| β-catenin | 40 ± 6 | 42 ± 6 | 41 ± 8 | 27 ± 6 |
| E-cadherin | 47 ± 4 | 45 ± 7 | 45 ± 4 | 19 ± 2 |
| β-casein | 50 ± 7 | 46 ± 3 | 20 ± 3 | |
| WAP | 20 ± 3 | 25 ± 2 | E/N | |
| ZO-1 | 33 ± 3 | 50 ± 2 | 91 ± 8 | |
E/N represents expression near a bright TLC-LRC.
*LRC patch size and intensity ratio were calculated by outlining each BrdU or TLC labeled cell using NIH Image. LRC patch size equaled 7.5 μm2. Observations were generated by examining 5 random fields from C57Bl6N or FVB/N mammary sections. The amount of BrdU or TLC label intensity was categorized as either (+) dull (over 25% background at 4–8 cell divisions after initial pulse), (++) mild (between 40%–60% over background at 2–4 cell divisions after initial pulse) or (+++) bright (above 70% background at 1–2 cell divisions after initial pulse).
Arrangement of LRCs in TEBs and developing ducts
To examine the arrangement of LRCs along the mammary duct, portions of 5 week-old ducts and TEBs were assessed using 3-dimensional (3D) confocal microscopy. The results suggest that bright TLC-LRCs were detected at the tip of the TEB, and in areas of the subtending duct (Figure 2). Interestingly, TLC-LRCs also appeared to be grouped as aggregates or transitional units (TUs) (Figure 2 arrow). We further examined these units by 3D montage photography and determined that within the TU at least one bright LRC is usually in contact with another LRC by long thin processes referred to as cytonemes (photomicrographs not shown). Cytonemes, cellular processes that may span several cell diameters have been implicated in dispersing signaling proteins such as Hedgehog (Hh), Decapentaplegic (Dpp) and Wingless during Drosophila imaginal disc development or chick limb-bud development.
Figure 2.


Confocal 3D microscopic image of bright TRITC labeled-retaining cells in 5 week-old FVB/N TEB. (A) 3D microscopic image of bright TRITC labeled-retaining cells. Note the location of bright LRCs and a TUs (arrow). (B) Laser sections represent en face views of serial sections that were recorded at 0.7 μm intervals. Three dimensional image and optical serial sections were generated and processed according to materials and methods. Scale bars in (A), (B) 260 μm.
We also determined by 3D imaginary, the 3D arrangement of the TU. The transitional unit is comprised of LRCs at least 3 cells across and at least 3 cells deep (Figure 2). In addition, LRCs within the TU were also semi-quantiated to determine the number of cell divisions of each cell (cell history) in the unit. A total of 5 TUs (n > 10 cells) were examined. The data suggests that while LRCs within the TU retain significant levels of label above 68% (P < 0.001), cells outside the unit have significantly lower fluorescent label (near or below 33%) (P < 0.01). These data suggest that TUs contain stem cells and their progeny along various locations of the mammary duct.
Transitional units and the location of cell adhesion molecules in normal mammary glands
Stem cells depend upon cell-cell communication in order to undergo division [7]. Important intermediaries in this process are cell adhesion molecules such as α-catenin, E-cadherin, and ZO-1 [21, 22, 30]. To access the location of these molecules immunohistochemistry and in situ Hybridization were carried out in intact nonlabeled mammary glands. Upon examining differences in α-catenin expression in 6 week-old glands, approximately 49% of ductal epithelium expressed this gene (Figure 3A) (Table 1). Luminal cells arranged as transitional units in the TEB also expressed α-catenin mRNA (Figure 3A). α-catenin protein was also expressed in 6 week-old glands, but at very low levels (19%) (Figures 3B and 3C) (Table 1).
Figure 3.


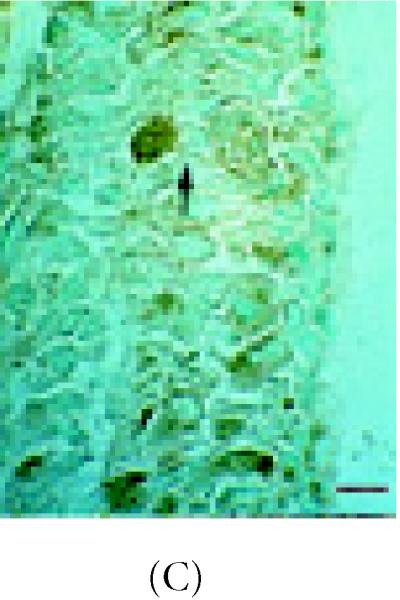


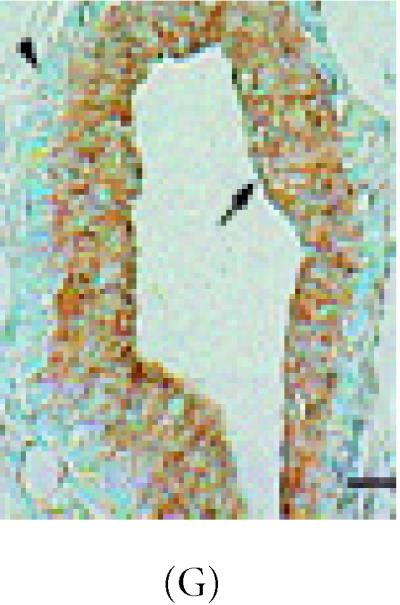
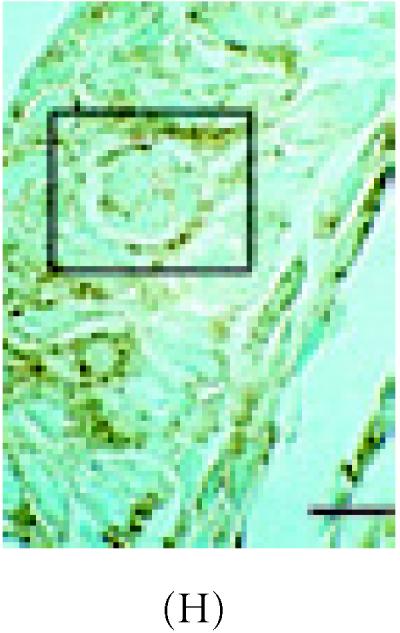
α-catenin, β-catenin, and E-cadherin expression in 6 week-old mammary glands. (A) Mammary section hybridized with digoxigenin-UTP-labeled probe for α-catenin mRNA. Note in end bud tip (ebt), fibroblasts (f), and luminal epithelium (le) express α-catenin. (B–C) Association of α-catenin protein expression and transitional unit (boxed areas) in the TEB. Note in (C), α-catenin expressing cell and cytoneme. (D) 6 week-old mammary section hybridized with digoxigenin-UTP-labeled probe for β-catenin mRNA. (E) β-catenin immunostaining outlines the luminal epithelial cell layer of the 6 week-old TEB. (F) 6 week-old mammary section hybridized with digoxigenin-UTP-labeled probe for E-cadherin mRNA. (G–H) E-cadherin immunostaining in 6 week-old glands. Note E-cadherin expression outlines the luminal epithelial cell layer of the 6 week-old TEB, but negative staining occurs in the transitional unit (boxed area). All sections were collected according to materials and methods. Insets in (A–B, D–G) control probed tissue, respectively. Scale bars (A–B) 50 μm, (C) 24 μm, (D–E) 50 μm, (F–G) 50 μm, and (H) 24 μm.
Further, β-catenin mRNA was detected in 69% of ductal epithelium in 6 week-old glands (Figure 3D) (Table 1). Adjacent stroma also expressed β-catenin mRNA. At the protein level, β-catenin was detected in the TEB (42%) but not in the outermost cell layer of the mammary duct which contain myoepithelial cells (Figure 3E) (Table 1). A similar expression pattern was also observed in aged 10 week-old ducts (data not shown).
E-cadherin mRNA was also detected in 47% of ductal cells from 6 week-old glands (Figure 3F) (Table 1). Stroma adjacent to ducts also expressed E-cadherin mRNA and E-cadherin protein but was not detected in the myoepithelium of the TEB (Figures 3F, 3G, and 3H) (Table 1).
Cell adhesion expression in pulsed-labeled mammary glands
The next set of experiments determined if cell adhesion molecules were associated with label-retaining stem cells by identifying these cells under immunofluorescence, immunohistochemistry, in situ Hybridization (ISH) or fluorescent in situ Hybridization (FISH). The results suggest that, α-catenin mRNA colocalized with 98% (P < 0.001) of brightly stained BrdU-LRCs cells which were positioned along the end bud (Figures 4A and 4B, Table 1). In comparison to nonlabeled mammary ducts, α-catenin mRNA was also detected in 40% (P < 0.01) of labeled ductal cells. In addition, the α-catenin protein was detected in 75% ± 2% (P < 0.001) of the epithelial cells of the TEB which clearly associated with TUs (Figures 4A and 4B) (Table 1, photomicrographs not shown). There were no significant correlations between β-catenin and E-cadherin expression with TUs or LRCs (P < 0.01) (Table 1). However, ZO-1 immunostaining was detected in 91% (P < 0.001) of the bright LRCs (Figures 5A and 5B) but was not as significant as α-catenin (P < 0.01) (photomicrographs not shown and summarized in Table 1).
Figure 4.


Colocalization of α-catenin mRNA, protein and BrdU/TLC positivity in 8 week-old C57 Bl6N aged mammary duct. (A–B) Detection of α-catenin mRNA (blue) and BrdU immunostaining (brown) in mammary ducts hybridized to a digoxigenin-UTP labeled α-catenin probe. (B) Area highlighted in (A) (arrow) under high magnification. Note brightly stained BrdU cells are arranged as TUs and appear to be located just proximal to the subtending duct. Inset in (B) represents control section for BrdU staining (secondary antibody alone). Scale bar in (A), 660 μm, and (B), 260 μm.
Figure 5.


Detection of ZO-1 protein and bright TLC-LRCs in the 8 week-old C57 Bl6N mammary duct. (A) Co-localization of ZO-1 protein (blue) and bright LRC (red). (B) High power magnification of area shown in (A) (arrow). Note bright LRCs and ZO-1 expression around the polarized cell borders. Upper inset in (B) TRITC-rhodamine channel (red) showing bright TLC-labeled cell (arrow) and lower inset, AMCA-UV channel showing ZO-1 protein expression. Scale bar in (A) 90 μm and (B) 190 μm.
Finally, to determine if the differentiation markers β-casein and WAP [23, 24] are expressed in LRCs, we collected 8 week-old samples obtained at estrous. The results indicate that at least 20% of the epithelial cells express either β-casein or WAP proteins. However, localization of these proteins to bright TLC LRCs was not observed (P > 0.05) (Table 1, photomicrographs not shown).
Anatomical position and distances of TUs along developing and aged mammary ducts
To determine the abundance, location, and distances of LRCs and TUs along the mammary duct, sections from both intact and transplanted mammary glands were examined. The procedure involved examining 60 ducts from mammary glands (n > 30) in C57Bl6 or FVB/N mice according to the materials and methods. The results suggest LRCs are sparsely located throughout the duct or TEB (Table 2). However, ducts 100–400 μm in length or TEBs 200–600 μm in diameter hold up to at least 2 TUs on either axis of the structure. In addition, we could not detect TUs in secretory lobule structures collected from virgin glands. These data are summarized in Table 2.
Table 2.
Location of LRCs and TUs in various ductal compartments.
| Ducts | |||||
| End bud tip | Duct | Subtending | Lobule | ||
| LRC* | ++ | +++ | +++ | + | |
| TU# | + | ++ | +++ | nd | |
| nu | − | ++ | +++ | nd | |
| TEB | |||||
| LRC* | +++ | +++ | +++ | N/A | |
| TU# | + | +++ | +++ | − | |
| nu | + | +++ | +++ | − | |
(+), mild detection, (++), weak detection, (+++), strong detection, (−), no detection
*summary of bright TLC LRCs only.
#summary of both BrdU-TUs and TLC-TUs.
nd, not detected at this time.
N/A represents no association.
nu, nonlabeled units visualized in normal intact mammary ducts under bright field microscopy by hematoxylin and eosin staining.
Observations were analyzed by examining 5 random fields from C57Bl6N or FVB/N mammary sections that contained either aged terminal ducts or TEBs according to materials and methods. Fluorescent intensity was calculated by outlining each LRCs using NIH Image. Patch size equaled 7.5 μm2.
DISCUSSION
Despite the extensive knowledge of molecules that can potentially regulate aberrant breast cancer growth or the detailed morphology-histology analysis of normal mammary development, the exact location of stem cells that can contribute to the formation and maintenance of the mammary duct remain obscure [6]. This is due in part to the failure of attempting to identify the location of single stem cells.
The transplantation approach is a valid approach to determine stem cell location. The transplantation of mammary epithelial cells into syngeneic mice recapitulates exactly the morphogenetic processes observed in intact animals and has been described by many Mammary Gland Biologists over 40 years (see [12]). In this study, we sought to investigate three different aspects never before determined in the mouse mammary gland. The first, was to devise a calorimetric microscopy assay to visualize mammary epithelial stem cells in vitro. This assay involved utilizing a fluorescent tracking die that effectively couples to the membrane of single cells dispersed in culture. The method has been used to label stem cells such as precursor hemopoetic cells in situ (Horan et al. [30]) and was modified to label in vitro, an immortalized nontransformed mammary epithelial cell line (HC-11) known to posses subpopulations of mammary stem cells. After labeling, single cells were seeded into 96 well plates and the morphology, fluorescent intensity, and ontogeny were recorded over time. The in vitro data yielded significant results. We determined that fluorescent label was lost in all differentiated cells after each successive division but was not retained in cells that underwent infrequent cell division. Upon examining these cells after counterstaining with methyl green these cells did not retain counterstain, exhibited stem cell-like morphologies (Smith et al. [16]), and gave rise to 4 different HC-11 cell morphologies over time (see inset Figure 1). The results suggest that we have established a fluorescent based assay that can label and distinguish between mammary epithelial stem cells and mammary epithelial differentiated cells in vitro. Continuing, the second aspect was to develop a microscopic assay that can determine the location of mammary epithelial stem cells using both light microscopy and fluorescent. The principle of the double-labeling assay rests on the transplantation of fluorescent-labeled single cells into cleared syngeneic fat pads and following post-surgery, animals are pulsed-labeled with BrdU for 5 days and chased for 5 to 8 weeks. The predication behind this postulate is the understanding that as the transplanted cells begin to develop mammary ducts, massive cell division, terminal differentiation, migration, selection, apoptosis, or ankois are taking place as early as day 1 of transplantation and cease around 8 weeks post-transplantation. During these periods, within each mammary duct, cell seclusion, or cells that are protected from these environments retain label and are therefore easy to dissociate under bright field microscopy (in the case of BrdU positivity) or under fluorescence (in the case of TRITC labeling). We have found that both tracers are easy to distinguish under the microscope and were located in similar glandular locations suggesting label-retaining mammary epithelial stem cells can be detected in vivo. The final aspect of this study was to describe the 3-dimensional landscape in which label-retaining mammary epithelial stem cells are located in the mammary duct. These observations would determine if mammary epithelial stem cells are situated in cell arrangements similar to the crypts of the intestine, integument, liver, or lung. We report that confocal 3-dimensional montage images of mammary epithelial cells are arranged within a cluster of differentiated cells or “transitional unit” and that these units are spatially spread throughout various areas of growing and or aged mammary ducts. There are a number of known caveats in vivo and in vitro of why label-retaining cells appeared in our results. The first caveat, infrequent cycling stem cells is one main finding. The second, the absence of normal apoptotic processes by which cells retain label is in question since cells that developed these outgrowths histologically grew out normal, where found to colocalize BrdU, counterstained as normal shaped pale cells, and where spatially located in various compartments of the duct. In normal syngeneic animals, normal apoptotic processes usually result in normal outgrowths. Therefore, we have ruled out this possibility. Third, the checkpoint arrested cells as a source for label-retaining cells in vivo and in vitro. Checkpoint arrested cells are cells that fail to reach the next cycle in cell division. If LRCs were checkpoint defective, these cells would not be able to divide and provide progeny that contribute to the development of the outgrowth. Therefore, we disagree with this possibility. Finally, terminally differentiated cells as a source of label-retaining cells in the outgrowths. We agree to an extent. The in vitro experiments suggested an initial pulse of the TLC tracking dye to terminally differentiated primary mammary epithelial cells or HC-11 cells can be visualized in vitro. However, transplantation of single primary terminally differentiated cells into cleared fat pads results in (a) terminally differentiated mammary cells that lack the cellular machinery to give rise to progeny that form a complete duct (see Daniel et al. [3]), (b) terminally differentiated cells are enlarged highly vacuolated dark-counterstained cells, and (c) in the breast, terminally differentiated cells are cells that have undergone milk-production and therefore would have been expressing WAP and casein proteins and further, would have generated outgrowths consisting entirely of secretory structures (Kordon et al. [24]). Therefore, we have ruled out this possibility. The results of our present study indicate that transitional units contain stem cells and play an integral role in the growth and differentiation of the mammary duct.
Formation of the mammary tree: multidimensional ductal growth and positioning
The mammary duct is an epithelial structure where large discontinuities in architectural information are spatially maintained. In adult female mice, the mammary trees from each of the ten normal mammary glands are anatomically asymmetrical to one another. However, a number of adjacent structures (lobules, alveolus, and lateral buds) are spatially located along the left-right axis of the mammary duct. Positioning of these structures reflect matrix protease production, molecules that influence the direction of newly forming lateral buds/secretory structures [17, 19, 31, 32, 33], or matrix components that control the configuration of the developing duct [17, 19, 31, 32, 33, 34, 35]. The present study shows that the cell adhesion molecules α-catenin, β-catenin, and E-cadherin are spatially expressed in the duct suggesting these molecules may act as intraductal morphoregulators as well. However, the shape, direction, and function of the duct may also reflect the potential location of the stem cell compartment and steroid receptor positivity [11]. This was demonstrated earlier by Hoshino [2], who observed that transplanted portions of the mammary duct contain positional and differential information with a basic repeat. Daniel et al. [3] followed these findings and observed that transplanted normal mammary outgrowths that grew out maximally usually were the oldest. In addition, outgrowths that displayed average ductal expansion differed in transplant ability suggesting, pockets of epithelial proliferation within a single duct maybe heterogeneous. Subsequently, Smith [36] observed, that within a random population of primary mammary epithelial cells, there exists at least 1 mammary stem cell per 1000 cells which has the capacity to form a complete mammary tree. Since we located TUs every 250 + 75 μm along the duct, it is quite possible as long as TUs are available ductal structures will continue to be transplantable.
The intricacy of the transitional unit
How can we safely imply that such a unique structure like the TU is not composed entirely of mammary epithelial stem cells? Early investigators have described groups of cells or aggregates as a “patterned field” [43] or as Leighton et al. [38] suggested, “a more specific biological unit” or “an aggregate may be a loosely knit, short-lived ecological unit or a supercellular living organism a distinct individual. Aggregates may affect one another in several ways such as adjacent cells providing part of the physical substrate for the migration of a cell within the aggregate, or by sharing a common pool of both substrates and products of metabolism.“ In line with this rationale, previous results have indicated that nodules or aggregates from X-irradiated intestine from inactivated mosaic phosphoglycerate kinase mice (PgK-1b/PgK-1a) give rise to PgK-1b or PgK-1a absorptive epithelial, goblet, or entero-endocrine cells [39]. Reynolds and Weiss [40] also described that in cultures of embryonic striatum, EGF-induced proliferation of single precursor cells give rise to spheres of undifferentiated cells that later divide into three CNS cell types, neurons, astrocytes, or oligodentrocytes. In the breast, detection of clonegenic epithelium has been observed by histological assays [4] or by detection of X-chromosome inactivation, where, for example, the normal mammary tree potentially contains contiguous patches of clonegenic epithelium [40]. In this context, we suggest that TUs reflect groups of transit cells with stem cells intermixed among them. Our major argument is that although transit cells are the direct progeny of long-lived stem cells, they cannot maintain the same level of self-maintenance [7]. The main function of transit cells is to progress to a more mature or differentiated state by acquiring one or more differentiated markers [7]. In the breast, units of transit cells may operate at a programmed site along the mammary duct or TEB by providing proliferating or differentiated progeny. Control of the TU is modulated by both differentiated cells positioned proximal to the unit or cellular cues housed within cynonemes (Figure 6). Interestingly, units or aggregates depend on α-catenin, E-cadherin and ZO-1 interactions [29, 41]. Recent data has shown that when E-cadherin/α-catenin negative PC9 lung carcinoma cells are transfected with α-N-catenin, single cells arrange themselves as aggregates; patterns of closed spheres with an expanded lumen. When these spheres are incubated with anti-E-cadherin neutralizing antibodies, the spheres completely dissociate back into single cells [37]. In this study, a fluorescent labeling method was developed to visualize mammary stem cells transplanted into syngeneic fat pads. We also show that α-catenin is expressed in stem cells and their progeny which together form a stem cell niche or unit that is associated with normal or aberrant breast growth. Further examination of these areas using laser micro dissection is now underway.
Figure 6.

Model for transitional unit operation within the mammary duct. Shortly after puberty, estrous or nursing, stem cells or transit cells (yellow) committed to acquire additional differentiation markers are positioned within the unit. Positioning (morphogenic movement) cell-cell communication (acquisition of differentiation markers), or proliferation requires modulation of α-catenin, β-catenin, ZO-1 or E-cadherin expression and cytonemes (pink). Next, accumulation of differentiation markers, β-casein and E-cadherin are acquired (blue and gray), and finally, these cells become active secretory epithelium by expressing differentiation markers such WAP (green).
Acknowledgments
ACKNOWLEDGEMENT
The authors would like to gratefully thank Dr Charles Daniel (UC-Santa Cruz) and Dr Daniel Medina (Baylor College of Medicine) for the years of technical suggestions regarding this project. The authors would also like to thank Dr Paul Nettesheim (NIEHS/NIH Research Triangle Park, NC) for his comments on the initial approach.
References
- Dabelow A. Die Milchdruse. In: Bargmann W, editor. Handbuch der mikroskopischen Anatomie des Menschen Part 3. Vol. 3. Haut und Sinnesorgane; 1957. pp. 277–485. [Google Scholar]
- Hoshino K. Regeneration and growth quantitatively transplanted mammary glands of normal female mice. Anat Rec. 1964;150:221–236. doi: 10.1002/ar.1091500303. [DOI] [PubMed] [Google Scholar]
- Daniel CW, DeOme KB, Young JT, Blair BP, Faulkin LJ. The in vivo lifespan of normal and preneoplastic mammary glands: a serial transplantation study. Proc Natl Acad Sci USA. 1968;61:52–60. doi: 10.1073/pnas.61.1.53. [DOI] [PMC free article] [PubMed] [Google Scholar]
- Pierce GB, Nakane A, Martinez-Hernandez A, Ward JM. Ultrastructural comparison of differentiation of stem cells of murine adenocarcinoma of colon and breast with their normal counterparts. J Natl Cancer Inst. 1977;58:1329–1345. doi: 10.1093/jnci/58.5.1329. [DOI] [PubMed] [Google Scholar]
- Bennett DC, Peachey LA, Durbin H, Rudland PS. A possible mammary stem cell line. Cell. 1978;15:283–298. doi: 10.1016/0092-8674(78)90104-6. [DOI] [PubMed] [Google Scholar]
- Medina D, Smith GH. In search of mammary stem cells. Protoplasma. 1990;159:77–84. [Google Scholar]
- Potten CS, Loeffler M. Stem cells: attributes, cycles, spirals, pitfalls and uncertainties. Lessons from the crypt. Development. 1990;110:1001–1020. doi: 10.1242/dev.110.4.1001. [DOI] [PubMed] [Google Scholar]
- Nandi S. Endocrine control of mammary gland development and function in the C3H/He Crgl mouse. J Natl Cancer Inst. 1958;21:1039–1063. [PubMed] [Google Scholar]
- Lyons WR. Hormonal synergism in mammary growth. Proc R Soc Lond B Biol Sci. 1958;149:303–325. doi: 10.1098/rspb.1958.0071. [DOI] [PubMed] [Google Scholar]
- DeOme KE, Faulkin LJ, Bern HA, Blair PB. Development of mammary tumors from hyperplastic alveolar nodules transplanted into gland free fat pads of C3H mice. Cancer Res. 1959;14:515–525. [PubMed] [Google Scholar]
- Williams J, Daniel CW. Mammary ductal elongation: differentiation of myoepithelium and basal lamina during branching morphogenesis. Dev Biol. 1983;97:274–290. doi: 10.1016/0012-1606(83)90086-6. [DOI] [PubMed] [Google Scholar]
- Daniel CW, Silberstein GB. Development, Regulation, and Function. In: Neville MC, Daniel CW, editors. The Mammary Gland. New York Plenum Press; New York, NY: 1987. pp. 3–36. [Google Scholar]
- Kenney NJ, Dickson RB. Growth factor-sex steroid interactions in breast cancer. J Mammary Gland Biol Neoplasia. 1996;1:189–198. doi: 10.1007/BF02013642. [DOI] [PubMed] [Google Scholar]
- Russo IH, Russo J. Mammary gland neoplasia in long-term rodent studies. Environ Health Perspect. 1996;104:938–967. doi: 10.1289/ehp.96104938. [DOI] [PMC free article] [PubMed] [Google Scholar]
- Sonnenberg A, Daams H, VanderValk MA, Hilkens J, Hilgers J. Development of mouse mammary gland: identification of stages in differentiation of luminal and myoepithelial cells using monoclonal antibodies and polyvalent antiserum against keratin. J Histochem Cytochem. 1986;34:1037–1043. doi: 10.1177/34.8.2426332. [DOI] [PubMed] [Google Scholar]
- Smith GH, Mehrel T, Roop DR. Differential keratin gene expression in developing, differentiating, preneoplastic, and neoplastic mouse mammary epithelium. Cell Growth Differ. 1990;1:161–170. [PubMed] [Google Scholar]
- Kenney NJ, Smith GH, Rosenberg K, Cutler ML, Dickson RB. Induction of ductal morphogenesis and lobular hyperplasia by amphiregulin in the mouse mammary gland. Cell Growth Differ. 1996;7:1769–1781. [PubMed] [Google Scholar]
- Humphries RC, Krajewska M, Krnacik S, et al. Apoptosis in the terminal end bud of the murine mammary gland: a mechanism of ductal morphogenesis. Development. 1996;122:4013–4022. doi: 10.1242/dev.122.12.4013. [DOI] [PubMed] [Google Scholar]
- Kenney NJ, Smith GH, Johnson M, Rosenberg K, Salomon DS, Dickson RB. Cripto-1 activity in the intact and ovariectomized mouse mammary gland. Pathogenesis. 1997;1:157–171. [Google Scholar]
- Smith GH, Medina D. A morphologically distinct candidate for an epithelial stem cell in the mouse mammary gland. J Cell Sci. 1988;89:173–183. doi: 10.1242/jcs.90.1.173. [DOI] [PubMed] [Google Scholar]
- Chepko G, Smith G. Three division-competent structurally distinct cell populations contribute to murine mammary epithelial renewal. Tissue Cell. 1977;29:239–253. doi: 10.1016/s0040-8166(97)80024-9. [DOI] [PubMed] [Google Scholar]
- Zeps N, Bentel JM, Papadimitriou JM, D'Antuono MF, Dawkins HJS. Estrogen receptor negative epithelial cells in mouse mammary gland development and growth. Differentiation. 1998;62:221–226. doi: 10.1046/j.1432-0436.1998.6250221.x. [DOI] [PubMed] [Google Scholar]
- Zeps N, Dawkins H, Papadimitriou JM, Redmond SL, Walters MNI. Detection of a population of long lived cells in mammary gland epithelium of the mouse. Cell Tissue Res. 1996;286:525–536. doi: 10.1007/s004410050722. [DOI] [PubMed] [Google Scholar]
- Kordon EC, McKnight RA, Jhappan C, Hennighausen L, Merlino G, Smith GH. Ectopic TGFb1 expression in the secretory mammary epithelium induces senescence of the epithelial stem cell population. Dev Biol. 1995;168:47–61. doi: 10.1006/dbio.1995.1060. [DOI] [PubMed] [Google Scholar]
- Brietshopf F, Suchanek G, Gould MR, Colman DR, Lassman H. In situ hybridization with digoxigenin-labeled probes: sensitive and reliable detection method applied to myelinating rat brain. Acta Neuropathol (Berl) 1992;84:581–587. doi: 10.1007/BF00227734. [DOI] [PubMed] [Google Scholar]
- Ton TT, Foley JF, Flagler ND. Feasibility of administering 5′Bromo-2-Deoxyuridine (BrdU) in drinking water for labeling S-phase hepatocytes in mice and rats. Tox Methods. 1997;7:123–136. [Google Scholar]
- Smith GH, Vonderhaar B, Graham DE, Medina D. Expression of pregnancy-specific genes in preneoplastic mouse mammary tissues from virgin mice. Cancer Res. 1984;44:3426–3437. [PubMed] [Google Scholar]
- Friedmann Y, Daniel CA, Strickland P, Daniel CW. Hox genes in normal and neoplastic mouse mammary gland. Cancer Res. 1994;54:5981–5985. [PubMed] [Google Scholar]
- Rajasekaran AK, Hojo M, Huima T, Boulan-Rodriguez E. Catenins and zonula occludens-1 form a complex during early stages in the assembly of tight junctions. J Cell Bio. 1996;132:451–463. doi: 10.1083/jcb.132.3.451. [DOI] [PMC free article] [PubMed] [Google Scholar]
- Horan PK, Melnicoff MJ, Jensen BD, Slezak SE. Fluorescent cell labeling for in vivo and in vitro cell tracking. In: Darzynkiewicz Z, Crissman A, editors. Methods in Cell Bio. Vol. 33. Academic Press; New York, NY: 1990. pp. 469–490. [DOI] [PubMed] [Google Scholar]
- Daniel CW, Silberstein GB, Van Horn K, Strickland P, Robinson S. TGF beta-1 induced inhibition of mouse mammary ductal growth: developmental specificity and characterization. Dev Biol. 1989;135:20–30. doi: 10.1016/0012-1606(89)90154-1. [DOI] [PubMed] [Google Scholar]
- Silberstein GB, Daniel CW, Coleman S, Strickland P. Epithelium-dependent induction of mouse mammary gland extracellular matrix by TGF beta-1. J Cell Biol. 1990;110:2209–2219. doi: 10.1083/jcb.110.6.2209. [DOI] [PMC free article] [PubMed] [Google Scholar]
- Bissell MJ, Hall HG. Form and function in the mammary gland. In: Neville MC, Daniel CW, editors. The Mammary Gland. Plenum Press; New York, NY: 1987. pp. 97–147. [Google Scholar]
- Bissell MJ, Hall HG, Parry G. How does the extracellular matrix direct gene expression? J Theor Biol. 1982;99:31–68. doi: 10.1016/0022-5193(82)90388-5. [DOI] [PubMed] [Google Scholar]
- Silberstein GB, Daniel CW. Glycoaminoglycans in the basal lamina and extracellular matrix of the developing mouse mammary duct. Dev Biol. 1983;90:215–222. doi: 10.1016/0012-1606(82)90228-7. [DOI] [PubMed] [Google Scholar]
- Smith GH. Experimental mammary epithelial morphogenesis in an in vivo model: evidence for distinct cellular progenitors of the ductal and lobular phenotype. Breast Caner Res Treat. 1996;39:21–31. doi: 10.1007/BF01806075. [DOI] [PubMed] [Google Scholar]
- Hirano S, Kimoto N, Shimoyama Y, Hirohashi S, Takeichi M. Identification of neural α-catenin as a key regulator of cadherin function and multicellular organization. Cell. 1992;70:293–301. doi: 10.1016/0092-8674(92)90103-j. [DOI] [PubMed] [Google Scholar]
- Leighton J. Academic Press; New York, NY: 1967. In The spread of Cancer. [Google Scholar]
- Inoue M, Imada M, Fukushima Y, et al. Macroscopic intestinal colonies of mice as a tool for studying differentiation of multipotential intestinal stem cells. Amer J Pathology. 1988;132:49–58. [PMC free article] [PubMed] [Google Scholar]
- Reynolds BA, Weiss S. Clonal and population analyses demonstrate that an EGF-responsive mammalian embryonic CNS precursor is a stem cell. Dev Biol. 1996;10:1–13. doi: 10.1006/dbio.1996.0090. [DOI] [PubMed] [Google Scholar]
- Tsai YC, Lu Y, Nichols PW, Zlotnikov G, Jones PA, Smith HS. Contiguous patches of normal human mammary epithelium derived from a single stem cell: implications for breast carcinogenesis. Cancer Res. 1996;56:402–404. [PubMed] [Google Scholar]
- Kenney N, Hosick H, Herrington G, Smith GH. The aged mouse mammary gland. In: Mohr V, Dungworth L, Ward J, Capen CC, Carlton W, Sunberg J, editors. Pathobiology of the Aging Mouse. Vol. 2. ICSI Press; Washington, DC: 1996. pp. 369–379. [Google Scholar]
- Weiss P. Functional adaptation and the role of ground substances in development. Am Nat. 1933;67:322–340. [Google Scholar]