Abstract
Adenovirus-induced hyperleptinemia causes rapid disappearance of body fat in normal rats, presumably by up-regulating fatty acid oxidation within white adipocytes. To determine the role of peroxisomal proliferation-activated receptor (PPAR)α expression, which was increased during the rapid loss of fat, we infused adenovirus–leptin into PPARα−/− and PPARα+/+ mice. Despite similar degrees of hyperleptinemia and reduction in food intake, epididymal fat pad weight declined 55% in wild-type but only 6% in PPARα−/− mice; liver triacylglycerol fell 39% in the wild-type group but was unchanged in PPAR−/− mice. Carnitine palmitoyl transferase-1 mRNA rose 52% in the wild-type mice but did not increase in PPARα−/− mice. PPARγ coactivator-1α rose 3-fold in the fat and 46% in the liver of wild-type mice but was unchanged in PPARα−/− mice. Although AMP-activated protein kinase could not be implicated in the lipopenic actions of hyperleptinemia, acetyl CoA carboxylase protein was reduced in the liver of wild-type but not in PPARα−/− mice. Thus, in PPARα−/− mice, up-regulation of carnitine palmitoyl transferase-1 mRNA in fat, down-regulation of acetyl CoA carboxylase in liver, and up-regulation of PPARγ coactivator-1α mRNA in both tissues are abolished, as is the reduction in their triacylglycerol content.
Sustained hyperleptinemia induced in normal rats by adenovirus transfer of the leptin cDNA results in virtually complete disappearance of body fat within 7 days (1, 2). The loss of fat is unique in its rapidity and magnitude and, remarkably, it is unassociated with any increase in plasma free fatty acid or ketone levels. This surprising fact led to the proposal that the fat-storing white adipocytes had been transformed by hyperleptinemia into fat-burning cells, i.e., that fatty acids were being oxidized inside the adipocytes (3). The expression profiles of enzymes of fatty acid metabolism in the disappearing white adipose tissue (WAT) were, in fact, consistent with this idea. The transcription factors and enzymes of lipogenesis in WAT were profoundly reduced, whereas those involved in fatty acid (FA) oxidation, including peroxisome proliferator-activated receptor (PPAR)α, were higher than normal (2). In addition, the mRNA and protein of uncoupling proteins UCP-1 and -2, not normally expressed in WAT, were increased (4). The mRNA of peroxisome proliferator-activated receptor γ coactivator (PGC)-1α (5), also not normally expressed in WAT, was up-regulated (6). These radical changes implied that fat-storing white adipocytes had become “fat-burning” adipocytes.
The prominent increase in the expression of PPARα in WAT (6, 7) suggested that it might be a proximal mediator of leptin action and, by up-regulating its target enzymes of FA oxidation, carnitine palmitoyl transferase (CPT)-1 and acyl CoA oxidase (ACO), play a role in the disappearance of adipocyte fat. In addition, it seemed possible that PPARα might be involved in other changes in the expression profile of the overleptinized rats, such as the up-regulation of UCP-1 and -2 and of PGC-1α and the down-regulation of lipogenic transcription factors and enzymes. To test these possibilities, we compared the effect of adenovirus-induced hyperleptinemia on the phenotype and expression profile of PPARα-null mice and wild-type controls. We also examined the potential link of these leptin-induced changes to leptin-mediated modulation of the activity of the AMP-activated protein kinase (8).
Materials and Methods
Animals.
Four groups of PPARα−/− mice were studied at 8 weeks of age. All mice received standard rodent chow (Teklad, Madison, WI) ad libitum and had free access to water. All institutional guidelines for animal care and use were followed. Food intake and body weight were measured daily.
Recombinant adenovirus containing the leptin cDNA (AdCMV-leptin) and β-galactosidase cDNA (AdCMV-β-gal) were prepared as previously described (1). One hundred microliters of AdCMV-leptin or -β-gal containing a total of 4 × 10¹⁰ plaque-forming units was injected into the left carotid artery under sodium pentobarbital anesthesia. Mice were killed 7 days later. Blood samples were collected from the jugular vein, and tissues were dissected and frozen in liquid nitrogen.
Plasma Measurements.
Plasma triacylglycerol (TG) levels were measured by the GPO-Trinder triglyceride kit (Sigma). Plasma leptin and insulin were assayed with the Linco leptin and insulin kits (Linco Research Immunoassay, St. Charles, MO).
Quantitative Real-Time PCR.
Total RNA was extracted by the Trizol isolation method according to the manufacturer's protocol (Life Technologies, Gaithersburg, MD). Total RNA (3 μg) was treated with RNase-free DNase (Promega), and first-strand cDNA was generated with the random hexamer primer in the first-strand cDNA synthesis kit (CLONTECH). Specific primers for each gene (Table 1) were designed by using primer express software (PE Biosynthesis). The real-time PCR reaction contained in a final volume of 10 μl, 20 ng of reverse transcribed total RNA, 167 nM forward and reverse primers, and 2× PCR master mix (no. 4312704, PE Biosystems). PCR reactions were carried out in 384-well plates by using the ABI Prism 7900HT Sequence Detection System (PE Applied Biosystems). All reactions were done in triplicate. The real-time amount of all mRNA was calculated by using the comparative cycle time method (User Bulletin No. 2, PE Biosystems). β-Actin mRNA was used as the invariant control for all studies.
Table 1.
Primer sequences of genes used for quantification of mRNAs by real-time PCR
| Gene | GenBank accession no. | Sequence of forward and reverse primers | Probes |
|---|---|---|---|
| β actin | NM 031144 | 5′-GTGAAAAGATGACCCAGATC-3′ | 5′-CAGCCATGTACGTGCCATCCAGGCT-3′ |
| 5′-CACCGCCTGGATGGCTACGT-3′ | |||
| ACO | J 02752 | 5′-AGCTCCGATCAGCCAGACAT-3′ | 5′-ATGCTGGGCCTACAGGTGTGCGC-3′ |
| 5′-TTCTTGAAACAGAGCCCAGAATG-3′ | |||
| CPT-1 | U 88294 | 5′-ACCACTGGCCGAATGTCAAG-3′ | 5′-CGTCCTCTTTGGTACAGGGCTCTGGG-3′ |
| 5′-AGCGCGTAGCGCATGGTCAT-3′ | |||
| ACC | J 03808 | 5′-ATATGTTCGAAGAGCTTATATCGCCTAT-3′ | 5′-AGCATCGCCAGCTTAAGGACAACACCT-3′ |
| 5′-TGGGCAGCATGAACTGAAATT-3′ | |||
| UCP-2 | AF 03933 | 5′-TTGCCCGAATGCCATTG-3′ | 5′-TGACCTCATCAAAGATACTCTCCTGAAAGCCAAC-3′ |
| 5′-GCAAGGGAGGTCGTCTGTCA-3′ | |||
| PPARα | NM013196 | 5′-CTGCAGAGCAACCATCCAGAT-3′ | 5′-CACCTTCCTCTTCCCAAAGCTCCTTCA-3′ |
| 5′-GTGACCTTCGATTATGCGATCA-3′ | |||
| PPARγ | NM013124 | 5′-ATGCCAAAAATATCCCTGGTTTC-3′ | 5′-CCAAGTGACTCTGCTCAAGTATGGTGTCCAT-3′ |
| 5′-GGAGGCCAGCATGGTGTAGA-3′ | |||
| SREBP1-C | L16995 | 5′-GGAGCCATGGATTGCACATT-3′ | 5′-TCCCCAGAGCCTTGCACTTCTTGACAC-3′ |
| 5′-AGACATGCTCCAGCTCATCAACCAA-3′ | |||
| PGC-1α | AF049330 | 5′-GATGGCACGCAGCCCTAT-3′ | 5′-CATTGTTCGATGTGTCGCCTTCTTGCT-3′ |
| 5′-CTCGACACGGAGAGTTAAAGGAA-3′ |
Measurement of Enzyme Protein Content, Phosphorylation State, and the Activity of the AMP-Activated Protein Kinase.
Tissues were removed and rapidly frozen in liquid N2. Tissue extracts were prepared by homogenization with a Tissuemizer in a buffer containing protease and protein phosphatase inhibitors (9). High-speed supernatant fractions were obtained after centrifugation at 160,000 × g for 60 min and proteins concentrated by ammonium sulfate precipitation (10). Precipitates were resuspended in the homogenization buffer and protein content was assayed by the Bradford assay and, together with matched protein samples, prepared for SDS/PAGE electrophoresis or subjected to immunoprecipitation.
Gel samples were separated on either 9 or 5% SDS gels and the separated proteins assessed by immunoblotting after transfer to poly(vinylidene difluoride) membranes. These membranes were blotted for acetyl-CoA carboxylase (ACC), FA synthase (FAS), ATP-citrate lyase (ACL), and the α subunit of the AMP-activated protein kinase (AMPK), as in refs. 9 and 10. The phosphorylation state of ACC and of the α subunit AMPK was assessed by immunoblotting with antibodies specific for the phospho forms of their major regulatory phosphorylation sites (10). AMPK activity was measured after immunoprecipitation of the resuspended ammonium sulfate fractions with an antibody that recognizes both α subunit isoforms (10).
TG Content of Tissue.
Total lipids were extracted from 100 mg of tissue by the method of Folch et al. (11) and dried under N2 gas. TG content of tissue was measured by using the GPO-Trinder triglycerol kit (Sigma).
Statistical Analysis.
All results were expressed as mean ± SEM. The statistical significance of differences in mean values was assessed by Student's t test.
Results
Effect of Hyperleptinemia on Adipose Tissue in PPARα Knockout Mice.
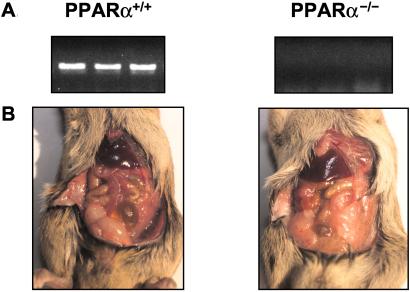
To verify the lack of PPARα expression in the PPARα−/− mice, we quantified mRNA in livers of wild-type and knockout mice by using reverse transcription–PCR. As shown in Fig. 1A, a PPARα band was detected in livers of the wild-type mice but not in the knockout mice. Hyperleptinemia resulted in disappearance of visible fat in wild-type but not in knockout mice (Fig. 1B).
Figure 1.
(A) Comparison by reverse transcription–PCR of PPARα mRNA in the liver of a wild-type (+/+) and a PPARα knockout (−/−) mouse. (B) The appearance of adipose tissue in a PPAR+/+ and a PPAR−/− mouse 7 days after the induction of hyperleptinemia by the i.v. administration of AdCMV-leptin.
Comparison of Clinical Parameters in Hyperleptinemic PPARα+/+ and PPARα−/− Mice.
The injection of AdCMV-leptin resulted in a similar degree of hyperleptinemia in PPARα+/+ and PPARα−/− mice (20 ± 0.6 vs. 19 ± 0.4 ng/ml). Food intake was significantly greater in null mice and declined 32% in wild-type and 37% in knockout mice during hyperleptinemia. Body weight, which at the start of the experiment was 4 g (8%) higher in the PPARα−/− mice than in wild-type controls, declined 8% in the former and 10% in the latter (P < 0.05) (Table 2). There was a striking difference between the two groups in the weight of the epididymal fat pad (Fig. 1B); in the wild-type mice it declined from 200 to 90 mg, or 55%, but in the PPARα-null mice, it changed from 300 to 280 mg, a loss of only 6% (P < 0.001) (Table 2). Similarly, liver TG, which fell 39% in the hyperleptinemic wild-type mice (P < 0.001), was virtually unchanged in the PPARα−/− mice (Table 2). Plasma TG declined 34% in hyperleptinemic controls (P < 0.001), but was unchanged in the knockout mice (Table 2).
Table 2.
Comparison of effects of adenovirus-induced hyperleptinemia on plasma measurements, food intake, and indices of body fat
| Genotype
|
Wild-type mice (PPARα+/+)
|
PPARα null mice (PPARα−/−)
|
||||
|---|---|---|---|---|---|---|
| Treatment | AdCMV-β-gal n = 4 | P value | AdCMV-leptin n = 4 | AdCMV-β-gal n = 4 | P value | AdCMV-leptin n = 4 |
| Plasma measurements (mean ± SEM) | ||||||
| Leptin, ng/ml | 1.4 ± 0.1 | 0.001 | 20 ± 0.6 | 2.3 ± 0.2 | 0.001 | 19.0 ± 0.4* |
| Insulin, ng/ml | 0.3 ± 0.1 | 0.001 | 0.08 ± 0.04 | 0.28 ± 0.02 | NS | 0.27 ± 0.03* |
| Triacylglycerol, mg/dl | 78 ± 3.4 | 0.05 | 55 ± 1.6 | 86 ± 3.4 | NS | 87 ± 2.5† |
| Food intake, g/d | 3.7 ± 0.3 | 0.01 | 2.5 ± 0.5 | 4.3 ± 0.7 | 0.01 | 2.7 ± 0.2* |
| Indices of body fat | ||||||
| Body weight, g (% loss) | 22 ± 1.6 | 0.05 | 18 ± 0.8 | 26.0 ± 0.1 | NS | 23 ± 0.9‡ |
| (−18%) | (−11%) | |||||
| Epididymal fat pad weight, mg | 200 ± 2.2 | 0.001 | 90 ± 1.5 | 300 ± 2.7 | NS | 280 ± 2.1† |
| Liver triacylglycerol, mg/g | 0.96 ± 0.1 | 0.05 | 0.59 ± 0.06 | 1.01 ± 0.03 | NS | 0.97 ± 0.03† |
P values in column compare differences between AdCMV-β-gal and AdCMV-leptin treatment in wild-type and PPARα null mice. Symbols after numbers compare differences after treatment of wild-type and PPARα null mice with AdCMV-leptin.
Not significant.
†P < 0.001.
‡P < 0.05.
Expression Profiles of Oxidative and Lipogenic Enzymes of WATs in Hyperleptinemic PPARα+/+ and PPARα−/− Mice.
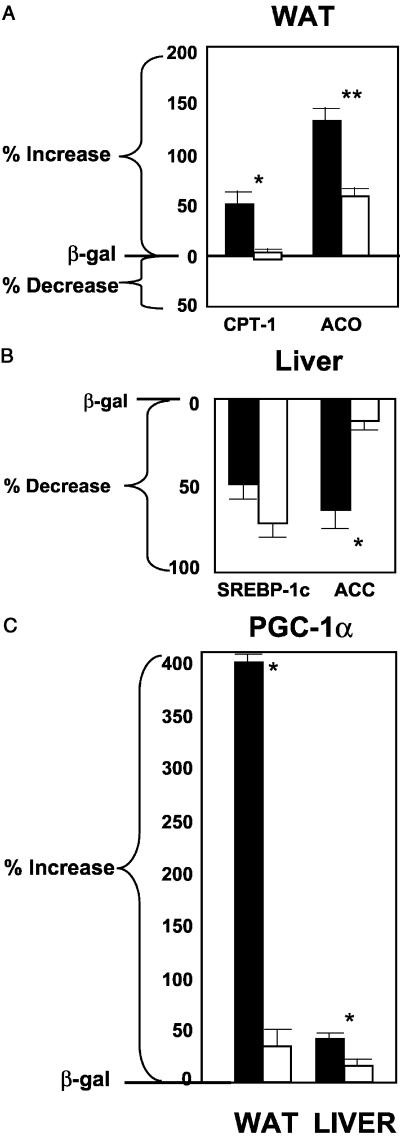
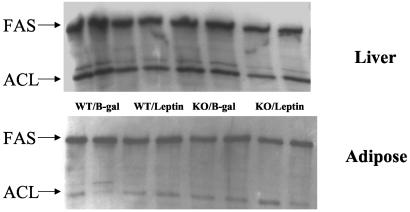
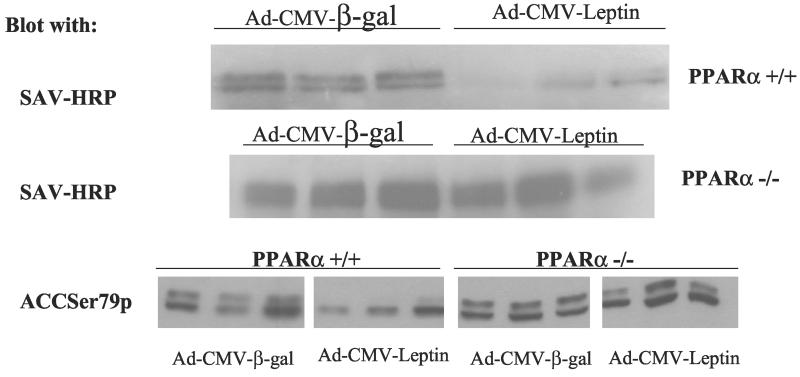
The mRNA of PPARα target enzymes of β oxidation (12) were compared in the two groups. In the normal mice, expression of CPT-1, the rate-limiting enzyme of mitochondrial oxidation, increased by 52% (P < 0.001), but did not rise at all in the PPARα knockout mice (Fig. 2A); it had previously been observed to rise 2- to 3-fold in normal rats (4). mRNA of another target enzyme of PPARα, ACO (13), the peroxisomal enzyme of FA oxidation, was up-regulated by 130% (P < 0.0001), but it also rose 60% in the PPARα null mice (P < 0.001) (Fig. 2A). This implies that hyperleptinemia partially up-regulates ACO independently of PPARα. Finally, UCP-2 mRNA, which had risen so dramatically in the hyperleptinemic normal rats, rose only 10% (not significant) in both wild-type and PPARα−/− mice (data not shown). Thus, the disappearance of fat in WAT during hyperleptinemia in PPARα+/+ mice could perhaps in part be due to an increase in transcription of CPT-1 occurring in wild-type but not PPARα−/− mice and a greater increase in ACO expression. To determine whether the disappearance of fat in the hyperleptinemic wild-type mice could reflect a decline in lipogenesis relative to FA oxidation, we examined the protein content of the major extramitochondrial enzymes of the lipogenic pathway and the mRNA content of PPARγ2, a lipogenic transcription factor (13). In contrast to our earlier findings in rats (4), PPARγ2 mRNA was not reduced by hyperleptinemia in either group of mice (data not shown). Adipose tissue content of FAS and ACL protein was unaltered by leptin in either the PPARα+/+ or PPARα−/− mice (Fig. 3 Lower). As judged by streptavidin–horseradish peroxidase blotting, both the α (265-kDa) and β (280-kDa) isoforms of ACC are present in the adipose tissue of mice (Fig. 4) (14, 15). Although there may be a small induction of ACC-β content in control mice in response to leptin, as judged by replicate samples, ACC content is largely unaltered by hyperleptinemia in the PPARα−/− mice. However, on blotting with an antibody to ACC Ser79p, the inactivating phosphorylation site of ACC (10), no signal could be detected (data not shown), indicating that all of the ACC present in both control and PPARα−/− mice is in the dephosphorylated active form. Taken together, these data on FAS, ACL, and ACC predict no major change in the lipogenic pathway in response to leptin in the adipose tissue of either the PPARα+/+ or the PPARα−/− mice. In addition, glycerol phosphate acyl transferase mRNA was unaffected in either group of mice (data not shown), predicting unaltered fatty acid esterification.
Figure 2.
(A) Comparison of mRNA, measured by real-time reverse transcription–PCR, of the oxidative enzymes CPT-1 and ACO in the epididymal fat (WAT) of PPAR+/+ and PPAR−/− mice 7 days after the i.v. administration of AdCMV-leptin or AdCMV-β-gal as a control. (B) Comparison of the mRNA of SREBP-1c and ACC in the liver of PPARα+/+ and PPARα−/− mice 7 days after the i.v. administration of AdCMV-leptin or AdCMV-β-gal. (C) Comparison of the mRNA ratios to β-actin of PGC-1α in WAT and liver of PPARα+/+ and PPARα−/− mice 7 days after the i.v. administration of AdCMV-leptin or AdCMV-β-gal. The mRNAs of interest are expressed as percent of that in AdCMV-β-gal-treated controls (mean ± SEM).
Figure 3.
FAS and ACL content of liver and adipose tissue. Shown are immunoblots of FAS and ACL in replicate extracts prepared from PPARα+/+ and PPARα−/− mice 7 days after the i.v. administration of adCMV-leptin or AdCMV-β-gal as control.
Figure 4.
ACC content in mouse adipose tissue. Shown are streptavidin–horseradish peroxidase blots of extracts of mouse adipose tissue (in duplicate or triplicate) prepared from PPAR+/+ and PPAR−/− mice 7 days after the i.v. administration of AdCMV-leptin or AdCMV-β-gal as a control. Visible are the two known ACC isoforms [ACCβ (280 kDa) and ACCα (265 kDa)].
Expression Profiles of Oxidative and Lipogenic Enzymes in Livers of Hyperleptinemic PPARα+/+ and PPARα−/− Mice.
Because the decline in liver TG content observed in overleptinized wild-type mice did not occur in the PPARα−/− mice, we quantified the expression of the mRNAs of its target enzymes of FA oxidation, ACO and CPT-1. Hyperleptinemia failed to up-regulate either enzyme in the liver of either wild-type or knockout mice (data not shown), suggesting that the lipopenic effect of leptin on mouse liver is not mediated by the target enzymes of PPARα.
To determine whether the action of hyperleptinemia on the liver was mediated via changes in lipogenic enzymes, we examined the protein content of ACC, FAS, and ACL by immunoblotting. FAS and ACL content were unaltered either in response to leptin or in the PPARα−/− mice (Fig. 3 Upper). However, hyperleptinemia led to a marked diminution in the expression of both ACC isoforms in the liver, while not reducing ACC content in the PPARα−/− mice (Fig. 5 Upper), in sharp contrast to its effect on adipose tissues. ACC appears to be highly phosphorylated in the livers of both types of mice (Fig. 5 Lower), the apparent decrease in the phosphorylation state of ACC in response to leptin in the wild-type mice reflecting the decrease in total ACC protein (Fig. 5 Upper). This would correspond to the reduction in ACC mRNA in the wild-type group but not in the knockout mice (Fig. 2B). By lowering levels of malonyl CoA, the overall decline in ACC would decrease lipogenesis while enhancing FA oxidation (16).
Figure 5.
ACC content in mouse liver. Shown are streptavidin–horseradish peroxidase blots (Top and Middle) of extracts of mouse adipose (in triplicate) prepared from PPAR+/+ and PPAR−/− mice 7 days after the i.v. administration of AdCMV-leptin or AdCMV-β-gal as a control. Visible are the two known ACC isoforms, ACCβ (280 kDa) and ACCα (265 kDa). (Bottom) The same samples have been blotted with an antibody that specifically recognizes Ser79p, the regulatory phosphorylation site of ACC.
Sterol regulatory element-binding protein 1c (SREBP-1c), an insulin-stimulated lipogenic transcription factor (17), was reduced significantly (P < 0.001) in both groups of mice (Fig. 2B). Thus, in mice, PPARα appears to mediate the reduction of ACC, but the reduction in SREBP-1c caused by hyperleptinemia seems to be independent of PPARα.
PGC-1α Expression in WAT and Liver of Hyperleptinemic PPARα+/+ and PPARα−/− Mice.
PGC-1α is a recently discovered coactivator of PPARγ and other nuclear receptors (5). The α isoform has been implicated in such important metabolic processes as mitochondrial biogenesis (5), thermogenesis (5), and gluconeogenesis (18) and may be a critically important regulator of other catabolic events. Interestingly, its expression rises dramatically in hyperleptinemic normal rats during the disappearance of white fat (6). PGC-1α also increased 3-fold (P < 0.0001) in WAT of hyperleptinemic PPARα+/+ mice and rose 46% in their livers (P < 0.001) (Fig. 2C). In overleptinized PPARα−/− mice, by contrast, there was no increase in PGC-1α mRNA in either white fat or liver. Thus, the single most striking defect in PPARα-null mice made hyperleptinemic by AdCMV-leptin is loss of leptin-stimulated PGC-1α up-regulation.
AMP-Activated Protein Kinase Activity in Hyperleptinemic PPARα+/+ and PPARα−/− Mice.
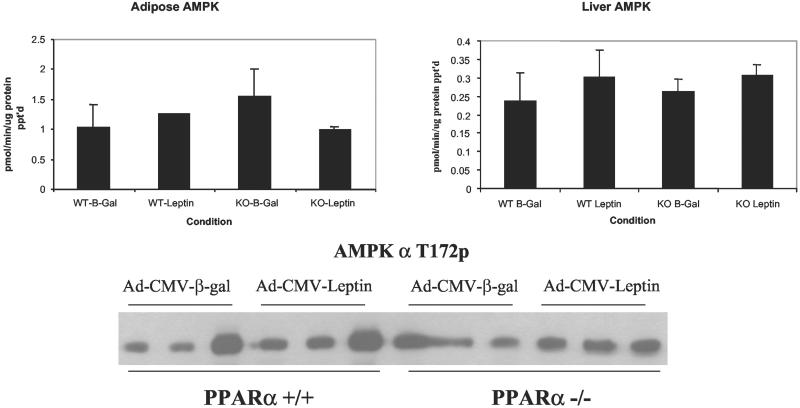
Recent data indicate that leptin administration may alter FA metabolism via direct and indirect activation of the AMPK in skeletal muscle (8). Furthermore, there is evidence that AMPK can down-regulate the hepatic expression of genes encoding lipogenic enzymes (19). Therefore, we examined the possibility that increased CPT-1 activity and FA oxidation were the result of increased AMPK activity via AMPK-directed phosphorylation of ACC, which would lower malonyl CoA and increase FA oxidation. However, as judged by kinase assay of immunoprecipitates from both WAT and liver (Fig. 6 Upper) and by assessment of the phosphorylation state of the AMPKα subunit on its activating phosphorylation site (T172) (Fig. 6 Lower), total AMPK activity was unaltered in either liver or adipose tissue of the hyperleptinemic wild-type mice and did not differ from PPARα-null mice. Additionally, tissue content of the AMPKα-1, -α-2, -β-1, and -γ-1 subunits was unaltered under all conditions, as judged by immunoblotting (data not shown). Taken together, these data suggest that AMPK is not involved in the lipopenic action of hyperleptinemia.
Figure 6.
AMPK activity and phosphorylation state in mouse adipose tissue and liver. (Upper) Results of triplicate determinations (mean ± SEM) of AMPK activity, measured as in Materials and Methods, in the presence of saturating concentrations of AMP (200 μM). The data are expressed as pmol P incorporated per minute per milligram total protein immunoprecipiates (in triplicate), blotted with an antibody specific for Thr-172, the activating phosphorylation site of AMPKα.
Discussion
The goal of this study was to assess the role of PPARα in the dramatic loss of body fat previously observed in normal rats with adenovirus-induced hyperleptinemia (4, 7). In those studies PPARα mRNA was up-regulated, together with its target enzymes of FA oxidation, ACO, CPT-1, and uncoupling proteins -1 and -2. Body fat disappeared without any increase in plasma free fatty acids or ketones (1, 3), which led to the hypothesis that the fat was being oxidized within or very close to the adipocytes themselves, and that the energy was being dissipated as heat. This, plus concomitant down-regulation of PPARγ and its target enzymes of FA synthesis, ACC, and FAS, suggested a simultaneous reduction of lipogenesis and seemed to explain the massive nonketotic depletion of fat. To test the role of PPARα in the foregoing events, we compared the responses of PPARα+/+ and PPARα−/− mice to AdCMV-leptin-induced hyperleptinemia. At the 1012-plaque-forming unit (pfu) dose that had been used in rats, both groups of mice lost body fat, but the hyperleptinemia between 40 and 100 ng/ml was many times higher than that produced in rats and therefore regarded as physiologically irrelevant. A dose of 1010 pfu produced a more reasonable level of hyperleptinemia, in the 20-ng/ml range; at this level, fat loss averaged 55% in the epididymal fat pad and 39% in the liver of PPARα+/+ mice but did not occur in PPARα−/− mice. The fat loss was less complete than had been observed in the normal rats that received the higher dose of AdCMV-leptin (1, 2). Nevertheless, it indicated that PPARα is necessary for fat loss in normal nonobese mice at hyperleptinemia comparable to that of obese rodents. Because the decline in food intake and body weight in the two groups of mice did not differ significantly, the loss of fat in the PPARα−/− mice must be ascribed to differences in PPARα-dependent changes in FA metabolism induced by leptin.
The 39% decline in liver TG content that occurred in the overleptinized wild-type mice, but not in the knockout mice, could not be explained by up-regulation of ACO or CPT-1 mRNA, because this was the same in both groups. However, the decline in the ACC content of liver at constant levels of ACC phosphorylation per subunit protein predict decreased ACC activity and lower malonyl-CoA levels, which would disinhibit CPT-1 (16) and enhance mitochondrial oxidation of FA.
The 55% decline in weight of the epididymal fat pad was associated with a relatively modest increase in expression of PPARα in the WAT of PPARα+/+ mice. The rise in the target enzymes, CPT-1 and ACO, was also considerably less than had been observed in the more hyperleptinemic rats (4, 7). Moreover, ACO mRNA also increased in the hyperleptinemic PPARα−/− mice, implying that transcriptional control of this enzyme is independent of PPARα. There was no increase in UCP-1 or -2 in the epididymal fat pads of wild-type mice.
Down-regulation of lipogenic enzymes can also deplete tissue TG by blocking FA synthesis while concomitantly enhancing FA oxidation by reducing malonyl CoA-induced inhibition of CPT-1 (16). PPARγ mRNA was unaffected by hyperleptinemia in either group. The control of isoforms of ACC, which was reduced in the liver of PPARα+/+, but not PPARα−/−, mice, was unchanged in WAT of either group, Moreover, ACC phosphorylation was undetectable, suggesting that the activity of ACC remained high in adipocytes and a reduction in its activity was not involved in the lipopenic action of leptin.
The mechanism of the TG loss and its relationship to PPARα is less clear in WAT, because neither ACC isoform nor the other two major enzymes of FA synthesis, ATP-citrate lyase and fatty acid synthase, was altered. ACC activity is also allosterically regulated by citrate, which reflects the ongoing rate of glucose uptake, glycolysis, and TCA cycle activity; diminished carbon flux through ACC due to a reduction in such positive allosteric regulation could also result in diminished malonyl-CoA content in WAT and enhanced FA oxidation. Alternatively, malonyl CoA could be reduced by an increase in malonyl CoA decarboxylase (MCD); however, immunoblotting for MCD content in both liver and adipose tissue showed no changes during hyperleptinemia and no effect of the PPARα−/− genotype on MCD expression (data not shown).
Recent evidence indicates that leptin can enhance fatty acid oxidation in muscle through a reduction in ACC activity caused by an increase in ACC phosphorylation (8). This latter event appears to be a consequence of leptin-induced activation of the AMPK in the muscle, both by direct action and through activation centrally of the sympathetic nervous system (8). However, in our study, we were unable to measure any change in AMPK activity in either liver or WAT as a consequence of hyperleptinemia. The lack of any change in total AMPKα T172 phosphorylation and of any change in ACC phosphorylation (per subunit) seen on immunoblotting argues against any change in AMPK activity. This conclusion is supported by failure to show an increase in ACC phosphorylation in WAT. Thus, the PPARα-dependent mechanism by which hyperleptinemia causes the disappearance of TG in WAT cannot be explained by the AMPK-mediated inactivation of ACC.
The most striking transcription difference noted in this study was the 3-fold rise in PGC-1α mRNA in WAT that occurred in PPARα+/+ but not in PPARα−/− mice. Moreover, baseline expression of PGC-1α in the null mice was below normal. The role of this coactivator in mitochondrial biogenesis, thermogenesis (4), and gluconeogenesis (18) has been well established. The most plausible interpretation of the findings in WAT is that leptin induces, through up-regulation of PGC-1α expression, a PPARα-dependent increase in mitochondrial biogenesis that increases FA oxidation sufficiently to deplete TG stores with a relatively modest increase in the transcription and/or activities of the enzymes of FA oxidation. In other words, during the sustained hyperleptinemia induced by adenovirus transfer of the leptin gene, white adipocytes acquire features of brown adipocytes and are converted from fat-storing to fat-burning cells, in large part through up-regulation of PGC-1α.
Acknowledgments
We thank C. B. Newgard, Ph.D., and S. Kliewer, Ph.D., for review of this manuscript, Angie Bookout for technical assistance, and J. Repa for valued advice. This work was supported in part by National Institute of Diabetes and Digestive and Kidney Diseases Grant DK35712 (to L.A.W.) and by Department of Veterans Affairs Merit Review, National Institute of Diabetes and Digestive and Kidney Diseases Grants DK02700 and DK58398 (to R.H.U.) and by The Howard Hughes Medical Institute (to D.J.M.).
Abbreviations
- WAT
white adipose tissue
- FA
fatty acid
- FAS
FA synthase
- PPAR
peroxisome proliferator-activated receptor
- PGC
peroxisome proliferator-activated receptor γ coactivator
- TG
triacylglycerol
- ACC
acetyl-CoA carboxylase
- ACL
ATP-citrate lyase
- AMPK
AMP-activated protein kinase
- CPT
carnitine palmitoyl transferase
- ACO
acyl CoA oxidase
References
- 1.Chen G, Koyama K, Yuan X, Lee Y, Zhou Y-T, O'Doherty R, Newgard C B, Unger R H. Proc Natl Acad Sci USA. 1996;93:14795–14799. doi: 10.1073/pnas.93.25.14795. [DOI] [PMC free article] [PubMed] [Google Scholar]
- 2.Shimabukuro M, Koyama K, Chen G, Wang M-Y, Trieu F, Lee Y, Newgard C B, Unger R H. Proc Natl Acad Sci USA. 1997;94:4637–4641. doi: 10.1073/pnas.94.9.4637. [DOI] [PMC free article] [PubMed] [Google Scholar]
- 3.Wang M-Y, Lee Y, Unger R H. J Biol Chem. 1999;274:17541–17544. doi: 10.1074/jbc.274.25.17541. [DOI] [PubMed] [Google Scholar]
- 4.Zhou Y-T, Shimabukura M, Koyama K, Lee Y, Wang M-Y, Trieu F, Newgard C B, Unger R H. Proc Natl Acad Sci USA. 1997;94:6386–6390. doi: 10.1073/pnas.94.12.6386. [DOI] [PMC free article] [PubMed] [Google Scholar]
- 5.Wu Z, Puigserver P, Andersson U, Zhang C, Adelmant G, Mootha V, Troy A, Cinti S, Lowell B, Scarpulla R C, Spiegelman B M. Cell. 1999;98:115–124. doi: 10.1016/S0092-8674(00)80611-X. [DOI] [PubMed] [Google Scholar]
- 6.Kakuma T, Wang Z W, Pan W, Unger R H, Zhou Y-T. Endocrinology. 2000;141:4576–4582. doi: 10.1210/endo.141.12.7804. [DOI] [PubMed] [Google Scholar]
- 7.Zhou Y-T, Wang Z-W, Higa M, Newgard C B, Unger R H. Proc Natl Acad Sci USA. 1999;96:2391–2395. doi: 10.1073/pnas.96.5.2391. [DOI] [PMC free article] [PubMed] [Google Scholar]
- 8.Minokoshi Y, Kim Y B, Peroni O D, Fryer L G, Muller C, Carling D, Kahn B B. Nature (London) 2002;415:339–343. doi: 10.1038/415339a. [DOI] [PubMed] [Google Scholar]
- 9.Evans J L, Quistorff B, Witters L A. Biochem J. 1989;259:821–829. doi: 10.1042/bj2590821. [DOI] [PMC free article] [PubMed] [Google Scholar]
- 10.Hamilton S R, Stapleton D A, O'Donnell J B, Kung J T, Dalal S R, Kemp B E, Witters L A. FEBS Lett. 2001;500:163–168. doi: 10.1016/s0014-5793(01)02602-3. [DOI] [PubMed] [Google Scholar]
- 11.Folch J, Lee S M, Stanley G H S. J Biol Chem. 1957;226:497–509. [PubMed] [Google Scholar]
- 12.Dreyer C, Keller H, Mahfoudi A, Laudet V, Krey G, Wahli W. Biol Cell. 1993;77:67–76. doi: 10.1016/s0248-4900(05)80176-5. [DOI] [PubMed] [Google Scholar]
- 13.Tontonoz P, Kim J B, Graves A M, Spiegelman B M. Mol Cell Biol. 1993;13:4743–4759. doi: 10.1128/mcb.13.8.4753. [DOI] [PMC free article] [PubMed] [Google Scholar]
- 14.Bianchi A, Evans J L, Watts T D, Witters L A. J Biol Chem. 1990;265:1502–1508. [PubMed] [Google Scholar]
- 15.Abu-Elheiga L, Matzuk M M, Abo-Hasbema K A, Wakil S J. Science. 2001;291:2558–2559. doi: 10.1126/science.1056843. [DOI] [PubMed] [Google Scholar]
- 16.McGarry J D, Mannaerts G P, Foster D W. J Clin Invest. 1977;60:265–270. doi: 10.1172/JCI108764. [DOI] [PMC free article] [PubMed] [Google Scholar]
- 17.Shimomura I, Bashmakov V, Ikemoto S, Horton J D, Brown M S, Goldstein J L. Proc Natl Acad Sci USA. 1999;96:13656–13661. doi: 10.1073/pnas.96.24.13656. [DOI] [PMC free article] [PubMed] [Google Scholar]
- 18.Yoon J C, Puigserver P, Chen G, Donovan J, Wu Z, Rhee J, Adelmant G, Stafford J, Kahn C R, Granner D K, et al. Nature (London) 2001;413:131–138. doi: 10.1038/35093050. [DOI] [PubMed] [Google Scholar]
- 19.Woods A, Azzout-Marniche D, Foretz M, Stein S C, Lemarchand P, Ferre P, Foufelle F, Carling D. Mol Cell Biol. 2000;20:6704–6711. doi: 10.1128/mcb.20.18.6704-6711.2000. [DOI] [PMC free article] [PubMed] [Google Scholar]


