Abstract
Microbial production in anoxic wetland rice soils is a major source of atmospheric CH4, the most important non-CO2 greenhouse gas. Much higher CH4 emissions from well managed irrigated rice fields in the wet than in the dry season could not be explained by seasonal differences in temperature. We hypothesized that high CH4 emissions in the wet season are caused by low grain to biomass ratios. In a screenhouse experiment, removing spikelets to reduce the plants' capacity to store photosynthetically fixed C in grains increased CH4 emissions, presumably via extra C inputs to the soil. Unfavorable conditions for spikelet formation in the wet season may similarly explain high methane emissions. The observed relationship between reduced grain filling and CH4 emission provides opportunities to mitigate CH4 emissions by optimizing rice productivity.
Keywords: greenhouse gas, C allocation in rice plants, rice production, global warming
Atmospheric methane (CH4) is the second most important greenhouse gas, next to CO2. The total global CH4 emission source is about 600 Tg⋅year−1 [Tg, teragrams (1012 g)] and emission of 1 kg of CH4 to the present-day atmosphere is 21 times more effective in perturbing the radiation balance than emission of 1 kg of CO2 (1). Wetland rice fields are among the important sources of atmospheric CH4, with an estimated source strength of 60 ± 40 Tg⋅year−1 (2). CH4 emissions from rice fields have been measured over the past decades in Italy (3), Japan (4), the United States (5–7), China (8), and the Philippines (9). These data have been used in simulation models to predict CH4 emissions from rice fields, using a limited number of input variables (10, 11). Such predictive models can only help to improve estimates of the global CH4 source strength if all important processes that control CH4 emission from rice paddies are incorporated. The Interregional Research Program on Methane Emissions from Rice Fields (1993–1998) (12) provided the first emission measurements for major rice-growing regions by using a standardized automated closed chamber system. One of the most comprehensive data sets from this program is by Corton et al. (13), who measured CH4 emissions from intensively managed irrigated fields with high-yielding rice, fertilized with N (urea), P, and K. The experiment encompassed nine seasons (five dry seasons and four wet seasons). In reference treatments where rice variety, fertilizer inputs, water management, and organic amendments were kept constant in the successive dry and wet seasons, CH4 emissions were invariably 1.5–4-fold higher in the wet season than in the dry season (Table 1). We could not link seasonal differences in emission to effects of temperature on bacterial methane production: daily mean and maximum temperatures were very similar in wet and dry seasons, while all other known variables driving CH4 emission were kept constant. Mean solar radiation from 1994 to 1998 did not differ significantly between the wet seasons (20.6 ± 3.1 MJ⋅m−2⋅day−1) and dry seasons (23.6 ± 2.8 MJ⋅m−2⋅day−1), although distinct periods of very low solar radiation were common in wet and not in dry seasons.
Table 1.
Aboveground biomass, grain yield, and seasonal methane emission for the 5-year experiment at Maligaya, Nueva Ecija, Philippines [after Corton et al. (13)]
| Year
|
Aboveground biomass, t⋅ha−1 | Grain yield, t⋅ha−1 | Harvest index | Seasonal CH4 emission, kg of CH4-C ha−1 | ||||
|---|---|---|---|---|---|---|---|---|
| DS | WS | DS | WS | DS | WS | DS | WS | |
| 1994 | 12.63 | 11.46 | 8.36 | 5.22 | 0.66 | 0.46 | 71 | 200 |
| 1995 | 13.79 | 13.92 | 6.54 | 3.30 | 0.47 | 0.24 | 153 | 389 |
| 1996 | 15.35 | 14.60 | 7.30 | 5.17 | 0.48 | 0.35 | 120 | 204 |
| 1997 | 12.50 | 12.24 | 7.91 | 5.36 | 0.63 | 0.44 | 67 | 261 |
| 1998 | 16.40 | 8.00 | 0.49 | 68 | ||||
DS, dry season; WS, wet season.
Average of three replicate plots.
Climate may affect methane emission indirectly through effects on rice growth. The living plants' photosynthetic products are used as substrate by methanogens in the rhizosphere, as was shown by 13C-tracer studies (15, 16). This suggests a positive relationship between photosynthetic activity or rice biomass and CH4 emission (7, 17). Yield and biomass are related via the harvest index (HI), which is the mass ratio of grain yield and total above-ground dry matter. HI varies among varieties, and further depends on environmental factors (18). Regional rice biomass data derived from yield data and HI values (19, 20) have indeed been used to estimate regional CH4 emissions (21, 22).
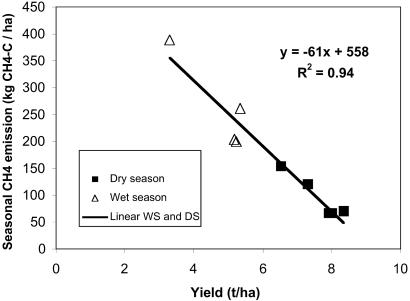
Surprisingly, the data by Corton et al. (13) revealed a strong negative correlation of CH4 emission with grain yield (Fig. 1) and no correlation between above-ground biomass and CH4 emission. Stubble left for the next season did not significantly differ between seasons, and could play no role in the seasonal emission patterns. HI values were systematically lower in the wet than in the dry season, and were inversely related to the seasonal CH4-C emission (= −658 HI + 484 kg⋅ha−1 of CH4-C, R2 = 0.77, n = 16).
Fig 1.
Seasonal methane emission as a function of grain yield at Maligaya, Philippines, 1994–1998 (data from ref. 13, treatment T1).
To explain the results of Corton et al. (13), we hypothesized that the high CH4 emissions observed in the wet season were associated with low HI values, via excess C that could not be allocated to rice grain. This is in line with results from Sass et al. (7), who found evidence for a direct relationship between photosynthetic activity of the rice plant and substrate available for methanogenesis. The amount of C not allocated to seed represents the yield gap (equal to grain yield expected from the measured total biomass times highest HI per variety, minus the actual grain yield) in the wet season. Part of the C associated with the yield gap will enter the soil, as rhizodeposition and leaf litter, where it can serve as a substrate for methanogens. The seasonal CH4 emission increased with the yield gap (C, kg⋅ha−1) according to: CH4-C emission = 0.111* yield gap + 65 kg⋅ha−1 of CH4-C, R2 = 0.71). On average 11 ± 4% of the C not allocated to rice grains was emitted as CH4. This is similar to the 12% ± 4% of (labeled) organic C added to the soil under wetland rice that was recovered as CH4 (23). The relationship between CH4 emission and yield gap strongly suggests a direct causal link between the two. We therefor set out to answer the questions: (i) Does sink limitation indeed increase CH4 emission? and (ii) What climatic variable is responsible for the low HI in the wet season?
Cereal grain yield can be limited either by the supply of assimilate to fill the grains (source limitation) or by the capacity of the reproductive organs to accept the assimilate (sink limitation). There is evidence for a stronger sink limitation in rice during the wet season (18) and for a source limitation in the dry season, when the number of juvenile spikelets (flower clusters) tends to be very high (24). To determine the frequency of the occurrence of sink limitation, the well evaluated ecophysiological simulation model ORYZA1 (25) was run for 20 years using weather data from Los Baños in the Philippines. ORYZA1 simulates crop growth on basis of the response of physiological, phenological, and morphological processes to radiation and temperature. Simulated sink limitation did not occur in the dry season, but did lower HI values in 25% of the wet seasons, even under optimal conditions for crop growth. With sink limitation the number of spikelets determines the sink capacity, because rice grains have a fixed maximum hull size (26, 27). Spikelet formation, fertility, and development are strongly influenced by assimilate supply to the developing panicle during preanthesis.
Solar radiation is one of the factors that limits assimilate supply. Low radiation in the preanthesis period causes spikelet degeneration (28), which may result in a reduced HI in the wet season, causing low yields even though total biomass production may be as high as in the dry season.
To test the hypothesis that lowering the sink capacity increases CH4 emissions, we performed an experiment where we manipulated sink capacity and leaf photosynthetic rate to study their effect on CH4 emission.
Methods
In a screenhouse experiment we varied sink capacity of the rice plant by removing spikelets, and tried to change the leaf photosynthetic rate by providing different levels of N. Pots (30 cm in diameter) were filled with 8 kg of soil (air-dried, ground, and homogenized Maahas clay), plus the equivalent of 60 kg of P ha−1 and 50 kg of K ha−1 (36 pots), and 0, 60, and/or 180 kg⋅ha−1 (60 kg of N ha−1 added during flowering) of urea-N (12 pots each). Two days after puddling and submerging the soil to 5 cm above the soil surface, two 2-week-old IR 72 seedlings were planted per pot. The 36 pots were randomly placed in the screenhouse at the International Rice Research Institute, Los Baños, Philippines. The screenhouse had a roof that limited direct sunlight and a number of large fans to circulate air from inside and outside the screenhouse. Border effects on plant growth were minimized by placing green screen around the tables from the top of the pots to ≈50 cm higher, thereby reducing sidelight. Just before flowering, the tiller number and plant height of each pot was recorded. Leaf areas were measured manually (18) and the N concentration of the youngest fully expanded leaf at 57 and 66 days after transplanting was estimated nondestructively by a chlorophyll meter (SPAD-502) (29). In four randomly selected pots per N rate, the sink capacity was manipulated by clipping 0%, 33%, 66% (in treatments with 0 and 120 + 60 kg⋅ha−1 of N), and 100% (in treatment with 60 kg⋅ha−1 of N) of the spikelets just after the completion of flowering, which for individual panicles was between 62–80 days after transplanting.
After harvesting, dry weight of roots, old tillers, new tillers, filled grains, unfilled grains, and removed spikelets was determined. Methane emission was measured at 56–59, 61–63, and 99–101 days after transplanting, using a closed gas collection chamber of transparent plastic, 1 m high and 20 cm in diameter, that could be lowered over the plants into the floodwater, sealing off the inside of the chamber. The chamber air was mixed with a small battery-operated fan and sampled (between 9:00 a.m. and 11:30 a.m.) by syringes via a rubber septum. One milliliter of gas sample was taken at 0, 15, 30, and 45 min duration and the emission was estimated from the linear increase in the CH4 concentration with time (R2 > 0.90, n = 4). The gas samples were analyzed on a gas chromatograph with a flame ionization detector.
Results and Discussion
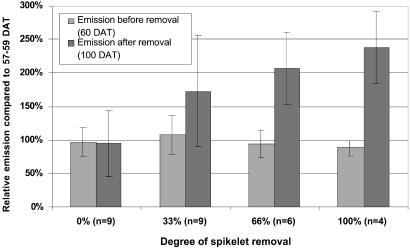
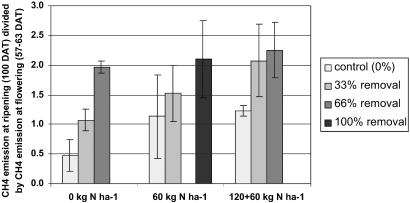
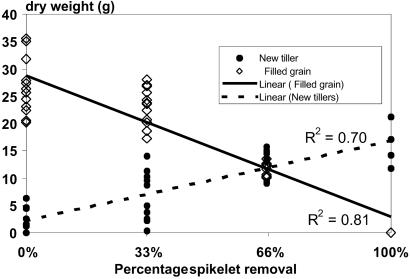
CH4-C emissions increased as more spikelets were removed (Table 2). CH4-C emissions, scaled by setting the first measured CH4 flux for each individual pot at 100% to account for pot-specific emission levels (30), increased linearly with spikelet removal (Fig. 2). This relationship appeared to hold at each N rate (Fig. 3). Adding N did not significantly increase tiller number, plant height, and leaf-N concentration up to the time of spikelet removal (data not shown), so N availability in the soil was enough to ensure maximum plant growth until flowering. Also, N addition did not influence CH4 emission before flowering (Table 2). At the ripening stage, however, CH4 emission was significantly higher from N-fertilized than from unfertilized plants, and CH4 emission increased with N addition both in the clipped and unclipped plants (Fig. 3). Total plant biomass produced at harvest did not significantly change because of spikelet removal. At each level of N addition and of spikelet removal, decreased grain yield was compensated for more by growth of new tillers than by loss of methane (Fig. 4), while growth of new tillers as well as methane emission increased with increasing nitrogen addition.
Table 2.
Methane emission from rice plants in a pot experiment before spikelet removal and 4–5 weeks after spikelet removal at three rates of N fertilization
| Nitrogen, kg of N ha−1
|
Spikelet removal, %
|
Methane emission, mg of CH4-C plant−1⋅day−1 | |||||
|---|---|---|---|---|---|---|---|
| Before (58 DAT) | Before (61 DAT) | After (100 DAT) | |||||
| Average | SD† | Average | SD† | Average | SD† | ||
| 0 | 0 | 2.03 | 0.64 | 2.44 | 0.98 | 1.00 | 0.45 |
| 33 | 2.15 | 0.57 | 2.55 | 0.73 | 2.44 | 0.29 | |
| 66 | 2.36 | 0.42 | 1.94 | 0.29 | 4.22 | 0.37 | |
| 60 | 0 | 3.14 | 0.48 | 3.74 | 1.47 | 3.47 | 1.51 |
| 33 | 2.55 | 0.46 | 2.39 | 0.54 | 3.82 | 1.43 | |
| 100 | 2.17 | 0.60 | 3.22 | 1.55 | 5.31 | 0.40 | |
| 180 | 0 | 2.66 | 0.35 | 2.32 | 0.65 | 3.07 | 0.71 |
| 33 | 2.19 | 0.63 | 3.58 | 2.33 | 6.21 | 4.10 | |
| 66 | 2.47 | 0.87 | 2.51 | 0.76 | 5.45 | 1.50 | |
DAT, days after transplanting.
†n = 4.
Fig 2.
Methane emission before and after spikelet removal expressed relative to the emissions at 58 days after transplanting (DAT).
Fig 3.
Ratio of CH4-C emission before and after spikelet removal at three rates of N-fertilization (n = 4). DAT, days after transplanting.
Fig 4.
Dry weight of filled grain and new tillers as a function of spikelet removal.
These results support our hypothesis that low HI values lead to photosynthetic production of excess C that is partly transferred below ground, where it can act as a substrate for methanogens as was shown by isotope labeling studies (15, 16). Adding N is known to increase the plants' sink capacity (the number of spikelets per m2), as well as its photosynthetic capacity after flowering (25). Increased photosynthetic capacity after flowering explains why under sink limitation, induced in our experiment by removing spikelets, N addition further stimulated methane formation.
Spikelet removal in the pot experiment emulated the conditions in the wet season field experiment (Figs. 2 and 3) in that it enhanced CH4 emission and lowered HI and yields relative to those in the dry season, without affecting total biomass. Our observations strongly suggests that lower plant performance, as indicated by lower HI values, is indeed responsible for the much higher CH4 emission in the wet than in the dry season. The ultimate causal factor of low HI values is most likely to be low solar radiation and high temperatures in the preanthesis period, causing spikelet degeneration (31). Higher values of HI in the dry than in the wet season were reported also for the major Indian rice growing regions (32). However, studies under better-controlled conditions, allowing one variable at a time to be altered, are necessary to test whether climate differences between wet and dry seasons cause differences in HI.
Regardless of whether climate is indeed the ultimate causal factor of high wet-season CH4 emissions, however, our results strongly suggest that that CH4 emissions from rice agriculture can be curtailed by optimizing rice production to maximize HI. Proper timing of fertilizer application and good phytosanitary control could optimize rice production. Sink limitation could also be avoided by developing varieties that produce late tillers (in contrast to ongoing programs that focus on low tillering varieties), providing an extra sink for C when grain filling stops.
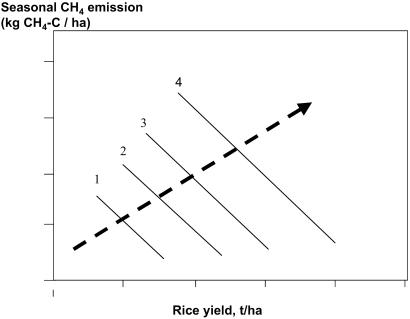
Our results for experiments in one particular area show and explain a negative correlation between grain yield and methane emission. Most of the CH4-C emitted from rice fields, however, is ultimately derived from photosynthetic C fixed by rice plants, so one would expect a positive, not a negative, correlation between rice production and methane emission. Indeed, data from different regions showed such a positive correlation (21, 22), which was used to estimate emissions from larger regions (22, 33). These seemingly contrasting results can be reconciled by assuming that the relationship between grain yield and methane emission in Fig. 1 varies with environmental conditions in a manner as depicted in Fig. 5.
Fig 5.
Hypothetical relationships between grain yield and seasonal methane emission for areas with specific sets of environmental conditions causing differences in overall agronomic productivity (lines 1–4) and across such areas, for “average production” (bold broken arrow).
In Fig. 5, productivity level varies between areas 1 and 4, depending on local environmental factors such as solar radiation, temperature, and soil fertility. As grain yield increases from areas 1 to 4, methane formation and emission increase according to the broken arrow, because of increasing inputs of plant material into the soil, and by faster soil organic matter turnover. Within a given area, the numbered line indicates a hypothetical yield–methane emission relation, as shown in Fig. 1. Along the line, CH4 emissions can be minimized minimizing leakage of photosynthetic products from the plant by optimizing storage of C in grain. Because reducing anthropogenic CH4 emission may be a major way to minimize global warming over the next several decades (14), rice agriculture may well contribute to such an approach, perhaps even if production of this major staple crop of the world continues to increase.
Acknowledgments
We thank Jacque Dionoro for advice on the clipping experiments, Sonny Pantoja for dedicatedly running the screenhouse experiment, Peter van Bodegom for general discussion, Shaobing Peng for advice and explaining the SPAD meter, and Ken Giller and Ron L. Sass for reviewing an earlier version of the paper. The research was in part funded by the Dutch National Research Program on Global Air Pollution and Climate Change.
Abbreviations
HI, harvest index
This paper was submitted directly (Track II) to the PNAS office.
See commentary on page 11993.
References
- 1.Lelieveld J., Crutzen, P. J. & Dentener, F. J. (1998) Tellus 50B, 128-150. [Google Scholar]
- 2.Houghton J. T., Meira Filho, L. G., Bruce, J., Lee, H., Callander, B. A., Haites, E., Harris, N. & Maskell, K., (1995) Climate Change 1994 (Cambridge Univ. Press, Cambridge, U.K.).
- 3.Schütz H., Holzapfel-Pschorn, A., Conrad, H., Rennenberg, R. & Seiler, W. (1989) J. Geophys. Res. 94, 16.,405–16,416. [Google Scholar]
- 4.Yagi K. & Minami, K. (1990) Soil Sci. Plant Nutr. 36, 599-610. [Google Scholar]
- 5.Cicerone R. J. & Shetter, J. D. (1981) J. Geophys. Res. 86, 7203-7209. [Google Scholar]
- 6.Sass R. L., Fisher, F. M., Harcombe, P. A. & Turner, F. T. (1990) Global Biogeochem. Cycles 4, 47-68. [Google Scholar]
- 7.Sass R. L., Fisher, F. M., Turner, F. T. & Fund, M. F. (1991) Global Biogeochem. Cycles 5, 335-350. [Google Scholar]
- 8.Wassmann R., Wang, M. X., Shangguan, X. J., Xie, X. L., Shen, R. X., Wang, Y. S., Papen, H., Rennenberg, H. & Seiler, W. (1993) Geophys. Res. Lett. 20, 2071-2074. [Google Scholar]
- 9.Denier van der Gon H. A. C. & Neue, H. U. (1995) Global Biogeochem. Cycles 9, 11-22. [Google Scholar]
- 10.Huang Y., Sass, R. L. & Fisher, F. M. (1998) Global Change Biol. 4, 247-268. [Google Scholar]
- 11.Bodegom, P. M., van Wassmann, R. & Corton, T. M. (2002) Global Biogeochem. Cycles, in press.
- 12. (2000) Nutrient Cycling in Agroecosystems 58, 1-394. [DOI] [PMC free article] [PubMed] [Google Scholar]
- 13.Corton T. M., Bajita, J. B., Grospe, F. S., Pamplona, R. R., Assis, C. A., Jr., Wassmann, R., Lantin, R. S. & Buendia, L. V. (2000) Nutrient Cycling in Agroecosystems 58, 37-53. [Google Scholar]
- 14.Hansen J., Sato, M., Ruedy, R., Lacis, A. & Oinas, V. (2000) Proc. Natl. Acad. Sci. USA 97, 9875-9880. [DOI] [PMC free article] [PubMed] [Google Scholar]
- 15.Minoda T. & Kimura, M. (1994) Geophys. Res. Lett. 21, 2007-2010. [Google Scholar]
- 16.Minoda T. & Kimura, M. (1996) J. Geophys. Res. 101, 21091-21097. [Google Scholar]
- 17.Huang Y., Sass, R. L. & Fisher, F. M. (1997) Global Change Biol. 3, 491-500. [Google Scholar]
- 18.Yoshida S., (1981) Fundamentals of Rice Crop Science (International Rice Research Institute, Los Baños, Philippines).
- 19.Huang Y., Sass, R. L. & Fisher, F. M. (1997) Global Change Biol. 3, 489-497. [Google Scholar]
- 20.Cao M. K., Dent, J. B. & Heal, O. W. (1995) Global Biogeochem. Cycles 9, 183-195. [Google Scholar]
- 21.Huang Y., Sass, R. L. & Fisher, F. M. (1998) Global Change Biol. 4, 247-268. [Google Scholar]
- 22.Cao M. K., Gregson, K., Marshall, S., Dent, J. B. & Heal, O. W. (1996) Chemosphere 33, 879-897. [Google Scholar]
- 23.Denier van der Gon H. A. C. (2000) Global Biogeochem. Cycles 14, 61-72. [Google Scholar]
- 24.Sheehy J. E., Dionora, M. J. A. & Mitchell, P. L. (2001) Field Crops Res. 71, 77-85. [Google Scholar]
- 25.Kropff M. J., van Laar, H. H. & Matthews, R. B., (1994) ORYZA1: An Ecophysiological Model for Irrigated Rice Production (International Rice Research Institute, Wageningen University, Systems Analysis for Rice Production Research Proceedings).
- 26.Murata Y. & Matsushima, S. (1975) in Crop Physiology, ed. Evans, L. T. (Cambridge Univ. Press, London), pp. 75–99.
- 27.Fukai S., Li, L., Vizmonte, P. T. & Fischer, K. S. (1991) Exp. Agric. 27, 127-135. [Google Scholar]
- 28.Evans L. T. & de Datta, S. K. (1979) Field Crops Res. 2, 1-17. [Google Scholar]
- 29.Peng S. B., Laza, M. R. C., Garcia, V. & Cassman, K. G. (1995) Comm. Soil Sci. Plant Anal. 26, 927-935. [Google Scholar]
- 30.Denier van der Gon H. A. C. & Neue, H.-U. (1996) Biol. Fert. Soils 22, 359-366. [Google Scholar]
- 31.Yoshida S. & Parao, F. T., (1976) Climate and Rice (International Rice Research Institute, Manila, Philippines), pp. 471–494.
- 32.Murty K. S. & Sahu, G., (1987) Weather and Rice (International Rice Research Institute, Manila, Philippines), pp. 93–103.
- 33.Anastasi C., Dowding, M. & Simpson, V. J. (1992) J. Geophys. Res. 97, 7521-7525. [Google Scholar]


