Abstract
Molecular dynamics simulation techniques have been used to investigate the effect of 2,2,2-trifluoroethanol (TFE) as a cosolvent on the stability of three different secondary structure-forming peptides: the α-helix from Melittin, the three-stranded β-sheet peptide Betanova, and the β-hairpin 41–56 from the B1 domain of protein G. The peptides were studied in pure water and 30% (vol/vol) TFE/water mixtures at 300 K. The simulations suggest that the stabilizing effect of TFE is induced by the preferential aggregation of TFE molecules around the peptides. This coating displaces water, thereby removing alternative hydrogen-bonding partners and providing a low dielectric environment that favors the formation of intrapeptide hydrogen bonds. Because TFE interacts only weakly with nonpolar residues, hydrophobic interactions within the peptides are not disrupted. As a consequence, TFE promotes stability rather than inducing denaturation.
For more than three decades, 2,2,2-trifluoroethanol (TFE) has been used as a cosolvent for the study of peptides in solution because NMR and CD studies show that the presence of TFE increases the population of α-helix and β-sheet content in secondary-structure-forming peptides in TFE/water mixtures (1–3). Despite the effects of TFE having been known for such a long time, the mechanism by which TFE stabilizes secondary structure in peptides is still not clear. One possible explanation is the preferential solvation of the folded state by TFE (3). According to this hypothesis, TFE acts within the context of a preexisting helix-coil equilibrium, and the preferential interaction of TFE with the folded state shifts the equilibrium toward more structured conformations (3). The molecular nature of the TFE–peptide interaction is not clear, however. Alternative mechanisms have also been proposed to explain the stabilizing effect of TFE. In particular, the effect could result from TFE reinforcing hydrogen bonds between carbonyl and amidic NH groups by the removal of water molecules in the proximity of the solute (4) and/or the lowering of the dielectric constant (1). Furthermore, small-angle x-ray-scattering studies (2) show that TFE forms clusters in water as the concentration of the organic cosolvent is increased, with a maximum at 30% (vol/vol) TFE. Reiersen and Rees (5) have proposed that such TFE clusters locally assist the folding of secondary-structure elements by providing a solvent matrix that promotes hydrophobic interactions between amino acid side chains. Recent NMR studies involving small peptides in TFE provide some support for this hypothesis (6–8). Each of these mechanisms could explain the stabilization of α-helical peptides in solution (1, 3) but not necessarily the stabilization of β-structure (1, 2).
In recent years molecular dynamics (MD) simulations have been increasingly used to understand the complex conformational equilibria of polypeptides in solution and to predict structural preferences (9–11). In particular, the importance of side-chain interactions in determining peptide stability (9, 10) has been investigated for a range of secondary structure-forming peptides in aqueous solution, as well as in more hydrophobic environments such as methanol (12, 13). To date, however, only very few atomistic simulation studies of peptides in explicit TFE/water mixtures have appeared in the literature. To our knowledge all have involved α-helix-forming peptides. None have investigated the stabilization of β-structure.
In this article, we present the results of MD simulations of three peptides that form either an α-helix or have β-structure, in pure water and ≈30% (vol/vol) water/TFE mixtures. The aim was to investigate the role of the TFE cosolvent in the stabilization of secondary structure. In particular, two questions have been addressed: (i) does preferential solvation of the peptide by TFE molecules exist, and (ii) what is the nature of the interaction between the peptide and TFE? The study has been performed by using a new TFE model (14) that was optimized to reproduce the physicochemical properties of the neat liquid and its mixtures with water. Among other properties the model has been shown to reproduce accurately the derivative of the activity coefficient of TFE in water obtained experimentally (15). The derivative of the activity coefficient is a key property in the interpretation of the effects of cosolvents on peptides (16, 17).
The peptides used in the study were Melittin (MLT), the three-stranded de novo-designed peptide Betanova (BET), and the β-hairpin 41–56 (BHA) from the B1 domain of protein G. Each of these peptides has been investigated in aqueous solution (9, 10, 18). MLT, a 26-residue amphiphilic peptide (GIGAV LKVLTTGLPALISWIKRKRQQ), is the principal venom component from the honey bee Apis mellifera. In pure water at pH 4, MLT is monomeric and behaves as a random coil (19). The addition of TFE (or methanol) induces the formation of α-helical structure (2, 19, 20), in a manner similar to that observed in other helical peptides in TFE/water mixtures (3). BET is a 20-residue peptide (RGWSVQNGKYTNNGKTTEGR) designed de novo by Serrano and coworkers (21). NMR studies (21) and MD simulations (10, 22, 23) indicate that the peptide is partially folded in water with the formation of a β-hairpin involving residues 3–12. In a 40% (vol/vol) TFE/water mixture a three-stranded conformation becomes more populated as the formation of a second β-hairpin (9–19) is stabilized (21). Finally, BHA is a 16-residue peptide (GEWTYDDATKTFTVTE) that adopts a stable β-hairpin structure in aqueous solution (24, 25) with a population of ≈40%. In 30% (vol/vol) TFE/water solution, the β-hairpin population of the peptide further increases up to ≈60% (25).
For each peptide, two 20-ns simulations, at 300 K, one in pure water and one in 30% (vol/vol) TFE/water mixtures, were performed. The structural and dynamical properties of the resulting ensemble of structures were analyzed and compared with the available experimental data. In particular, the distribution of the solvent molecules around the peptide was investigated.
Materials and Methods
Starting atomic coordinates of the peptides were obtained as described (9, 10, 18). Each of the peptides was solvated with either water or a mixture of TFE and water and placed in a periodic truncated octahedron large enough to contain the peptide and 0.8 nm of solvent on all sides. In MLT and the β-hairpin from protein G, counter ions (Cl and Na, respectively) were added by replacing water molecules at the most positive/negative electrical potential to achieve a neutral simulation cell. In BET, no counter ions were added so that the results of the TFE/water simulation could be compared with previous simulations performed in aqueous solution (10) in which counter ions were not used. In Table 1 the composition of the systems simulated are reported. Before starting the dynamics simulations each system was energy-minimized by using a steepest descent algorithm for 100 steps. In all simulations, the temperature and the pressure were kept close to the intended values (300 K and 1 bar) by using the Berendsen algorithm (26) with τT = 0.1 and τP = 0.5 ps, respectively.
Table 1.
Summary of the composition of the simulated systems and secondary-structure content calculated during the last 10 ns of the simulations
| Simulated systems | SPC/TFE | NCI | α-Helix, % | β-Strand, % | Turn1, % | Turn2, % |
|---|---|---|---|---|---|---|
| MLTW | 3,780 /0 | −6 | 56 (88) | 0 | 20 | |
| MLTmix | 1,945 /172 | −6 | 68 | 0 | 10 | |
| BETW | 2,940 /0 | 0 | 0 | 28 | 100 | 64 |
| BETmix | 1,921 /148 | 0 | 0 | 33 | 100 | 100 |
| BHAW | 2,225 /0 | 3 | 0 | 29 (62) | 90 | |
| BHAmix | 1,473 /158 | 3 | 0 | 29 | 95 |
NCI is the number of counter ions; the sign indicates the charge on the ion. Percentage of α-helix and β-strands are calculated on all the residues. Turn1 and Turn2 columns contain the BET and BHA loop regions; in the MLT, values reported under Turn1 are calculated on all the residues. The crystallographic secondary structure content is reported in parentheses. Secondary-structure calculations are based on the Kabsch–Sander algorithm (43).
W indicates the water simulation; mix indicates the TFE/water simulation.
SPC, simple point charge.
The GROMOS96 force field (27) was used. The simple point charge (28) water model was used together with the TFE model optimized by Fioroni et al. (14). The LINCS algorithm (29) was used to constrain all bond lengths in the peptides and TFE. For the water molecules the SETTLE algorithm (30) was used. A dielectric permittivity, ɛr = 1, and a time step of 2 fs were used. A twin-range cutoff was used for the calculation of the nonbonded interactions. The short-range cut-off radius was set to 0.8 nm and the long-range cut-off radius was set to 1.4 nm for both Coulombic and Lennard–Jones interactions. The cut-off values are the same as those used for the GROMOS96 force field parameterization (27). Interactions within the short-range cutoff were updated every time step, whereas interactions within the long-range cutoff were updated every five time steps together with the pair list. All atoms were given an initial velocity obtained from a Maxwellian distribution at the desired initial temperature. All of the simulations, starting from the crystallographic and/or average NMR structure, were equilibrated by 100 ps of MD with position restraints on the peptide to allow for the relaxation of the solvent molecules. These first equilibration runs were followed by other 50-ps runs without position restraints on the peptide. The production runs at constant temperature and pressure conditions, after equilibration, were 20 ns long. All simulations and the analysis of the resulting trajectories were performed by using the GROMACS software package (31).
The concentration (% vol/vol) of TFE molecules around the peptide residues, named local TFE concentration (LTC), was evaluated from the number of solvent and cosolvent molecules present in a shell of 0.6 nm around the peptide residues and considering the average excluded volume value of 0.019 and 0.07 liters⋅mol−1 for water and TFE, respectively.
Results
Structural and Dynamical Properties.
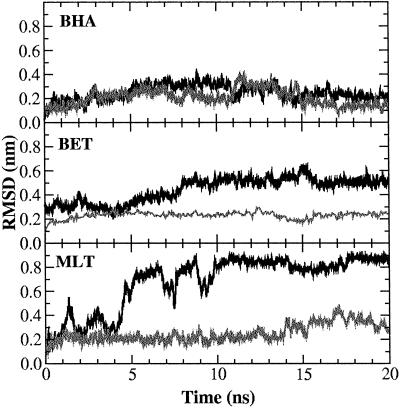
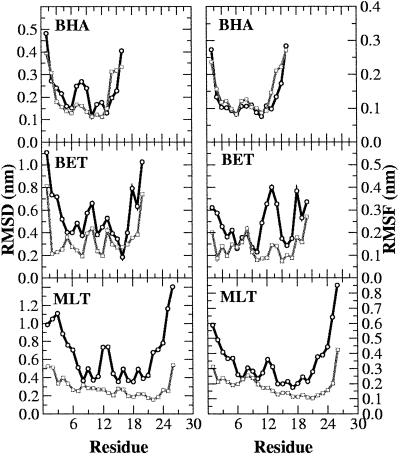
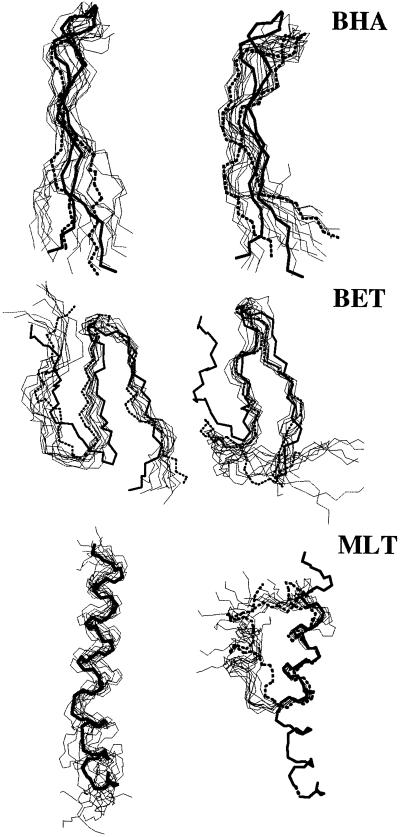
In Fig. 1, the rms deviation (RMSD) with respect to the initial structure for each of the three peptides in both pure water and a TFE/water mixture as a function of time is reported. It is immediately evident that in each case the peptide remains closer to its starting conformation in the TFE/water mixture than in pure water. In MLT, in particular, a large increase occurs in the RMSD value in water indicating the rapid divergence away from the starting conformation. After 5 ns the RMSD has reached a value in excess of 0.5 nm. The increase in the RMSD value in water is the result of fraying of the C-terminal region of the helix and the formation of a large bend involving residues 9–11. That MLT is unstable when simulated in pure water has been observed by using different MD protocols (32, 33). In contrast to its behavior in water, in the TFE/water mixture MLT is stable with the RMSD remaining almost constant at around 0.2 nm for the first 13 ns of the simulation, rising to 0.35 nm during the last 6 ns because of fraying at the N terminus. Large deviations occur for both the N and C termini and the central residues in the water simulation. The rms fluctuation (RMSF) per residue (Fig. 2 Top Right) also shows that for MLT the overall mobility of residues in water is larger than that in the TFE/water mixture. Secondary-structure analysis based on the Dictionary of Secondary Structure of Proteins criteria revealed that well defined helical segments occur in both simulations. However, whereas in the TFE/water simulation the C-terminal region remains well defined throughout the simulation, in water, fraying is evident from the beginning of the run. As noted above the N-terminal helix frays slightly in TFE/water during the last few nanoseconds. Despite this slight fraying, it is clear that in TFE/water the final structure still closely resembles the almost linear conformation found crystallographically (see Fig. 3 Top). In Fig. 2 Top Left, the RMSD per residue is reported. In water the central region of the peptide (residues 9–11) also loses its initial helical structure (see Fig. 3 Bottom). The secondary-structure content for each of the peptides is summarized in Table 1.
Fig 1.
Backbone RMSD with respect to the minimized initial structure of MLT, BET, and BHA simulations. Black curve, water simulation; gray curve, TFE/water simulation.
Fig 2.
Backbone RMSD (Left) and RMSF (Right) from the initial minimized structure of MLT, BET, and BHA. The water simulations are represented by black lines and the mixtures by gray lines.
Fig 3.
Comparisons of the superimpositions of 10 backbone conformations sampled from TFE/water mixture (Left) and water (Right) simulations. Bold solid and dotted lines indicate the initial and the final conformations, respectively.
In water BET is extremely flexible and tends to populate a wide range of conformational states (10), which is reflected in both the RMSD as a function of simulation time (Fig. 1 Middle) and in the secondary-structure analysis (Table 1). In water, the geometry of system deviates significantly from that of an ideal three-stranded antiparallel β-sheet. Nevertheless, most of the experimentally NMR-derived constraints are still satisfied (10). In the simulation, only two of the three possible β-strands are ordered, partially forming the β-hairpin (strands 2 and 3) on which the design of the peptide was based. In TFE/water, in contrast, BET maintains a three-stranded β-sheet throughout the simulation. The RMSD (Fig. 1 Middle) with respect to the average NMR structure remains steady at ≈0.13 nm in TFE/water as opposed to reaching a value of ≈0.4 nm in water. In addition, in TFE/water, the geometry of the second turn connecting strands 2 and 3 remains close to ideal during the whole simulation with strands 2 and 3 forming a well defined β-sheet. The geometry of the first turn, involving residues Asn-7 and Gly-8, fluctuates. According to the Dictionary of Secondary Structure of Proteins criteria it is defined as bend for most of the simulation. Nevertheless, an ideal turn geometry is recovered at several times during the simulation remaining stable for up to 1.5 ns. Despite the absence of an ideal turn geometry strand 1 adopts a β-sheet conformation throughout. BET is less flexible in TFE/water than in water. The RMSF per residue (Fig. 2 Middle Right) illustrates this clearly. The residues showing the most pronounced differences in flexibility between pure water and the TFE/water mixture are those involved in turn formation. In the TFE/water mixture the stability of the β-hairpin involving strands 1 and 2 is enhanced. Residues 3–6 and 9–12 in particular show low fluctuations (Fig. 2 Middle Right). Moreover, the interstrand hydrogen bonds between strands 1 and 2 and strands 2 and 3 are more persistent in TFE/water than in water alone, in particular, between strands 1 and 2.
Fig. 1 Top shows the backbone RMSD with respect to the starting crystal structure for the BHA peptide as a function of time. The curves corresponding to the simulations in water and in TFE/water are similar. In both cases the RMSD reaches a value of ≈0.3 nm within the first 7 ns. These values are similar to those obtained in a previous study (9). The RMSD in the mixture is slightly lower than in water. The average deviation calculated for the last 10 ns being 0.30 ± 0.07 nm in water as opposed to 0.24 ± 0.05 nm in the mixture. The deviations per residue (Fig. 2 Top Left) are also larger in water. In particular, the residues in the loop region show significant deviations from the crystal conformation in water. From Fig. 3 Top it can be seen that in water BHA adopts a twisted conformation around the peptide axis, as described by Roccatano et al. (9). In TFE/water this twist is less pronounced. In both the simulations some loss of secondary structure occurs, in particular, at the ends of the two strands. As noted previously in regard to BET the most obvious difference between the two simulations is in the loop region. Whereas in TFE/water the geometry of the turn is well conserved throughout the simulation, in water the turn geometry fluctuates being recognized approximately a third of the time as the bend. These fluctuations are in turn related to the twisting of the peptide (9, 34, 35).
Distribution of the Solvent Molecules Around Peptides.
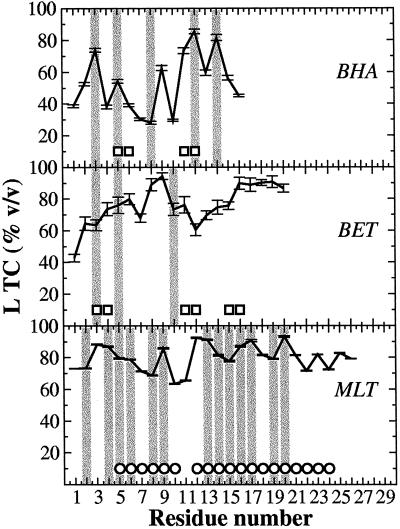
In Fig. 4, the LTC per residue in each of the three systems is reported. The LTC was calculated by determining the relative numbers of TFE and water molecules within a 0.6-nm shell surrounding each residue. In MLT the concentration of TFE in close proximity to the helix is on average [80% (vol/vol)] 2.5 times higher than the bulk, which indicates a strong tendency of the TFE molecules to coat the helix. The residues are almost uniformly solvated by TFE, and little to no correlation exists between the LTC and either the nature of the residue or the secondary structure. The slightly lower concentration of TFE around residue 11 (close to the kink in the helix) is probably a consequence of steric hindrance. The average LTC around BET is again 2.5 times higher than the bulk and covers a range similar to that found in MLT. In contrast, the LTC around the residues of BHA (Fig. 4) is much less homogeneous. The average value of the LTC is 53% (vol/vol), indicating a reduced tendency for TFE to aggregate around the peptide. The highest values correspond to residues Trp-43, Phe-52, and Val-54, suggesting some correlation with the apolar character of the residues.
Fig 4.
Local TFE concentration around MLT, BET, and BHA residues. Gray bars indicate the position of hydrophobic residues. The most probable conformation is indicated for each residue (α-helix, circles; β-strand, squares).
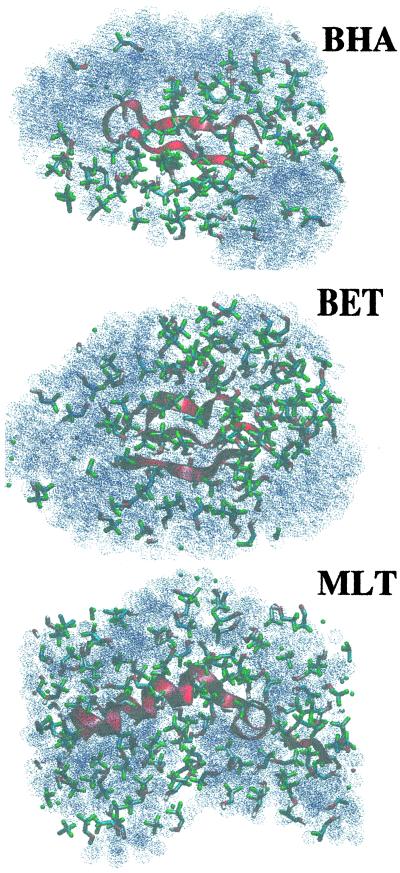
The results suggest that TFE displaces water from the immediate environment of the peptide, which in turn would decrease the chance of forming favorable interactions (such as hydrogen bonds) between either the backbone of the peptide and water or the amino acid side chains and water. In Fig. 5, snapshots of the last frames from TFE/water simulations of the three peptides are reported. From these pictures, the coating effect of TFE is evident. Analysis of the number of contacts among the residues forming the hydrophobic core of BET and BHA shows that the hydrophobic core is, nevertheless, not disrupted by the presence of TFE. A contact was considered to exist if the distance between two atoms belonging to different residues was less than 0.6 nm. The hydrophobic cluster of BHA was considered to include residues Trp-43, Tyr-45, Phe-52, and Val-54. The hydrophobic cluster of BET included residues Trp-3, Val-5, and Tyr-10. In both BHA and BET the number of hydrophobic contacts in water and the TFE mixture were essentially identical differing by less than 4% between the two environments with, in the BHA, slightly more contacts being in TFE and, in the BET, slightly more contacts being in water.
Fig 5.
Snapshots of the last frames from MLT, BET, and BHA simulations. Only solvent molecules within 1 nm of any peptide atom are shown. For clarity, water molecules are represented as dotted van der Waals spheres.
Discussion
The effect of TFE on the stability of α-helix-forming peptides has been investigated by several authors (36–38). In line with the results of these previous studies we find that in TFE/water MLT retains an almost linear conformation for at least 16 ns, whereas in water it rapidly bends in the proximity of residue 14. An extended conformation similar to what we observe has also been found in simulations of MLT in pure methanol (33), a membrane environment (32, 39, 40), and 1,1,1,3,3,3-hexafluoropropan-2-ol/water mixtures (18).
A few studies of sheet-forming peptides in TFE/water mixtures have been done. In this work, we find, in the BET, a marked increase in stability in the presence of TFE. In the BHA the effect of TFE on the stability of the peptide is less evident, in part, because the peptide is highly stable in water. The β-hairpin is, however, less twisted around its axis in TFE as compared with water because the turn region remains closer to the conformation found in the crystal. In fact the predominate effect of TFE on BET and BHA seems to be in the stabilization of the turn regions. The importance of turn regions in determining the folding and the stability of β-forming structures has been shown by several groups (35, 41, 42), and the selective stabilization of turn regions by TFE has been demonstrated by several recent NMR studies (34, 35, 41), which certainly could in part account for the effect of TFE on the stability β-sheet-forming peptides.
In the simulations it was also observed that the TFE molecules coat the peptides, limiting the accessibility of water to the surface (Fig. 5). This observation supports the conclusions drawn from the results of recent NMR diffusion measurements and MD calculations (7, 8). In particular, it has been shown that in ethanol/water mixtures the ethanol cosolvent has less of a tendency to coat a short model peptide as compared with TFE at similar concentrations in TFE/water mixtures (8). The effect of TFE on peptides is most likely due to this ability to coat the surface of the peptide effectively. By aggregating around the solute the TFE molecules exclude water, favoring the formation of intramolecular hydrogen bonds and promoting the formation of secondary structure. This result is similar to the indirect chaotropic mechanism of Walgers et al. (44). At the same time, TFE, despite having a lower dielectric constant than water, does not significantly disrupt hydrophobic interactions, which are important in the stability of both BHA and BET. In this respect the action of TFE differs considerably from the action of protein denaturants such as urea. Denaturants such as urea are believed to interact strongly with the protein and absorb (hydrogen bond) onto charged/hydrophilic residues situated at the surface of the protein (45). The urea displaces interactions between the surface residues, leading to the swelling of the protein, the exposure of hydrophobic residues, and eventually to the penetration of water and denaturant into the core of the protein. In TFE, the interaction between the cosolvent and the peptide is weak (46). Although a layer is formed over the surface of the peptide, the interactions between the peptide and TFE do not displace the peptide–peptide interactions. Not all aspects of the effect of TFE on the behavior of peptides in solution can be inferred from the simulations. For one, TFE is known to stabilize helix formation preferentially, even at the expense of sheet in some cases. In the simulations we find that the local TFE concentration around the peptide is higher in the MLT (a helix) as compared with that of BHA (a hairpin) and that the hydrophobic residues in both BET and BHA are more exposed to solvent. In fact, TFE seems to stabilize primarily only the turn region in the β-sheet-forming peptides investigated. These factors suggests that TFE would favor helix over sheet, especially in the larger sequences, but are only qualitative. Also the observation that the deviation of the structures is less in TFE mixtures than in water, although suggestive, is not in itself proof that the folded states are more stable in the presence of TFE. For this proof, equilibrium simulations that sample both folded and unfolded states would be required (12).
Conclusions
In this study, we have used MD simulations to study the effect of TFE as a cosolvent on the stability of three different peptides to understand better the molecular basis of the secondary structure-inducing capabilities of TFE. The simulations show that in a TFE/water mixture the organic cosolvent aggregates around the peptide forming a matrix that partly excludes water. This matrix in turn promotes the formation of local interactions and, as a consequence, ordered secondary structure. By displacing water from the surface TFE has several effects: first, it removes alternative hydrogen-bonding partners and, second, it provides a low dielectric environment. Together, these factors favor the formation of intrapeptide hydrogen bonds. In addition, and in contrast with most other organic solvents, TFE interacts only weakly with nonpolar residues, which means that TFE does not severely disrupt hydrophobic interactions within the peptides. As a consequence, TFE promotes stability rather than inducing denaturation.
Acknowledgments
D.R. thanks Professor Alfredo Di Nola for his generous support. This work was partly supported by European Community Training and Mobility Research Network Project ERBFMRXCT960013 and the Vigoni project. M.F. was supported by European Community Training and Mobility Research Network Project ERBFMR-XCT970120.
Abbreviations
TFE, 2,2,2-trifluoroethanol
MLT, Melittin
BET, Betanova
BHA, β-hairpin 41–56
MD, molecular dynamics
RMSD, rms deviation
RMSF, root mean square fluctuation
LTC, local TFE concentration
This paper was submitted directly (Track II) to the PNAS office.
References
- 1.Buck M. (1998) Q. Rev. Biophys. 31, 297-355. [DOI] [PubMed] [Google Scholar]
- 2.Hong D.-P., Hoshino, M., Kuboi, R. & Goto, Y. (1999) J. Am. Chem. Soc. 121, 8427-8433. [Google Scholar]
- 3.Jasanoff A. & Fersht, A. (1994) Biochemistry 33, 2129-2135. [DOI] [PubMed] [Google Scholar]
- 4.Luo P. & Baldwin, R. L. (1997) Biochemistry 36, 8413-8421. [DOI] [PubMed] [Google Scholar]
- 5.Reiersen H. & Rees, A. R. (2000) Protein Eng. 13, 739-743. [DOI] [PubMed] [Google Scholar]
- 6.Diaz M. D. & Berger, S. (2001) Magn. Reson. Chem. 39, 369-373. [Google Scholar]
- 7.Diaz M. D., Fioroni, M., Burger, K. & Berger, S. (2002) Chem. Eur. J. 8, 1663-1669. [DOI] [PubMed] [Google Scholar]
- 8.Fioroni M., Diaz, M. D., Burger, K. & Berger, S. (2002) J. Am. Chem. Soc. 124, 7737-7744. [DOI] [PubMed] [Google Scholar]
- 9.Roccatano D., Amadei, A., Di Nola, A. & Berendsen, H. J. C. (1999) Protein Sci. 8, 2130-2143. [DOI] [PMC free article] [PubMed] [Google Scholar]
- 10.Colombo G., Roccatano, D. & Mark, A. E. (2002) Proteins Struct. Funct. Genet. 46, 380-392. [DOI] [PubMed] [Google Scholar]
- 11.Garcia A. E. & Sanbonmatsu, K. Y. (2001) Proteins Struct. Funct. Genet. 42, 345-354. [DOI] [PubMed] [Google Scholar]
- 12.Daura X., Jaun, B., Seebach, D., van Gunsteren, W. F. & Mark, A. E. (1998) J. Mol. Biol. 280, 925-932. [DOI] [PubMed] [Google Scholar]
- 13.Daura X., van Gunsteren, W. F. & Mark, A. E. (1999) Proteins 34, 269-280. [DOI] [PubMed] [Google Scholar]
- 14.Fioroni M., Burger, K., Mark, A. E. & Roccatano, D. (2000) J. Phys. Chem. B 104, 12347-12354. [Google Scholar]
- 15.Chitra R. & Smith, P. E. (2001) J. Chem. Phys. 115, 5521-5530. [Google Scholar]
- 16.Chitra R. & Smith, P. E. (2002) J. Phys. Chem. B 106, 1491-1500. [Google Scholar]
- 17.Timasheff S. N. & Arakawa, T. (1989) in Protein Structure: A Practical Approach, ed. Creighton, T. (IRL, Oxford), pp. 331–345.
- 18.Fioroni M., Burger, K., Mark, A. E. & Roccatano, D. (2001) J. Phys. Chem. B 105, 10967-10975. [Google Scholar]
- 19.Kempe M. D., Buckley, P., Yuan, P. & Prendergast, F. G. (1997) Biochemistry 36, 1678-1688. [DOI] [PubMed] [Google Scholar]
- 20.Hirota-Nakaoka N. & Goto, Y. (1999) Bioorg. Med. Chem. 7, 67-73. [DOI] [PubMed] [Google Scholar]
- 21.Kortemme T., Ramirez-Alvarado, M. & Serrano, L. (1998) Science 281, 253-256. [DOI] [PubMed] [Google Scholar]
- 22.Bursulaya B. & Brooks, C. L., III (1999) J. Am. Chem. Soc. 121, 9947-9951. [Google Scholar]
- 23.van der Vaart A., Bursulaya, B. D., Brooks, C. L., III & Merz, K. M., Jr. (2000) J. Phys. Chem. B 104, 9554-9563. [Google Scholar]
- 24.Blanco F., Rivas, G. & Serrano, L. (1996) Nat. Struct. Biol. 1, 584-590. [DOI] [PubMed] [Google Scholar]
- 25.Blanco F. & Serrano, L. (1995) Eur. J. Biochem. 230, 634-649. [DOI] [PubMed] [Google Scholar]
- 26.Berendsen H. J. C., Postma, J. P. M., van Gunsteren, W. F., Di Nola, A. & Haak, J. R. (1984) J. Chem. Phys. 81, 3684-3690. [Google Scholar]
- 27.van Gunsteren W. F., Daura, X. & Mark, A. E. (1998) Encycl. Comput. Chem. 2, 1211-1216. [Google Scholar]
- 28.Berendsen H. J. C., Grigera, J. R. & Straatsma, T. P. (1987) J. Phys. Chem. 91, 6269-6271. [Google Scholar]
- 29.Hess B., Bekker, H., Berendsen, H. J. C. & Fraaije, J. G. E. M. (1997) J. Comp. Chem. 18, 1463-1472. [Google Scholar]
- 30.Miyamoto S. & Kollman, P. A. (1992) J. Comp. Chem. 13, 952-962. [Google Scholar]
- 31.van der Spoel D., van Drunen, R. & Berendsen, H. J. C., (1994) Groningen Machine for Chemical Simulations (BIOSON Research Institute, Groningen, The Netherlands).
- 32.Lin J. H. & Baumgaertner, A. (2000) Comp. Theor. Polymer Sci. 10, 97-102. [Google Scholar]
- 33.Sessions R. B., Gibbs, N. & Dempsey, C. E. (1998) Biophys. J. 74, 138-152. [DOI] [PMC free article] [PubMed] [Google Scholar]
- 34.Gibbs A. C., Bjorndahl, T. C., Hodges, R. S. & Wishart, D. S. (2002) J. Am. Chem. Soc. 124, 1203-1213. [DOI] [PubMed] [Google Scholar]
- 35.Griffiths-Jones S. R., Maynard, A. J. & Searle, M. S. (1999) J. Mol. Biol. 292, 1051-1069. [DOI] [PubMed] [Google Scholar]
- 36.van Buuren A. R. & Berendsen, H. J. C. (1993) Biopolymers 33, 1159-1166. [DOI] [PubMed] [Google Scholar]
- 37.De Loof H., Nilsson, L. & Rigler, R. (1992) J. Am. Chem. Soc. 114, 4028-4035. [Google Scholar]
- 38.Bodkin M. J. & Goodfellow, J. M. (1995) Biopolymers 39, 43-50. [DOI] [PubMed] [Google Scholar]
- 39.Bernèche S., Nina, M. & Roux, B. (1998) Biophys. J. 75, 1603-1618. [DOI] [PMC free article] [PubMed] [Google Scholar]
- 40.Bachar M. & Becker, O. M. (2000) Biophys. J. 78, 1359-1375. [DOI] [PMC free article] [PubMed] [Google Scholar]
- 41.de Alba E., Jimenez, M. A. & Rico, M. (1997) J. Am. Chem. Soc. 119, 175-183. [Google Scholar]
- 42.Klimov D. K. & Thirumalai, D. (2000) Proc. Natl. Acad. Sci. USA 97, 2544-2549. [DOI] [PMC free article] [PubMed] [Google Scholar]
- 43.Kabsch W. & Sander, C. (1983) Biopolymers 22, 2576-2637. [DOI] [PubMed] [Google Scholar]
- 44.Walgers R., Lee, T. C. & Cammers-Goodwin, A. (1998) J. Am. Chem. Soc. 120, 5073-5079. [Google Scholar]
- 45.Wallqvist A., Covell, D. G. & Thirumalai, D. (1999) J. Am. Chem. Soc. 120, 427-428. [Google Scholar]
- 46.Chitra R. & Smith, P. E. (2001) J. Phys. Chem. B 105, 11513-11522. [Google Scholar]


