Abstract
Hematopoietic stem cells (HSCs) can be identified by a “side population” (SP) phenotype. Previous studies have implicated the ATP binding cassette transporter genes Mdr1a/1b and/or Bcrp1 in the SP phenotype. To define the relative role of these transporters, we generated Bcrp1 null mice and evaluated HSCs both functionally and phenotypically. Loss of Bcrp1 gene expression, but not Mdr1a/1b, led to a significant reduction in the number of SP cells in the bone marrow and in skeletal muscle. In the bone marrow, there was a nearly absolute loss of lineage negative, c-Kit-positive, Sca-1-positive SP cells, and the residual SP cells were depleted of repopulating cells in a transplant assay, demonstrating that Bcrp1 expression is necessary for the SP phenotype in HSCs. Furthermore, Bcrp1 null hematopoietic cells were significantly more sensitive to mitoxantrone in drug-treated transplanted mice. These results show that Bcrp1 gene expression alone defines the SP stem cell phenotype, and suggest that the physiological function of Bcrp1 expression in HSCs is to provide protection from cytotoxic substrates.
One defining property of hematopoietic stem cells (HSC) is low fluorescence after staining with fluorescent dyes such as rhodamine 123 (1) and Hoechst 33342 (Hoechst) (2). A recently developed technique employing Hoechst staining of HSCs identifies a small fraction of bone marrow cells termed side population (SP) cells. SP cells are highly enriched for HSC activity and represent ≈0.05% of adult nucleated bone marrow cells in mice (3). SP stem cells have also been identified in hematopoietic compartments of other species such as humans, rhesus monkeys, swine (4–6), and in nonhematopoietic tissues such as skeletal muscle (7, 8), brain (9), and embryonic stem (ES) cells (10). Based on the conserved SP phenotype in a wide variety of different types of stem cells, the molecule(s) that determine the SP phenotype are of interest as potentially novel stem cell markers, and may be conferring required functional properties.
Expression of Bcrp1 (mouse)/ABCG2 (human) and/or Mdr1a/1b(mouse)/MDR1(human), members of ATP binding cassette (ABC) transporter superfamily, has been implicated in the SP phenotype. Both ABCG2 and MDR1 are expressed in stem cells (10–14), and enforced expression of either confers the SP phenotype in a variety of transduced cells (10–12, 15). Moreover, enforced expression of either ABCG2 or MDR1 with retroviral vectors can have direct functional effects on murine stem cells in vivo; expression of ABCG2 blocked hematopoietic development (10), whereas overexpression of MDR1 resulted in HSC expansion and a myeloproliferative disease (15, 16). These results suggest that the conserved expression of these transporters in stem cells could reflect a required functional role.
We have demonstrated that Mdr1-type gene products are not required for the SP phenotype by showing that mice deficient for Mdr1a/1b genes have normal numbers of SP cells in bone marrow (10). These SP cells were shown to express Bcrp1 mRNA, which alone is sufficient to confer the SP phenotype in bone marrow cells. However, because both Mdr1a/1b and Bcrp1 are coexpressed in stem cells, they both could provide a redundant function resulting in the SP phenotype. Alternatively, it is possible that Bcrp1 is the sole determinant of the SP phenotype in HSC, which would further justify using Bcrp1 expression as a stem cell purification marker. To distinguish between these two possibilities, and to test whether Bcrp1 gene expression had functional significance in stem cells, we generated Bcrp1 null mice and studied their HSC compartment.
Methods
Mice.
Mdr1a/1b−/− mice (17) on an FVB background were obtained from Taconic Farms (Germantown, NY). Female C57BL/6J (CD45.2) and B6.SJL-PtprcaPep3b/BoyJ (CD45.1) mice were purchased from The Jackson Laboratories. All mice were used between 6 and 14 weeks of age. All mouse experiments were approved by the Institutional Animal Care and Use Committee of St. Jude Children's Research Hospital.
Generation of Bcrp1 Knockout Mice.
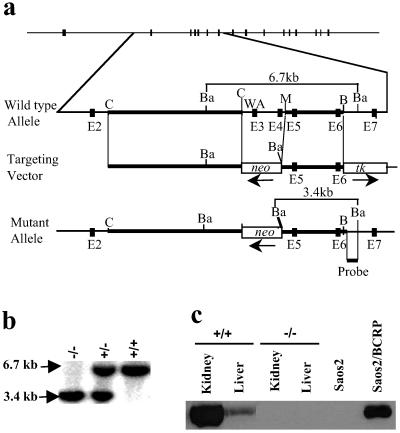
A murine genomic DNA bacterial artificial chromosome library (Genome Systems, St. Louis) was screened with a partial Bcrp1 cDNA probe generated by RT-PCR based on the published sequence. A genomic clone containing the upstream portion of Bcrp1 gene was isolated and characterized. A ClaI–ClaI fragment from intron 2 and a MunI–BglII fragment encompassing exons 5 and 6 were subcloned upstream and downstream of the pgk-neo cassette of the pKONTKV1901 vector (Stratagene), respectively, to generate the targeting vector. The resulting vector was linearized by NotI digestion and electroporated into 129/Ola-derived E14 ES cells. Genomic DNA from clones that survived 8 days of G418 (350 μg/ml) and Gancyclovir (2 μM) selection were screened by Southern blot analysis with BamHI digestion using a 660-bp probe located downstream of the MunI–BglII fragment. The wild-type allele gave rise to a 6.7-kb band, whereas the targeted allele gave a 3.4-kb band because of the introduction of an extra BamHI site into the genome. Chimeric mice were generated by injection of a Bcrp1+/− ES clone into blastocyst of C57BL/6 mice and reimplantation. Genetic transmission of the disrupted allele was screened for by Southern blot analysis of tail DNA. Our subsequent experiments and analyses were performed on 6- to 14-week-old mice with a mixed genetic background of 129/Ola and C57BL/6.
Bcrp1 Protein Detection.
Immunoblot of cell membrane protein extracts from kidney and liver was performed using a polyclonal rabbit-anti-human ABCG2 antibody raised against a Walker A peptide. The ABCG2 antiserum was developed by immunization of rabbits with a keyhole lympet hemocyanin-conjugated 14-residue peptide (GKS SLL DVL AAR KD) that is conserved between mouse Bcrp1 and human ABCG2. The crude antiserum was purified over a peptide affinity column. Subsequent studies determined that this antibody detected ABCG2 in membranes from drug-selected MCF-7 cells overexpressing ABCG2 (kindly provided by Erasmus Schneider, Wadsworth Center, Albany, NY). The immunoreactive proteins were visualized with the enhanced chemiluminescence method (Amersham Pharmacia).
Hoechst and Antibody Staining for Flow Cytometry Analysis.
Hoechst staining of bone marrow cells for SP cell analysis was done as described (3), except that various concentrations of Hoechst were used. Typically, 4 × 10⁶ cells were stained in 4 ml of DMEM+ medium for 90 min at 37°C. After Hoechst staining, all cells were resuspended into 100 μl of Hanks' balanced salt solution (HBSS)+ medium and incubated with biotinylated Mouse Lineage Panel antibodies comprising CD3e, B220, Gr-1, Mac-1, and Ter119 (6 μl each), together with FITC-conjugated c-Kit antibody (2B8) and phycoerythrin-conjugated Sca-1 antibody (E13–161.7) (3 μl each) (all from PharMingen) for 20 min on ice. After washing, the cells were resuspended into 100 μl HBSS+ and incubated with 20 μl of streptavidin/allophycocyanin (APC) (Becton Dickinson) for 20 min on ice, washed again, and resuspended into 0.5 ml HBSS+ and kept on ice to be analyzed in a FACS-vantage flow cytometry (Becton Dickinson). SP gates were defined using wild-type bone marrow cells stained with 4.5 μg/ml Hoechst, so that between 0.01 and 0.03% SP cells were in the gated region. These gates were then used to define SP cells from Bcrp1−/− mice, and for other Hoechst dye concentrations. Gates for antibody staining were set using isotype controls, so that less than 1% of cells were positive for isotype antibody staining. SP analysis of skeletal muscle myoblasts was carried out as described (7) except that 0.1% collagenase was used for dissociation of myoblast and 3.5 μg/ml Hoechst was used for SP staining. After Hoechst staining, cells were spun down and stained with FITC-conjugated anti-CD45.2 (clone 104, PharMingen) for flow cytometry analysis.
Competitive Repopulation Assay.
Wild-type bone marrow cells from age-matched B6.SJL-PtprcaPep3b/BoyJ (CD45.1) mice were mixed in varying ratios with Bcrp1−/− (CD45.2) bone marrow cells (either bulk or sorted SP cells) and injected into lethally irradiated (11 Gy) C57BL/6J recipient mice via lateral tail vein. Peripheral blood was collected at various intervals after transplantation to analyze relative contribution from each donor by using FITC-conjugated anti-CD45.2, phycoerythrin-conjugated Thy1.2 (30-H12), B220 (RA3–6B2), and APC-conjugated Gr-1 (RB6–8C5) and Mac-1(M1/70) antibodies (all from PharMingen) by flow cytometry.
For mitoxantrone treatment, transplanted mice were divided into 2 groups; one group treated with mitoxantrone (Sigma) and the other group left untreated as control. Mitoxantrone was injected i.p. once a day for 5 consecutive days, at 1 mg/kg for the first round of treatment and 2 mg/kg for the second round of treatment. At various time points after the treatment, blood samples were collected and analyzed for CD45.1/45.2 chimerism by flow cytometry as described above.
Results
Generation of Bcrp1 Null Mutant Mice.
Both human ABCG2 and the mouse Bcrp1 gene contain 16 exons. Exon 3 encodes the putative Walker A motif, which is essential for ATP hydrolysis and transport function of the molecule (10, 18). The Bcrp1 gene was disrupted in murine ES cells by replacing exons 3 and 4 with a neomycin cassette via homologous recombination (Fig. 1a). In addition to the exonic deletions, this design results in a frame shift and premature translational stop at codon 71. The disruption of Bcrp1 locus was confirmed in heterozygous and homozygous mice by Southern blot analysis of tail DNA (Fig. 1b). Western blot analysis of kidney and liver protein extracts confirmed that there was no detectable Bcrp1 protein in Bcrp1−/− mice (Fig. 1c).
Fig 1.
Targeted disruption of the Bcrp1 locus. (a) The top line shows the 16 exons of Bcrp1 as filled boxes. The wild-type allele is shown in more detail below, with exons 2–7 shown as dark boxes, with restriction sites shown as indicated (C, ClaI; B, BglII; M, MunI; Ba, BamHI). Exon 3 contains the Walker A (WA) motif necessary for Bcrp1 efflux function. The targeting vector was designed to replace the exons 3 and 4 with a pgk-neo cassette. Thick lines show the 5′ and 3′ homologous arms used for recombination, and the location and orientation of the pgk-neo and hsv-tk cassettes are shown. The position of probe for screening correctly targeted ES clones and mice is indicated below the schematic for the mutant allele. The diagnostic fragment sizes for the wild-type (6.7 kb) and mutant allele (3.4 kb) with BamHI digestion is for both alleles. (b) Representative Southern blot analysis of tail DNA from Bcrp1−/−, Bcrp1+/−, and Bcrp1+/+ mice after BamHI digestion. (c) Immunoblot of kidney and liver tissue lysates from wild-type and Bcrp1−/− mice using a polyclonal anti-ABCG2 antibody. As controls, lysates from Saos2 and Saos2 cells expressing BCRP (Saos2/BCRP) are also shown.
Pooled data from heterozygote crosses showed a normal Mendellian ratio with 20% Bcrp1+/+, 54% Bcrp1+/−, and 26% Bcrp1−/− mice in 152 offspring analyzed, showing that Bcrp1 is not required for normal development. Bcrp1−/− mice, when interbred, were fertile and gave litters of normal size. Bcrp1−/− mice have been followed for up to 12 months of age without any detectable gross abnormalities. Microscopic histology of tissues from brain, lung, liver, kidney, and testis did not show any abnormalities. Despite the high expression of Bcrp1 in kidney and liver in wild-type mice, Bcrp1−/− mice did not reveal any biochemical abnormalities in the serum concentration of blood urea nitrogen, creatinine, total protein, or in urine bilirubin and protein.
Reduced Number of SP Cells in Bcrp1−/− Bone Marrow and Skeletal Muscle.
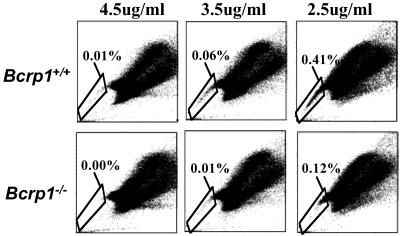
We next determined whether there was a reduction in the number of SP cells in the bone marrow of Bcrp1−/− mice. We used 3 different Hoechst dye concentrations (2.5, 3.5, and 4.5 μg/ml) to measure SP numbers through a range of dye efflux stringencies. In wild-type mice, the proportion of SP cells increased as the Hoechst concentration decreased (a representative experiment is shown in Fig. 2), presumably reflecting the inclusion of cells with lesser degrees of transporter activity into the SP region at lower dye concentrations.
Fig 2.
SP cell analysis of bone marrow cells from Bcrp1−/− mice at Hoechst concentrations of 4.5, 3.5, and 2.5 μg/ml. The results from a wild-type mouse are shown (Upper), as are the results of a Bcrp1−/− mouse (Lower). The percentage of SP cells in the total bone marrow is shown for each sample.
At every concentration of Hoechst tested, Bcrp1−/− mice had fewer SP cells than were seen in the bone marrow of wild-type mice (Fig. 2). At 4.5 μg/ml of Hoechst dye, essentially no SP cells were seen in Bcrp1−/− mice, whereas wild-type mice contained 0.02% ± 0.01 SP cells (n = 3) in the total bone marrow cell population. When the concentration of Hoechst was decreased to 3.5 or 2.5 μg/ml, SP cells in Bcrp1−/− samples could be detected but were still significantly less in number than that seen in wild-type samples (0.01% ± 0.01 versus 0.05% ± 0.02, P = 0.02 for 3.5 μg/ml; 0.09% ± 0.08 versus 0.24% ± 0.17, P = 0.03 for 2.5 μg/ml). At these lower Hoechst concentrations, SP cells from Bcrp1−/− samples appeared only in the upper “shoulder” region of the SP gate. There remained a relative paucity of cells at the “distal tip” of the SP region, an area corresponding to the highest degree of Hoechst efflux function and that has been shown to contain the greatest concentration of repopulating stem cells (4). Together, these results suggest that the subpopulation of SP cells that are true stem cells may have been selectively depleted in Bcrp 1−/− mice.
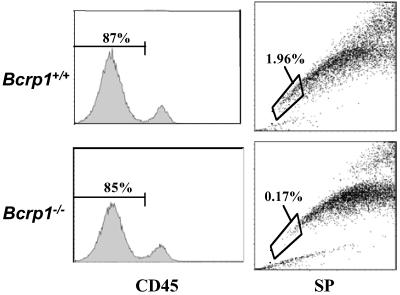
SP stem cells have been described in the skeletal muscle, and are comprised of mixtures of resident CD45+ hematopoietic cells, and CD45− cells of presumed skeletal muscle origin (7, 8). To determine whether the skeletal muscle SP cells were also decreased in the Bcrp1−/− mice, skeletal muscle cell preparations were stained with anti-CD45 antibody, and the CD45− fraction was gated and analyzed for SP cells (Fig. 3). A large reduction in SP cells was found in these CD45− skeletal muscle cells (1.95% vs. 0.16%, average of two experiments). This result shows that skeletal muscle SP cells, like bone marrow SP cells, are relatively dependent on Bcrp1 expression.
Fig 3.
SP cell analysis of CD45− skeletal muscle cells from Bcrp1−/− mice. Single cell suspensions from skeletal muscle tissue obtained from wild-type and Bcrp1−/− mice were stained with an anti-CD45 antibody and Hoechst dye. The CD45−, nonhematopoietic cells were gated (Left) and analyzed for SP cells (Right). The proportion of SP cells within the CD45− gate is shown for each sample.
SP Cells from Bcrp1−/− Bone Marrow Are Depleted of Phenotypic HSCs.
Although SP cells are highly enriched for HSC activity, they are not a pure stem cell population and contain a significant number of differentiated and committed cells (5). Therefore, one explanation for the persistence of SP cells in the bone marrow of Bcrp1−/− mice, seen at lower Hoechst concentrations in the shoulder region, is that more mature cells expressing alternate Hoechst dye transporters could thus appear as SP cells under these less stringent conditions. To evaluate this possibility, we examined whether bone marrow SP cells from Bcrp1−/− mice did in fact contain decreased numbers of HSCs defined by independent phenotypic markers. Gated SP cells from both Bcrp1−/− and wild-type mice were analyzed for expression of c-Kit+, Sca-1+, and a variety of mature lineage markers to identify the previously described c-Kit+Sca-1+Lineage− (K+S+L−) stem cell phenotype (19).
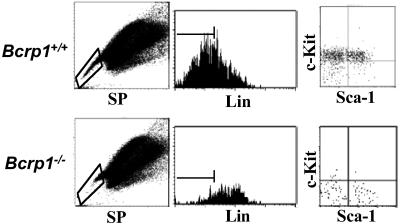
In wild-type mice, the majority of SP cells identified with 2.5 μg/ml of Hoechst were negative for mature lineage-specific markers, and the majority of these gated lineage negative cells were c-Kit+ (Fig. 4). In contrast, the residual SP cells in Bcrp1−/− bone marrow were mostly lineage positive cells. The gated lineage negative fraction was also different from wild type, with the majority of cells in Bcrp1−/− mice being negative for c-Kit expression. Although wild-type mice had a total of 30.6 ± 7.6% K+S+L− cells in the SP gated population (n = 3), Bcrp1−/− mice had only 0.8 ± 0.8% of all SP cells displaying the K+S+L− phenotype (n = 3, Fig. 4). These results show that residual SP cells in Bcrp1−/− mice are mostly mature cells, and that phenotypically defined K+S+L− stem cells are significantly depleted within the SP population.
Fig 4.
Immunophenotype of SP cells from Bcrp1−/− mice. Bone marrow cells from wild-type (Upper) and Bcrp1−/− mice (Lower) were stained with 2.5 μg/ml of Hoechst dye and antibodies to lineage markers, Sca-1 and c-Kit. Cells were first gated for SP cells (Left), and then analyzed for proportion of Lin− cells in the SP gate (Center). (Right) The distribution of c-Kit and Sca-1 markers in the gated SP, Lin− cells.
Analysis of K+S+L− Cells in Bcrp1−/− Mice.
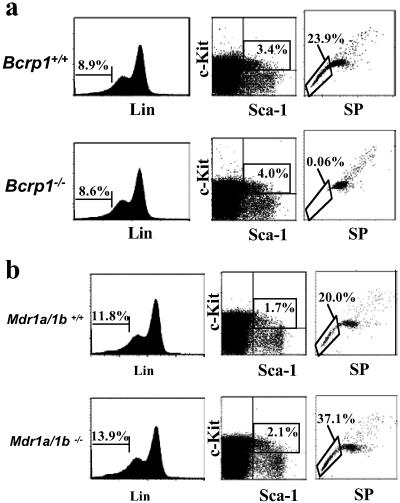
The depletion of K+S+L− cells in the SP region could be caused by an absolute loss of K+S+L− stem cells, either because of cell death or a direct alteration in the K+S+L− markers by Bcrp1 gene deletion. Alternatively, the loss of K+S+L− cells from the SP gate could be caused by a simple loss of dye efflux activity without an accompanying loss in cell numbers. To distinguish between these possibilities, we measured the absolute number of K+S+L− cells in the bone marrow of Bcrp1−/− mice. These analyses showed that there was no significant difference in the content of K+S+L− cells in the bone marrow of wild-type versus Bcrp1−/− mice (Fig. 5a). Wild-type mice had 0.22% ± 0.07 K+S+L− cells in the bone marrow versus 0.35% ± 0.21 in Bcrp1−/− mice (n = 3). The bone marrow cellularity was also the same in wild-type and Bcrp1−/− mice. Therefore, the loss of SP cells in the K+S+L− subpopulation from Bcrp1−/− mice was caused by simple loss of Hoechst efflux activity in this population, and not caused by loss of absolute K+S+L− cell numbers.
Fig 5.
Analysis of K+S+L− cells in Bcrp1−/− and Mdr1a/1b−/− mice. (a) Bone marrow cells from wild-type (Upper) and Bcrp1−/− mice (Lower) were stained with Hoechst dye and antibodies to Lin, Sca-1, and c-Kit. (Left) The percentage of Lin− cells in the bulk population. (Center) The percentage of c-Kit- and Sca-1-positive cells in the gated Lin− population. (Right) The proportion of SP cells in gated K+S+L− cells. (b) The same analysis was performed on wild-type mice (Upper) and Mdr1a/1b knockout mice (Lower). Gating and cell percentages were done as described above.
The K+S+L− cells from wild-type mice were highly enriched for SP cells when compared with bulk marrow. In wild-type mice, gating exclusively on K+S+L− cells showed that 22.6% ± 7.6 (n = 3) displayed the SP phenotype (Fig. 5a). In contrast, the gated K+S+L− cells in Bcrp1−/− mice were highly depleted of SP cells, with only 0.08% ± 0.03 (n = 3) appearing in the SP gate. In contrast to Bcrp1−/− mice, K+S+L− cells from Mdr1a/1b−/− mice were highly enriched for SP cells, giving results that are indistinguishable to that seen in wild-type mice (Fig. 5b). The specific absence of SP cells in the K+S+L− fraction from Bcrp1−/− mice further demonstrates that Bcrp1 is a necessary determinant of the SP phenotype in K+S+L− stem cells, and that Mdr1a/1b expression alone was not sufficient to maintain the SP phenotype.
Residual SP Cells from Bcrp1−/− Bone Marrow Are Depleted of Repopulating Cells.
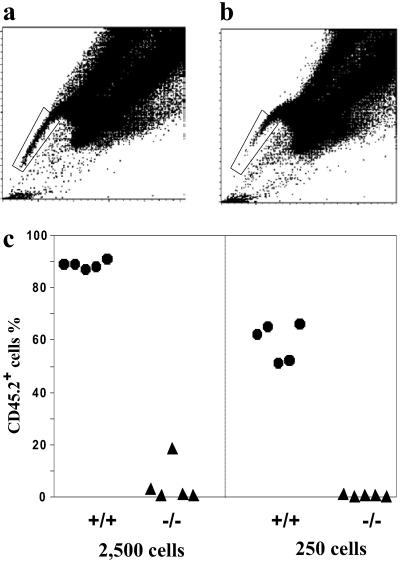
To further establish that the residual SP cells from Bcrp1−/− bone marrow were depleted of functional repopulating cells, SP cells from wild-type and Bcrp1−/− mice were isolated by cell sorting (Fig. 6), mixed with 2.5 × 10⁵ bulk bone marrow cells from wild-type mice (CD45.1+), and then infused into lethally irradiated mice in a competitive transplant assay. Four weeks after the transplantation, the myeloid reconstitution seen with wild-type SP cells was significantly higher than that seen with Bcrp1−/− SP cells (Fig. 6c). Significantly lower levels of lymphoid reconstitution were also seen with Bcrp1−/− SP cells (data not shown). Similar results were obtained when these mice were analyzed again at 9 weeks after transplantation. These results demonstrate that the residual SP cells in Bcrp1−/− mice were significantly depleted of short-term repopulating cells, and further argue that the loss of K+S+L− cells in the SP region could not be explained by a simple alteration in cell surface phenotype.
Fig 6.
Repopulation capability of sorted SP cells from Bcrp1−/− bone marrow. Sorting gate for wild-type SP cells (a) and Bcrp1−/− SP cells (b). (c) Reconstitution level of peripheral blood myeloid cells derived from the sorted SP cells 4 weeks after transplantation. The number of SP cells transplanted into each mouse is indicated at the bottom. Wild-type SP cells (•), Bcrp1−/− SP cells (▴).
Normal Steady-State Hematopoiesis in Bcrp1−/− Mice.
The expression of Bcrp1 in bone marrow HSCs, along with our prior demonstration that overexpression of ABCG2 caused a defect in hematopoietic development (10), led us to investigate whether Bcrp1−/− mice had any alterations in hematopoiesis. We found no abnormalities in the peripheral blood leukocyte count, hematocrit, and the number of myeloid progenitors in the bone marrow of Bcrp1−/− mice (data not shown). Immunophenotyping studies in the bone marrow, spleen, and thymus showed normal distributions of myeloid and lymphoid cells. Competitive repopulation assays to compare the overall stem cell activity in Bcrp1−/− versus Bcrp1+/+ mice showed no differences in stem cell activity in the bulk bone marrow populations (data not shown). Although Bcrp1/ABCG2 is expressed at relatively high level on natural killer (NK 1.1+) (mouse) or CD56+ (human) NK cells (10, 11), no difference in NK cell activity was noted between Bcrp1−/− and wild-type splenocytes using NK-sensitive YAC-1 tumor cells as target in a chromium release cytotoxicity assay (data not shown). These results demonstrate that steady state hematopoiesis is functionally normal in Bcrp1−/− mice, and that they contain a normal overall number of HSCs in the bone marrow, a result consistent with the overall normal number of K+S+L− cells.
Bcrp1 Expression Confers Relative Hematopoietic Protection from Mitoxantrone-Induced Toxicity.
Because Bcrp1 effluxes several different chemotherapeutic drugs such as topotecan and mitoxantrone (20), we next examined whether Bcrp1 expression played a role in protecting early hematopoietic cells from these drugs. Recipient mice from the competitive repopulation studies were treated with mitoxantrone, and the relative sensitivity of the wild-type versus the Bcrp1−/− graft was measured by assaying for shifts in peripheral blood chimerism. It is important to note that the transplant recipients were wild type in all other somatic tissues, so there should be no pharmacokinetic alterations in drug metabolism because Bcrp1 expression was normal in the liver, kidney, and intestine (21).
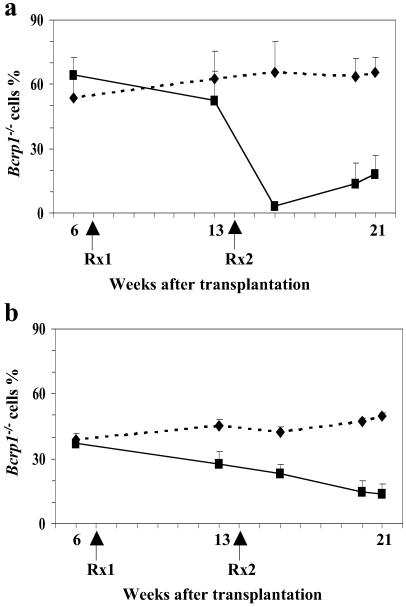
The mice were first treated with 1 mg/kg mitoxantrone for 5 consecutive days. Five weeks after this first treatment course, there was a modest decrease in Bcrp1−/− cells in both the peripheral blood myeloid and lymphoid compartments (Fig. 7). We then performed a second round of treatment with 2 mg/kg mitoxantrone. Six weeks after this second treatment, there was substantial decrease in the number of Bcrp1−/− cells. In a subsequent repeat experiment, transplanted mice were initially treated with 2 mg/kg of mitoxantrone for 5 consecutive days. Three weeks after the treatment, the number of Bcrp1−/− myeloid and lymphoid cells again showed significant decreases from 69.4% ± 5.8% to 1.9% ± 1.3%, and from 78% ± 5.7% to 55.4% ± 8.6% respectively (n = 5). Some mice were also treated with 150 mg/kg 5-fluorouracil (5-FU) to test whether the sensitivity was a substrate specific effect. Six weeks after the treatment, there was no difference in the chimerism between the 5-FU treated and nontreated group, ruling out an indirect effect of Bcrp1 on HSC or progenitor regeneration (data not shown). These results demonstrate that endogenous Bcrp1 expression protects hematopoietic cells from the toxic effects of mitoxantrone, and suggests a general detoxifying function in SP stem cells that could also apply to other genotoxic substrates.
Fig 7.
Effects of mitoxantrone on the number of Bcrp1−/− hematopoietic cells in the peripheral blood. (a) Bcrp1−/− chimerism in granulocytes (Gr-1+) and monocytes (Mac-1+). (b) Bcrp1−/− chimerism in B lymphocytes (B220+) and T lymphocytes (Thy1.2+). Mitoxantrone treated group (▪), untreated control group (⧫), n = 3. Rx1: first round of treatment with 1 mg/kg mitoxantrone; Rx2: second round of treatment with 2 mg/kg mitoxantrone.
Discussion
In previous studies, we have shown that retroviral vectors expressing either MDR1 or the human ortholog of Bcrp1 (ABCG2) directly conferred the SP phenotype in transduced bone marrow cells (10, 15). Furthermore, both Bcrp1 and Mdr1a/1b mRNAs were expressed in purified murine bone marrow SP cells (10). This raises the question of the relative roles of these transporters in the SP phenotype. We have also shown that Mdr1a/1b−/− mice contain normal numbers of SP cells in the bone marrow (10), demonstrating that expression of Mdr1a/1b is not required for the SP phenotype. All these data were consistent with the possibility that both Bcrp1 and Mdr1a/1b could be providing a redundant function in the SP phenotype. If this were true, the loss of expression of either transporter alone would not disrupt the SP phenotype.
The results reported here show that loss of Bcrp1 expression led to a significant defect in the SP compartment in murine bone marrow and skeletal muscle cells. We found significantly reduced numbers of SP cells in whole bone marrow populations from Bcrp1−/− mice, with essentially a complete loss of SP cells with K+S+L− stem cell phenotype. The small amounts of residual SP cells in Bcrp1−/− mice were more mature cells, mainly Lin+ and c-Kit−, Lin− cells, and were highly depleted of short-term repopulating cells. At the same time, there was a normal number of HSCs in the total bone marrow of Bcrp1−/− mice by both phenotypic and functional assays. These results show that Bcrp1 expression is required for HSCs to display the SP phenotype, but that with the loss of Bcrp1, these stem cells are maintained and simply appear outside the SP region.
The requirement of Bcrp1 expression for the SP phenotype in HSCs shows that Mdr1a/1b gene expression was not sufficient for compensation regarding this phenotype. At first, this may seem in conflict with previous reports showing that Mdr1 mRNAs are expressed in stem cell populations (10–14), and that the Mdr1 gene products can efflux Hoechst dye (15). This potential discrepancy could be explained if the level of Mdr1 gene expression in HSCs were insufficient to efflux Hoechst dye, but still sufficient for Rhodamine efflux. In support of this possibility, we have shown that the MDR1-encoded transporter has a much lower affinity for Hoechst dye than the ABCG2 transporter. In fibroblast cell lines engineered to express either MDR1 or ABCG2 using the same vector and promoter, Hoechst efflux activity was significantly lower with MDR1 than with ABCG2, despite high levels of Rhodamine efflux activity seen with the MDR1 line (see Fig. 8, which is published as supporting information on the PNAS web site, www.pnas.org). Similarly, enforced expression of a MDR1 retroviral vector in murine bone marrow cells in vitro only increased SP cells to 3.6% of the total population (15), whereas an equivalent experiment with the ABCG2 vector gave 62.5% SP cells (10). Although there is clearly no redundant Hoechst efflux function in HSCs from Bcrp1−/− mice, our current study does not rule out redundancy in other possible transporter related functions. For instance, it is still possible that both Mdr1a/1b and Bcrp1 could modulate a common potential substrate that could be required for baseline hematopoiesis.
The conserved expression of Bcrp1 in stem cells from various sources does in fact suggest a necessary function in stem cell biology. A functional effect was also suggested by the developmental block seen when Bcrp1 expression was enforced in hematopoietic cells in transplanted mice (10). Although we thought a developmental defect might be detected after Bcrp1 deletion, we in fact found no defects in steady state hematopoiesis. This finding suggests that the defect seen in the overexpression studies resulted from a deleterious gain of function, presumably in maturing cells where endogenous Bcrp1 is not normally expressed.
Given the lack of a defect in steady state hematopoiesis, the question still remains why Bcrp1 expression is widely present in a variety of stem cells, and is sharply down-regulated with hematopoietic maturation (10). One possibility is that Bcrp1 expression in stem cells could be required to respond to specific challenges or hematopoietic stress. We hypothesized that Bcrp1 expression could protect stem cells from genetic damage because of naturally occurring xenobiotics that are substrates for this transporter, and chose mitoxantrone to test this hypothesis. Our results clearly demonstrated that mitoxantrone selectively killed Bcrp1−/− hematopoietic cells at a dose that did not affect wild-type hematopoietic cells. Given the fact that many of the Bcrp1 substrates are derived from naturally occurring genotoxic xenobiotics, this result suggests that a physiological function of Bcrp1 in stem cells could be to provide protection from naturally occurring toxic substrates. This would seem particularly important for hematopoietic stem cells, given their potential lifelong residence in the bone marrow, and their tremendous proliferative potential over this time span.
Supplementary Material
Acknowledgments
We thank Amy McEwen, John Cunningham, and Transgenic core unit for help with generation of Bcrp1−/− mice; Philippe Bois for help with muscle SP cell analysis; Ann Marie Hamilton-Easton and Richard Ashmun for flow cytometry assay; Samita Andreancky for help with Me NK analyses; and Taihe Lu for help with genotyping of mice. This work was supported by National Institutes of Health Grants R01 HL67366 (to B.P.S.) and R01 GM60904 (to J.D.S.), and by the American Lebanese Syrian Associated Charities.
Abbreviations
SP, side population
HSC, hematopoietic stem cells
ES, embryonic stem
ABC, ATP binding cassette
Hoechst, Hoechst dye 33342
K+S+L−, c-Kit+Sca-1+Lineage−
This paper was submitted directly (Track II) to the PNAS office.
References
- 1.Spangrude G. J. & Johnson, G. R. (1990) Proc. Natl. Acad. Sci. USA 87, 7433-7437. [DOI] [PMC free article] [PubMed] [Google Scholar]
- 2.Wolf N. S., Kone, A., Priestley, G. V. & Bartelmez, S. H. (1993) Exp. Hematol. 21, 614-622. [PubMed] [Google Scholar]
- 3.Goodell M. A., Brose, K., Paradis, G., Conner, A. S. & Mulligan, R. C. (1996) J. Exp. Med. 183, 1797-1806. [DOI] [PMC free article] [PubMed] [Google Scholar]
- 4.Goodell M. A., Rosenzweig, M., Kim, H., Marks, D. F., DeMaria, M., Paradis, G., Grupp, S. A., Sieff, C. A., Mulligan, R. C. & Johnson, R. P. (1997) Nat. Med. 3, 1337-1345. [DOI] [PubMed] [Google Scholar]
- 5.Storms R. W., Goodell, M. A., Fisher, A., Mulligan, R. C. & Smith, C. (2000) Blood 96, 2125-2133. [PubMed] [Google Scholar]
- 6.Uchida N., Fujisaki, T., Eaves, A. C. & Eaves, C. J. (2001) J. Clin. Invest. 108, 1071-1077. [DOI] [PMC free article] [PubMed] [Google Scholar]
- 7.Gussoni E., Soneoka, Y., Strickland, C. D., Buzney, E. A., Khan, M. K., Flint, A. F., Kunkel, L. M. & Mulligan, R. C. (1999) Nature (London) 401, 390-394. [DOI] [PubMed] [Google Scholar]
- 8.Jackson K. A., Mi, T. & Goodell, M. A. (1999) Proc. Natl. Acad. Sci. USA 96, 14482-14486. [DOI] [PMC free article] [PubMed] [Google Scholar]
- 9.Hulspas R. & Quesenberry, P. J. (2000) Cytometry 40, 245-250. [PubMed] [Google Scholar]
- 10.Zhou S., Schuetz, J. D., Bunting, K. D., Colapietro, A. M., Sampath, J., Morris, J. J., Lagutina, I., Grosveld, G. C., Osawa, M., Nakauchi, H., et al. (2001) Nat. Med. 7, 1028-1034. [DOI] [PubMed] [Google Scholar]
- 11.Scharenberg C. W., Harkey, M. A. & Torok-Storb, B. (2002) Blood 99, 507-512. [DOI] [PubMed] [Google Scholar]
- 12.Kim M., Turnquist, H., Jackson, J., Sgagias, M., Yan, Y., Gong, M., Dean, M., Sharp, J. G. & Cowan, K. (2002) Clin. Cancer Res. 8, 22-28. [PubMed] [Google Scholar]
- 13.Chaudhary P. M. & Roninson, I. B. (1991) Cell 66, 85-94. [DOI] [PubMed] [Google Scholar]
- 14.Sorrentino B. P., McDonagh, K. T., Woods, D. & Orlic, D. (1995) Blood 86, 491-501. [PubMed] [Google Scholar]
- 15.Bunting K. D., Zhou, S., Lu, T. & Sorrentino, B. P. (2000) Blood 96, 902-909. [PubMed] [Google Scholar]
- 16.Bunting K. D., Galipeau, J., Topham, D., Benaim, E. & Sorrentino, B. P. (1998) Blood 92, 2269-2279. [PubMed] [Google Scholar]
- 17.Schinkel A. H, Mayer, U., Wagenaar, E., Mol, C. A., van Deemter, L., Smit, J. J., van der Valk, M. A., Voordouw, A. C., Spits, H., van Tellingen, O., et al. (1997) Proc. Natl. Acad. Sci. USA 94, 4028-4033. [DOI] [PMC free article] [PubMed] [Google Scholar]
- 18.Muller M., Bakos, E., Welker, E., Varadi, A., Germann, U. A., Gottesman, M. M., Morse, B. S., Roninson, I. B. & Sarkadi, B. (1996) J. Biol. Chem. 271, 1877-1883. [DOI] [PubMed] [Google Scholar]
- 19.Osawa M., Nakamura, K., Nishi, N., Takahasi, N., Tokuomoto, Y., Inoue, H. & Nakauchi, H. (1996) J. Immunol. 156, 3207-3214. [PubMed] [Google Scholar]
- 20.Brangi M., Litman, T., Ciotti, M., Nishiyama, K., Kohlhagen, G., Takimoto, C., Robey, R., Pommier, Y., Fojo, T. & Bates, S. E. (1999) Cancer Res. 59, 5938-5946. [PubMed] [Google Scholar]
- 21.Jonker J. W., Smit, J. W., Brinkhuis, R. F., Maliepaard, M., Beijnen, J. H., Schellens, J. H. & Schinkel, A. H. (2000) J. Natl. Cancer Inst. 92, 1651-1656. [DOI] [PubMed] [Google Scholar]
Associated Data
This section collects any data citations, data availability statements, or supplementary materials included in this article.


