

Abstract
Objective: The authors' goal was to determine whether dynamic categorization, a new technique for organizing search results, is more useful than the two existing organizational techniques: relevance ranking and clustering. They define a useful tool as one that helps users learn about the kinds of information that pertain to their query, find answers to their questions efficiently and easily, and feel satisfied with their search experience.
Design: Fifteen patients with breast cancer and their family members completed query-related tasks using all three tools. The authors measured the time it took the subjects to accomplish their tasks, the number of answers to the query that the subjects found in four minutes, and the number of new answers that they could recall at the end of the study. Subjects also completed a user-satisfaction questionnaire.
Results: The results showed that patients with breast cancer and their family members could find significantly (P < 0.05) more answers in a fixed amount of time and were significantly (P < 0.05) more satisfied with their search experience when they used the dynamic categorization tool than when they used either the cluster tool or the ranking tool. Subjects indicated that the dynamic categorization tool provided an organization of search results that was more clear, easy to use, accurate, precise, and helpful than those of the other tools.
Conclusion: The experiments indicate that dynamic categorization is an effective and useful approach for organizing search results. Tools that use this technique will help patients and their families gain quick and easy access to important medical information.
Vast quantities of medical information are now available. medline alone contains more than 9.2 million bibliographic entries from more than 3,800 biomedical journals, and it adds more than 31,000 new entries each month.1 This volume of available information has created a problem of information overload. People become frustrated and overwhelmed when their searches yield tens or hundreds of relevant documents, so they abandon their search before they understand the kinds of information that it has returned.
We developed a new approach, called dynamic categorization, and created a corresponding system called DynaCat that attempts to solve this problem by organizing the documents returned from a bibliographic search into meaningful groups that correspond to the query.2–4 In this paper, we focus on our experiment to determine how useful the approach is in helping users understand and explore their search results. Specifically, we tested the claim that search results organized by dynamic categorization will be more useful to those who have general questions than are search results organized by the two other approaches: relevance ranking and clustering. We define a useful system as one that helps users:
Learn about the kinds of information that pertain to their query
Find answers to their question efficiently and easily
Feel satisfied with their search experience
For this evaluation, satisfaction includes the users' perception of many attributes, such as the clarity of the organization of search results, the ease of tool use, the usefulness of the organization, and the accuracy of the organization. The complete satisfaction questionnaire appears in the Appendix.
Comparison Systems
In this evaluation, we compared DynaCat with two other systems that organize search results. Each subject used all three organizational tools: 1) a tool that ranks the search results according to relevance criteria (ranking tool), 2) a tool that clusters the search results (cluster tool), and 3) DynaCat (category tool). Although the purpose of all three tools is to help searchers find their requested information, the approach of each tool differs (Table 1▶). We briefly describe each tool and the differences among them in the following sections.
Table 1 .
Comparison of Characteristics of the Tools for Organizing Search Results
| Ranking Tools | Clustering Tools | DynaCat | |
|---|---|---|---|
| Orders search results | Yes | No | No |
| Creates groups of search results | No | Yes | Yes |
| Uses domain knowledge | No | No | Yes |
| Uses information about user's query | Yes | No | Yes |
Relevance-ranking Tool
Relevance-ranking systems create an ordered list of search results in which the order of the documents is based on a measure of similarity between the document and the query. The documents that are most similar to the query are assumed to be the most relevant to the user.5–7 These techniques typically represent documents using the vector-space paradigm, where each document in the collection is represented by a vector.8,9 The length of a vector is the number of unique words in the entire set of documents, and the value of each element in a document's vector is calculated on the basis of both how frequently the corresponding word occurs in the document and how many other documents contain that word. Each document's vector acts as the coordinates for that document in a multidimensional space. This paradigm provides a way of viewing documents as positions in space, where the similarity between a document and a query is the distance between their vectors, measured by taking the cosine of the angle between those vectors.
Researchers have studied the effectiveness of many different algorithms for weighting the words in the vector and ranking the results, but no one algorithm appears to be superior in all cases.10,11 Thus, the recommendations from these studies depend on the characteristics of the domain and the type of search. The relevance-ranking tool for this evaluation used a standard algorithm recommended by Salton and Buckley10 for this situation, where the queries are short and the vocabulary is technical. We created an interface to the relevance-ranking tool that presents the results as a hypertext file, with an interface that is similar to that of DynaCat (see Figure 1▶).
Figure 1.
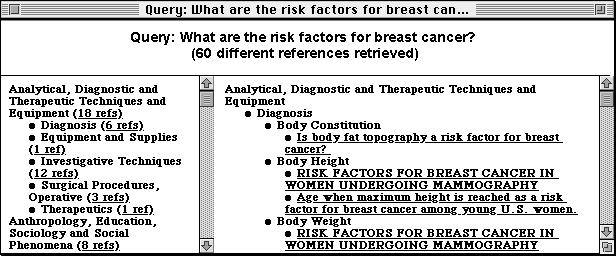
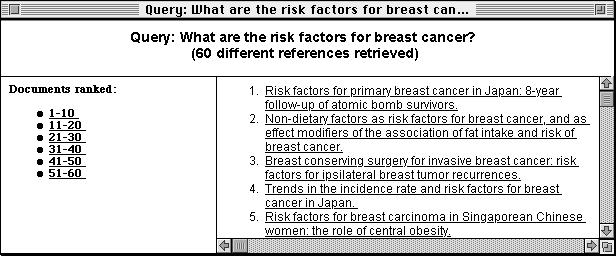
The interfaces to DynaCat (top), the cluster tool (middle), and the ranking tool (bottom). All interfaces are divided into three frames, or window panes. The top window pane displays the user's query and the number of documents found. The left pane provides a table of contents view of the organization of search results. The right pane displays all the document titles using the organization of the scheme of the tool.
Cluster Tool
Document-clustering systems also use a vector-space representation of the documents, but instead of ranking the documents, they group similar documents and label each group (or cluster) with representative words from that group. Like ranking algorithms, clustering systems estimate the similarity between documents by using a measure of the distance between the documents' vectors. A variety of statistical techniques have been used to create document clusters,12–14 but none has proved superior in all situations.
For our experiments, we used the SONIA document-clustering tool, which was developed as part of Stanford University's Digital Library Project.15,16 SONIA uses a two-step approach to clustering documents: it uses group-average hierarchic agglomerative clustering (a bottom-up approach) to form the initial set of clusters, then refines the clusters by an iterative method. We provided the search results for each query as a set of hypertext documents, and SONIA provided a set of documents indicating the number of clusters created, the words that described each cluster, and the set of documents that SONIA assigned to each cluster. We used the default settings for SONIA and had it find the maximum number of clusters. We wrote an interface to read its files and to present the results in an interface that is similar to that of DynaCat (see Figure 1▶).
Category Tool (DynaCat)
Unlike the other two statistical approaches, DynaCat uses a knowledge-based approach to organize the search results.2,3 Like the clustering systems, it organizes the search results into groups of documents. It dynamically selects pertinent categories, assigns the appropriate documents to each category, and generates a hierarchic organization of those categories. This approach is based on three key premises:
An appropriate categorization depends on both the user's query and the documents returned from the query.
The type of query can provide valuable information about both the expected types of categories and the criteria for assigning documents to those categories.
Taxonomic knowledge about words or word phrases in the document can make useful and accurate categorization possible.
As opposed to relevance-ranking tools, the purpose of DynaCat is not to separate nonrelevant from relevant documents but rather to organize the user's search results so that the organization provides information 1) about what kinds of information are represented in (or are absent from) the search results, by creating document categories with meaningful labels and by hierarchically organizing the document categories; 2) about how the documents relate to the query, by making the categorization dependent on the type of query; and 3) about how the documents relate to one another, by grouping ones that cover the same topic into the same category. This approach can provide such capabilities because it is based on a representation of the documents that is semantically richer than the vector-space representation, which is used by most clustering and relevance-ranking systems.
The semantics in dynamic categorization stem from two types of models: 1) a small query model that contains knowledge about what types of queries users make, and how search results from those queries should be categorized; and 2) a large domain-specific terminology model that connects individual terms (e.g., single words, abbreviations, acronyms, or multiword phrases) to their corresponding general concept or semantic type (e.g., aspirin's semantic type is pharmacologic substance). For a medical terminology model, DynaCat uses the Metathesaurus of the Unified Medical Language System (UMLS), which provides semantic information on more than 500,000 biomedical terms.
We based the query model on an analysis of frequently asked questions from patients in a breast cancer clinic. The query model maps between the types of queries a user may enter and the criteria for generating categories that correspond to the user's query. Query types are high-level representations of the user queries that are independent of disease-specific terms; therefore, many queries have the same query type. For example, the queries “What are the complications of a mastectomy for breast cancer?” and “What are the side effects of taking the drug Seldane to treat allergies?” both have the same query type: treatment—adverse effects—even though they mention different diseases and different treatments. The types of queries represent the intersection of the kinds of medical information that are available in the medical literature and the kinds of questions that users typically ask. Each query type is mapped to the categorization criteria, which specify the conditions that must be satisfied for a document to belong to that type of category.
DynaCat also takes advantage of the keywords or Medical Subject Headings (MeSH) terms that have been assigned to medical journal articles. Because many keywords of a document do not correspond to the user's query, DynaCat must prune the nonrelevant keywords from the list of potential categories. When a keyword satisfies all the categorization criteria, the categorizer component adds the document to the category labeled with that keyword.
As an example, consider a woman who has breast cancer. She is contemplating having a mastectomy and is worried about possible complications. She issues the query “What are the possible adverse effects of a mastectomy?” to DynaCat and specifies her query type as treatment—problems. One of the categorization criteria for that query type stipulates that the categories must be keywords specifying a disease or syndrome. If DynaCat finds a document titled “Chronic post-treatment symptoms in patients with breast cancer operated in different surgical units” with keywords such as lymphedema,paresthesia, adult, female, risk factors, mastectomy, surgery department, and treatment outcome, the system categorizes that document under lymphedema and paresthesia because they match the categorization criteria of having disease or syndrome as a semantic type. DynaCat does not categorize the document under the other keywords, because those terms do not match the categorization criteria.
Notice that lymphedema and paresthesia were not predefined category labels in the query model; rather, they were selected dynamically because they satisfied the categorization criteria in the query model. The resulting categorization hierarchy allows the patient with breast cancer to see immediately that both lymphedema and paresthesia are adverse effects discussed in her search results and allows her to explore other documents that discuss those adverse effects.
The tested version of DynaCat was implemented in Common LISP and used the Oncology Knowledge Authority to search the CancerLit database and to access the UMLS Metathesaurus.17 The current JAVA version uses a local copy of the UMLS and accesses medline through PubMed. In this version, categorizing several thousand search results takes a few minutes.
Methods
For this evaluation, we used methods from the field of human–computer interaction, unlike most evaluations of information-retrieval systems, which use precision and recall measures exclusively. Although no other study is exactly like the one that we designed, we were inspired to use methods from other user-centered studies.18–20
Our intent was to measure the effect of the organization of the documents, rather than the effect of individual user interfaces. Thus, we created hypertext interfaces to these three tools and made them as similar as possible. Figure 1▶ shows examples of the interfaces that we used for each of the three tools.
Because the ranking tool only creates ranked lists, whereas our interface is based on groups, we broke the ranked search results into groups of ten, which is the common point for splitting a ranked list into separate pages. In the following sections, we describe the subjects of the study and the procedure that these subjects followed.
Subjects
The subjects for this study were 15 patients with breast cancer or their family members. We recruited these subjects via the Community Breast Health Project,21 the Stanford Health Library, and Stanford University's Oncology Day Care Center. Each subject signed a written consent form before participating. Participants knew that the purpose of the study was to investigate the usefulness of three search tools: a category tool (DynaCat), a cluster tool, and a ranking tool. However, they did not know that we had created one of the tools.
Procedures
Every subject used all three organizational tools: the category tool, the cluster tool, and the ranking tool. In each of the tool's interfaces, the subjects could access any document's abstract by clicking on that document's title. Each subject used the same three queries for the experiment. We randomized the query used with each tool and the order in which the subjects used the tools. Figure 2▶ illustrates the study design graphically.
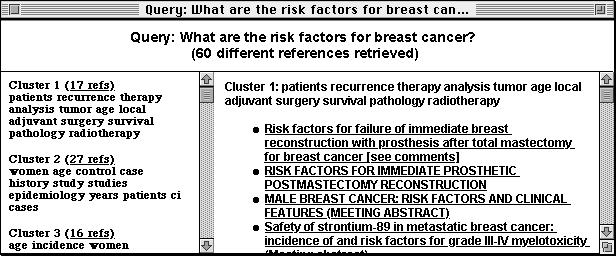
Figure 2.
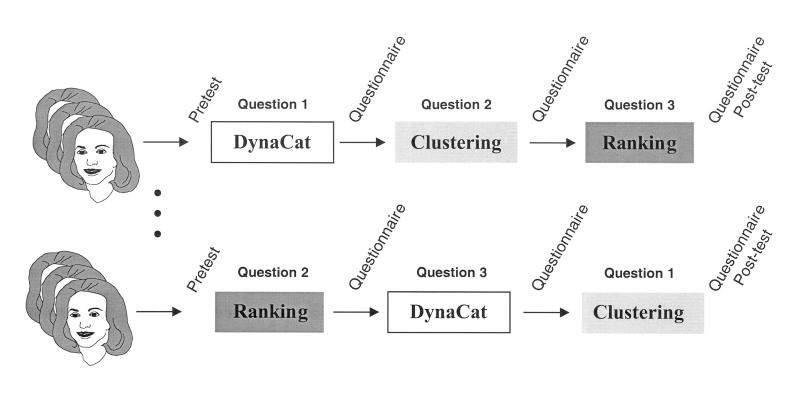
The study design. The 15 subjects were randomly assigned to groups in which the order of tool use and the question-to-tool pairing varied. Every subject used each tool once.
Each subject followed this procedure:
Filled out a human subjects consent form.
Filled out a background questionnaire.
- Answered the following questions on how much she or he knew about the subject of the queries:
- List all the treatments for breast cancer that you can think of.
- List all the ways to prevent breast cancer that you can think of.
- List all the factors that influence breast cancer prognosis that you can think of.
Read and followed the tutorial for each of the three tools for the query “What are the risk factors for breast cancer?” (Notice that only the tutorial used this query.)
Given a tool and a query, completed three timed tasks to find specific information.
Found as many answers to the original query as possible in four minutes.
Found a document that answers a specific question related to the original query, and recorded the time it took to find the answer.
Found a document that answers a different, specific question related to the original query, and recorded the time it took to find the answer.
Filled out the user-satisfaction questionnaire (see Appendix) for the tool that he or she just used.
Repeated steps 5 and 6 for the remaining two tools and queries.
Answered the original questions on how much she or he knew about the subject of the queries, not counting his or her original answers from step 3. (Subjects did know that there would be a post-test.)
- Answered the following questions:
- Which tool (ranking tool, cluster tool, or category tool) did you like best? Why?
- Which tool (ranking tool, cluster tool, or category tool) did you like least? Why?
- Did any of the tools help you learn more about the topic of the question? If so, which one?
The order of the tutorial exposure was the same as the order of tool use. Because each subject used each tool before starting the measured part of the study, we assumed that the order of tool use would not influence the results.
We generated the search results by querying the CancerLit database through the Oncology Knowledge Authority22 and limiting the results to documents that were written in English and that contained an abstract. We chose three general queries that represented the kinds of questions that patients typically ask, which were general enough to have multiple answers and thus would be appropriate for an information-exploration tool like DynaCat. The three queries that we used were “What are the prognostic indicators for breast cancer?” “What are the treatments for breast cancer?” and “What are the preventive measures for breast cancer?” We also provided the corresponding query types: problem—prognostic-indicators, problem—treatments, and problem—preventive-actions. We chose these three queries for the evaluation because the number of documents returned were similar (between 78 and 83 documents), and we did not want the number of documents returned to influence tool performance.
To create the specific questions for step 5, we asked an oncologist what he expected a patient to learn after reading documents returned from the different queries. In a pilot study, both of the timed questions came from him. However, for some of his questions, the subject could not determine which documents could answer the question by looking at the title of the documents, even when the abstract of the document contained the answer. In these cases, the subjects became extremely frustrated when they were using either the cluster tool or the ranking tool. They often gave up before they could find a document that was relevant to the question in their task. No subject experienced this difficulty using DynaCat, because the category labels indicated when a document discussed the topic related to the question.
Even though the results were better with our tool, we decided to use only questions that related to topics that were visible in some document's title for the final study. We made this decision because the subjects became upset when they could not find an answer and because we would have difficulty comparing the timed tasks if people gave up. In the final study, we chose one question from the oncologist and one from the list of frequently asked questions gathered from the Community Breast Health Project.21 For both questions, we chose the first question that was answered by one of the documents in the search results, that met the criterion of being visible in at least one document's title, and that had either a yes-or-no answer or a simple one-word answer.
We instructed the subjects to answer the timed questions as quickly as they could and promised them that they could use any of the tools after the study if they wanted to examine any articles in more detail or search for other information. We allowed the subjects to experiment with the tool again when they answered the user satisfaction questionnaire, but we cleared the screen before they answered the post-test questionnaire.
Results
In the next sections, we discuss the results of the timed tasks, the amount the subjects learned during the study, their satisfaction with the search process, their answers to the open-ended questions, and their comments.
Timed Tasks
All subjects completed two types of timed tasks. First, they found as many answers as possible to the general question (e.g., “What are the preventive actions for breast cancer?”) in four minutes. We counted all the answers that they found in the search results. The second type of task was to find answers to two specific questions (e.g., “Can diet be used in the prevention of breast cancer?”) that related to the original, general query. We combined the results of the second type of task into one mean value—the time to answer specific questions. Table 2▶ summarizes the results for the timed tasks.
Table 2 .
Results for the Timed Tasks
| Answers Found in 4 min | Time (min) to Find Answers to Specific Questions | |
|---|---|---|
| DynaCat (D) | 7.8 | 2.15 |
| Cluster Tool (C) | 4.53 | 2.95 |
| Ranking Tool (R) | 5.6 | 2.21 |
| P value: | ||
| D vs C | 0.013 | 0.274 |
| D vs R | 0.004 | 0.448 |
To determine whether there was a significant difference among the three tools, we first used a repeated-measures analysis of variance (ANOVA). Using the repeated-measures ANOVA, we found a significant difference (P = 0.035) among the tools for the number of answers that the subjects found in four minutes. Because we were interested only in whether DynaCat performed better than the cluster tool or better than the ranking tool, we also used a paired, one-tailed t test to determine the level of significance in comparing DynaCat with the cluster tool and in comparing DynaCat with the ranking tool. When the subjects used DynaCat, the category tool, they found nearly twice as many answers as they did with the other two tools. This difference was significant when we used the paired t test as well. Notice that, although the mean number of answers found with the ranking tool was greater than that found with the cluster tool, the P value was lower in the comparison of DynaCat with the ranking tool than it was in the comparison of DynaCat with the cluster tool. This result occurred because the subjects consistently found fewer answers with the ranking tool than they did with DynaCat, whereas their results with the cluster tool were variable.
There was no significant difference across the tools for the time it took the subjects to find answers to specific questions. As in the pilot study, the time it took subjects to find documents that answered the specific questions varied greatly. In this final study, we noticed two sources of this variability. The first source was the position of a document containing an answer to the question in the relevance-ranked list. For one question, it was obvious from the title of the first document in the relevance-ranked list that it answered the question, so the time that a subject took to answer that question was very short if she used the ranking tool. Second, we observed that several subjects answered the question on the basis of only the title of the document, whereas most other subjects read the entire abstract before answering the question. Reading the abstract took much longer than simply reading the title, particularly because the terminology in the abstracts was technical and sometimes completely unfamiliar to the subjects. Thus, the time to read the abstract, rather than the time to find a document among the search results, most heavily influenced the time to find an answer.
Amount Learned
To determine the amount that subjects learned during the study, we gave each subject a pretest and a post-test of their knowledge related to the three breast-cancer questions (see steps 3 and 8 in the Procedures section). We measured the number of new answers on the post-test. The mean number of answers learned for DynaCat (2.80) was greater than those for the cluster tool (2.20) and for the ranking tool (2.33); however, this difference was not statistically significant. The largest influence on this measurement was the order in which the subjects looked for answers to the question. Subjects remembered fewer answers to their first question (1.93) than they did answers to their second (2.80) and third (2.60) questions. Using a paired, one-tailed t test, we found the difference between the times of the first and second questions to be significant (P = 0.04). However, the difference between the second and third questions was not significant (P = 0.36), possibly because the subjects could still remember answers to their second question, about 30 minutes in the past, but had more difficulty remembering answers to their first question, nearly an hour in the past. The tool used may have had an influence on the amount learned, but the number of answers that the subjects remembered for the post-test was correlated more strongly with how recently the subjects found answers to that question rather than with which tool they used.
User Satisfaction
To measure user satisfaction, we used both a validated satisfaction questionnaire23 and a questionnaire that we created to measure other important types of satisfaction for this type of tool. The Appendix shows the combined questionnaire that we used. Subjects filled out the questionnaire for each of the three tools.
Questions 1 through 10 were from the validated questionnaire, although we modified questions 3, 5, and 10 slightly to match each tool more closely. Figure 3▶ shows the results from the validated questionnaire.
Figure 3.
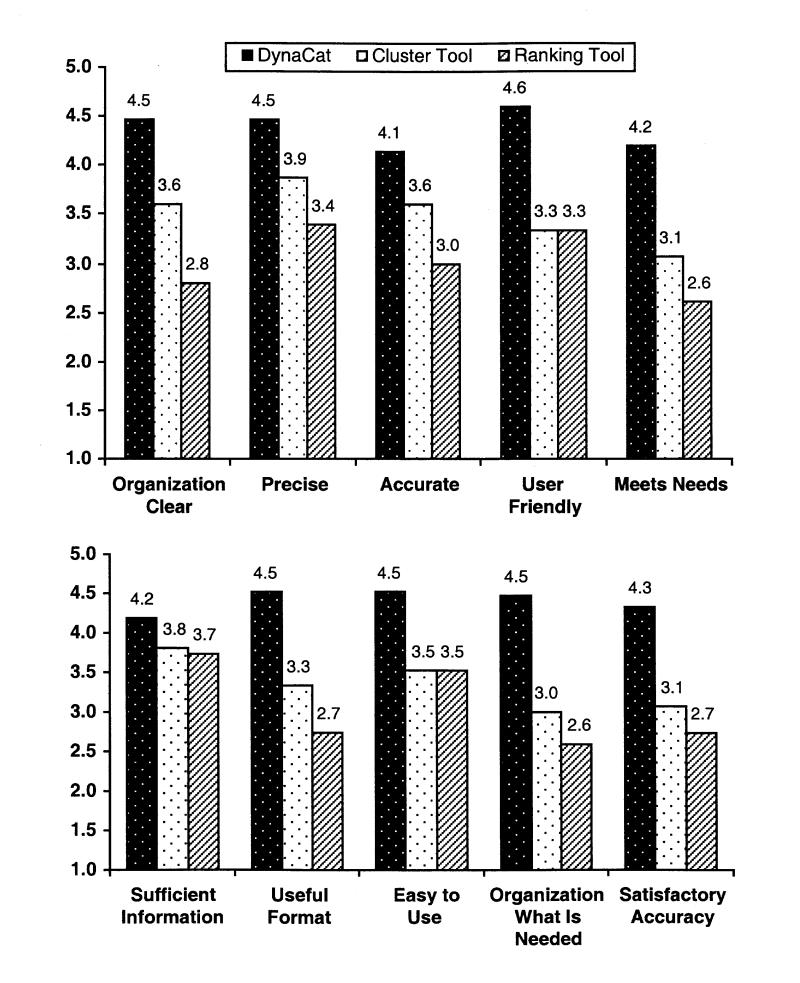
Results from the validated user-satisfaction questionnaire. The mean values across all 15 subjects are shown on the y axis. The x axis shows a brief summary of the questions asked. (See the Appendix for the full questionnaire.) Subjects answered the questions using a scale from 1 to 5, where 1 meant “almost never” and 5 meant “almost always” (the ideal answer). The difference between DynaCat and the cluster tool was statistically significant (P < 0.05) for all five questions, as was that between DynaCat and the ranking tool, with the exception of question 6, about sufficient information, which had a P value of 0.11.
The subjects answered the questions using a scale from 1 to 5, where 5 was the most positive answer. The subjects' answers for DynaCat were significantly higher (P < 0.05) than those for either the ranking tool or the cluster tool, indicating that the subjects were more satisfied with DynaCat than they were with either the ranking tool or the cluster tool.
We created the remaining 16 questions on the questionnaire. For the first four questions, we provided statements and asked the subjects to rate them on a scale of 1 to 5, where 1 meant “strongly disagree” and 5 meant “strongly agree.” Five was the ideal answer for three of those questions. The results are shown in Figure 4▶.
Figure 4.
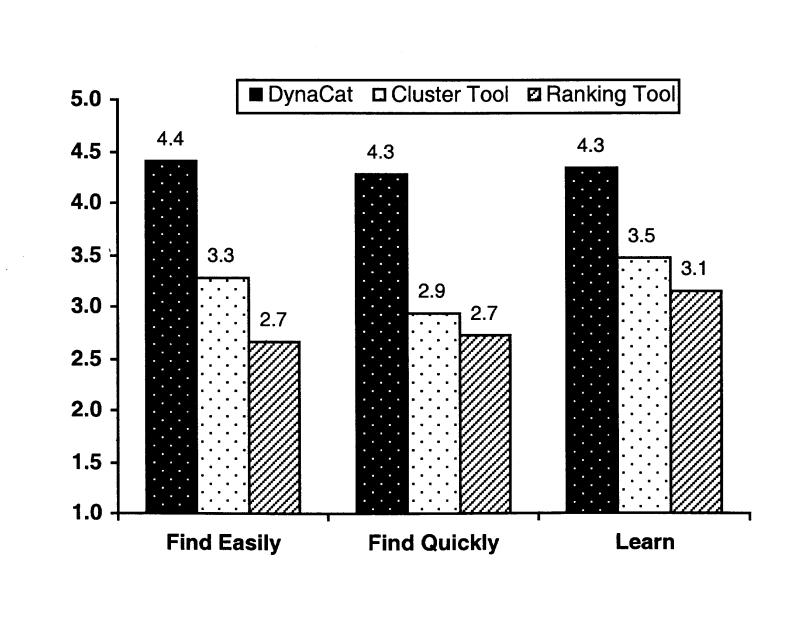
Results from the user-satisfaction questionnaire. The mean values across all 15 subjects are shown on the y axis. The x axis shows a brief summary of the questions asked (questions 11, 12, and 14; see the Appendix for the full questionnaire.) Subjects rated the statements on a scale from 1 to 5, where 1 meant “strongly disagree” and 5 meant “strongly agree” (the ideal answer). The difference between DynaCat and the cluster tool was statistically significant (P < 0.01), as was the difference between DynaCat and the ranking tool.
For these questions, DynaCat also scored significantly higher than either the ranking tool or the cluster tool, indicating that the subjects found DynaCat better at helping them find information quickly, find information easily, and learn about the topic corresponding to their query. Question 13 (“The amount of information provided in the search results was overwhelming”) had an ideal answer of 1 (strongly disagree). For this question, the mean value that subjects assigned to DynaCat (2.40) was lower than the mean values for the cluster tool (2.53) and the ranking tool (2.67), but the difference was not significant. The wording of this question, unlike that of all the other questions, does not refer to the system or to the organization of results; it refers to only the search results themselves. Thus, the subjects might have been answering the question on the basis of how overwhelming the contents of documents were rather than how overwhelming the organization of those documents were.
The other 12 questions were either yes-or-no questions or open-ended questions. The results for the yes-or-no questions are shown in Figure 5▶. For these questions, DynaCat also scored significantly higher than either the ranking tool or the cluster tool. Every subject agreed that the organization of documents by DynaCat made sense, was useful, provided clear labels, and helped them perform their tasks. For the cluster tool and the ranking tool, only two thirds of the subjects or fewer answered those questions positively. Only one subject said that she found the category tool frustrating to use, and one other subject found it somewhat frustrating. Nine subjects found the cluster tool frustrating, and eight found the ranking tool frustrating. All 15 subjects said that they would use the category tool again when they wanted to search the medical literature, whereas only 10 subjects said they would use the cluster tool again, and only 9 said they would use the ranking tool again.
Figure 5.
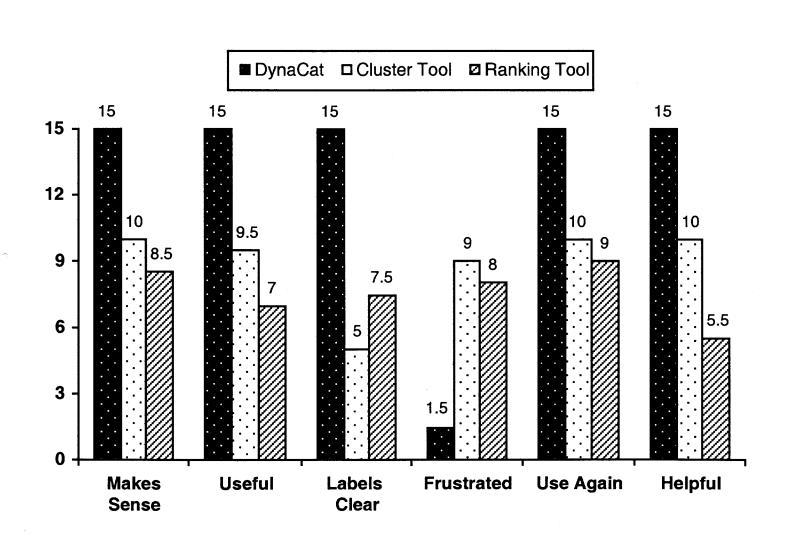
“Yes” responses to the yes-or-no user-satisfaction questions. The labels along the x axis summarize questions 15, 17, 19, 22, 24, and 26. (See the Appendix for the full questionnaire.) Some subjects answered “somewhat” instead of “yes” or “no.” Such answers were counted as half a “yes” response.
After the subjects finished using all the tools, we asked three more user-satisfaction questions:
Which tool (ranking tool, cluster tool, or category tool) did you like best? Why?
Which tool (ranking tool, cluster tool, or category tool) did you like least? Why?
Did any of the tools help you learn more about the topic of the question? If so, which one?
The results for the final three questions appear in Figures 6 and 7▶▶.
Figure 6.
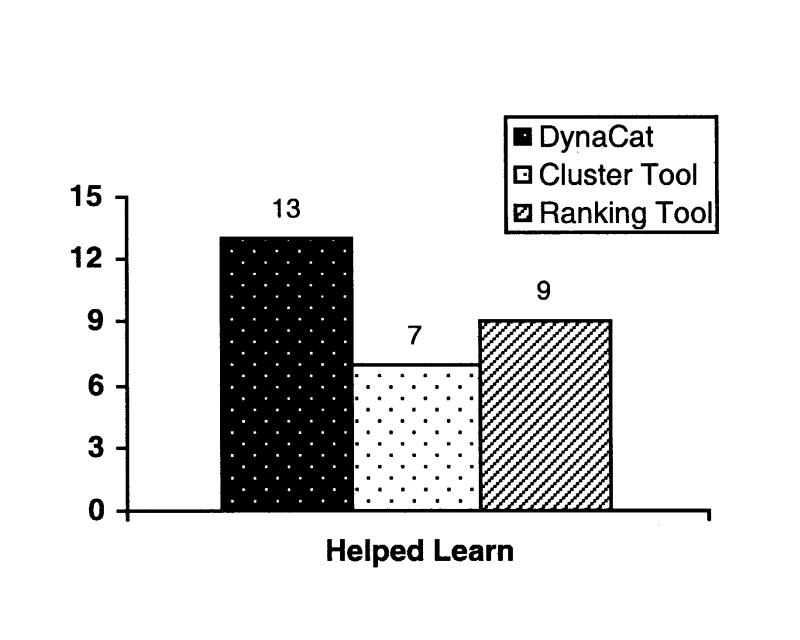
Responses to the final question, “Did any of the tools help you learn more about the topic of the question? If so, which one?”
Figure 7.
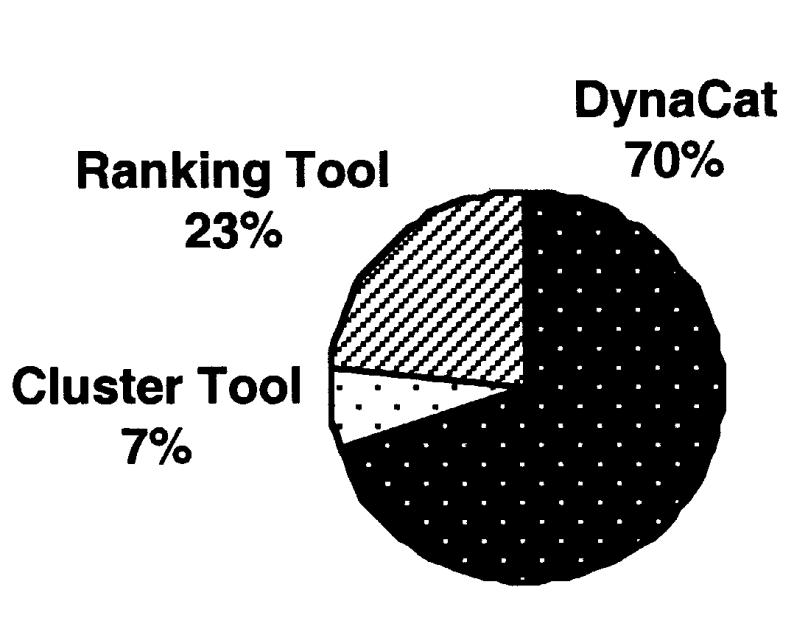
Responses to the question “Which tool did you like best?” One person could not choose between the ranking tool and DynaCat, so we counted her answer as half a vote for DynaCat and half a vote for the ranking tool.
Most subjects (87 percent) thought DynaCat helped them learn about the answers to the question, whereas only 60 percent thought the ranking tool helped, and only 46 percent thought the clustering tool helped. Most people (70 percent) chose DynaCat as the best tool, and no one chose DynaCat as the tool that she liked the least. Most subjects expressed a strong opinion about the ranking tool: 23 percent thought it was the best tool, and 67 percent thought it was the worst. In contrast, most subjects seemed indifferent to the cluster tool.
Comments and Answers to Open-ended Questions
We asked several open-ended questions as part of the user-satisfaction questionnaire. It would be difficult to create a quantitative report of these results, but we have included several representative positive and negative quotes from the subjects in Tables 3, 4, and 5▶▶▶.
Table 3 .
Subjects' Comments on DynaCat
| Positive | Negative |
|---|---|
| Clear and logical category names | Terminology too technical |
| Liked hierarchy of categories | Want further classification of large categories |
| Liked alphabetic organization of categories | Did not like “Other” category |
| Easy to read and find specific information | |
| Articles grouped into manageable numbers |
Table 4 .
Subjects' Comments on the Cluster Tool
| Positive | Negative |
|---|---|
| Better than no organization | Labels not clear |
| Easy to skim | Labels don't match articles in cluster |
| Not apparent how to find specific information | |
| Not intuitive |
Table 5 .
Subjects' Comments on the Ranking Tool
| Positive | Negative |
|---|---|
| Easy to understand the organization and browse | Don't know how the ranking was done |
| Easy to look at more important information first | Seemingly random order |
| Logical | No help in looking for specific information |
| Waste of time to read every title to find topics | |
| It can't know what we think are the most important documents |
When the evaluation was over, three subjects asked whether they could look at more information using one of the tools. All three subjects asked to use the category tool (DynaCat).
Discussion
This evaluation provided insights into the strengths and weaknesses of each approach to organizing search results.
Subjects liked the idea of grouping the search results into clusters, but they had many problems with the cluster tool. Subjects indicated that the similarities found by clustering did not always correspond to a grouping that was meaningful to them. They rated the clarity of the cluster labels and the labels' correspondence to the search results as poor. The clustering tools face this limitation because they use only information based on word occurrences. The document groups are labeled by words extracted from the clusters, usually chosen by an information-theoretic measure. Such lists of words may be understandable if the contents of the cluster are cohesive, but a list of words is not as inviting to the general user as a well-selected category label. The results also are unlikely to correspond well to the user's query, because clustering algorithms do not use information about the user's query in forming the clusters.
When subjects assessed the ranking tool, some liked the concept of ordering the documents according to their relevance and found the concept easy to understand. However, they also complained that they did not understand how the ranking was done, nor did they believe that any system would be able to rank the results according to their own personal needs. Another problem with an ordered list is that it does not give the user much information about the similarities or differences in the contents of the documents. For example, without examining every retrieved document and noting the contents of each, the user would not be able to determine that 30 different preventive measures were discussed in the retrieved documents or that 10 documents discussed the same preventive drug. People usually do not have the time or energy to browse all the documents on the list. They may give up examining the documents long before they see all the results, thus missing potentially useful information.
Although the data provide clear evidence that most users prefer the results that were generated by DynaCat, this system has limitations, too. Developing a tool on this knowledge-based approach requires effort to understand the terminology model and to create the query model, whereas the statistical approaches require no such models. The effectiveness of DynaCat also depends on the comprehensiveness and appropriateness of the models. For example, in this study of patients with breast cancer and members of their families, subjects complained about the technical nature of the category labels. If the terminology model incorporated consumer-oriented medical terms rather than the more physician-oriented Metathesaurus terms, DynaCat could choose category labels that matched the needs of targeted user populations. Also, the technique is applicable only if the user's query maps well to one of the query types in the query model.
The current system also provided no easy mechanism to help consumers critically assess the quality of retrieved documents. Yet such quality information could be helpful in the selection of peer-reviewed articles to read and would be very important in a search through unrefereed Web documents. Our future research plans include investigating ways to minimize these limitations. One possibility for reducing the modeling effort is to use machine learning techniques in the generation of the query types and categorization criteria. We are also exploring information visualization techniques for an interactive categorization environment that would allow users to categorize documents along multiple dimensions such as quality, in addition to the main topic.
In summary, we showed that DynaCat is a more useful organizational tool than either the cluster tool or the ranking tool. The results showed that DynaCat is significantly better than the other two tools along two dimensions: 1) users were able to find answers more efficiently and 2) users were more satisfied with the search process.
Measurements of the amount learned were inconclusive; however, many more subjects thought that DynaCat helped them learn about the topic of the query. The subjects indicated that DynaCat provided an organization of search results that was more clear, easy to use, accurate, precise, and helpful than the organization of results provided by the other tools. Because this study involved a small number of queries, more evaluation is needed to justify broader claims. Nevertheless, these initial results suggest that, by using knowledge about users' queries and the kinds of categories that are useful for those queries, DynaCat can help users find information quickly and easily.
Conclusion
The amount of medical literature continues to grow as the content becomes increasingly specialized. At the same time, many patients and their families are becoming proactive in searching the medical literature for information about their medical problems. Medical journal articles can be intimidating for lay people to read; thus, lay readers need tools to help them sift through and understand the information they seek. We have described a new approach to organizing medical search results and have proved that our approach is helpful; our research should lead to the development of tools that will help lay people—both patients and their families—explore the medical literature, become informed about health care topics, and play an active role in making decisions about their own medical care.
Although our system was evaluated with only patients as users, it could be useful for health care workers as well. They also need tools to help them cope with the vast quantities of medical information that they must access to care for their patients or to further medical research. The questions that health care workers ask might be more specific or more varied, but the terminology model and categorization process would remain the same. If tools based on our research were available to health care workers, they might be able to find the needed information quickly enough to use it during a patient visit, when that information is most useful. This research could result in new tools that would help all users (patients as well as health care workers) explore quickly and effectively the information space related to their individualized information needs.
Acknowledgments
The authors thank Marti Hearst, Edward Shortliffe, and Russ Altman for their feedback on this work. They also thank Mike Walker for helping with the statistics, Lexical Technology, Inc. for providing tools to access their Oncology Knowledge Authority through the Web, and Dr. Bob Carlson and the Community Breast Health Project for helping them recruit subjects.
APPENDIX
User Satisfaction Questionnaire
Using the scale below, please answer questions 1–10:
1 = Almost never
2 = Some of the time
3 = Almost half of the time
4 = Most of the time
5 = Almost always
Is the organization of the information clear?
Does the system provide the precise information you need?
Is the system accurate in assigning documents to categories?
Is the system user-friendly?
Does the organization of the information content meet your needs?
Does the system provide sufficient information?
Do you think the information is presented in a useful format?
Is the system easy to use?
Does the system provide an organization of the information that seems to be just about exactly what you need?
Are you satisfied with how well the system assigns documents to categories? [note: This wording is for the category tool. The exact wording of this question depended on the tool that the subjects were assessing. For the cluster tool, the word “clusters” was substituted for the word “categories,” and for the ranking tool, the question asked how well the system ranks the documents.]
Using the scale below, please answer questions 11–14:
1 = Strongly disagree
2 = Disagree
3 = Uncertain
4 = Agree
5 = Strongly agree
The organization of the search results makes it easy to find information.
The organization of the search results makes it easy to find information quickly.
The amount of information provided in the search results was overwhelming.
The organization of the search results made it easy to learn about information related to the query.
Please answer the remaining questions in your own words:
Does the organization of the documents make sense?
How do you think the organization could be improved?
Do you find the organization useful?
If so, in what way?
Do the labels that describe each group of documents make sense?
What do you like about the organization of the documents returned?
What do you not like about the organization of the documents returned?
Were you frustrated when you used the system?
If so, why?
Would you use the system again when you want to search for medical information?
Why or why not?
Did the grouping of the documents help you perform your tasks? [note: For the ranking tool, the word “ranking” was substituted for the word “grouping.”]
This work was supported by grant LM-07033 from the National Library of Medicine and contract N44-CO-61025 from the National Cancer Institute.
References
- 1.National Library of Medicine. NLM Online Databases and Databanks. 1999. Available at: http://www.nlm.nih.gov/pubs/factsheets/online_databases.html.
- 2.Pratt W. Dynamic Categorization: A Method for Decreasing Information Overload [PhD thesis]. Stanford, Calif: Stanford University Medical Information Sciences, 1999.
- 3.Pratt W, Hearst MA, Fagan LM. A knowledge-based approach to organizing retrieved documents. In: AAAI ‘99: Proceedings of the 16th National Conference on Artificial Intelligence; Orlando, Florida; 1999.
- 4.Pratt W. Dynamic organization of search results using the UMLS. AMIA Annu Fall Symp. 1997:480–4. [PMC free article] [PubMed]
- 5.van Rijsbergen CJ. Information Retrieval. London: Butterworths, 1979.
- 6.Salton G. Automatic Text Processing: The Transformation, Analysis, and Retrieval of Information by Computer. Reading, Mass: Addison-Wesley, 1989.
- 7.Harman D. Ranking algorithms. In: Frakes WB (ed). Information Retrieval Data Structures and Algorithms. Englewood Cliffs, NJ: Prentice Hall, 1992.
- 8.Salton G, Wong A, Yang CS. A vector space model for automatic indexing. Commun ACM. 1975;18:613–20. [Google Scholar]
- 9.Salton G, McGill MJ. Introduction to Modern Information Retrieval. New York: McGraw-Hill, 1983.
- 10.Salton G, Buckley C. Term-weighting approaches in automatic text retrieval. Inf Proc Manage. 1988;24(5):513–23. [Google Scholar]
- 11.Efthimiadis EN. A user-centred evaluation of ranking algorithms for interactive query expansion. In: SIGIR ‘93: Proceedings of the 16th Annual International ACM-SIGIR Conference on Research and Development in Information Retrieval. 1993:146–59.
- 12.Willett P. Recent trends in hierarchic document clustering: a critical review. Info Proc Manage. 1988;24(5):577–97. [Google Scholar]
- 13.Rasmussen E. Clustering algorithms. In: Frakes WB (ed). Information Retrieval Data Structures and Algorithms. Englewood Cliffs, NJ: Prentice Hall, 1992:419–42.
- 14.Hearst MA, Pedersen JO. Reexamining the cluster hypothesis: Scatter/Gather on retrieval results. In: SIGIR ‘96: Proceedings of the ACM Conference on Research and Development in Information Retrieval. 1996:76–84.
- 15.Sahami M. Using Machine Learning to Improve Information Access [PhD thesis]. Stanford, Calif: Stanford University Computer Science Department, 1998.
- 16.Sahami M, Yusufali S, Baldonado MQW. SONIA: A Service for Organizing Network Information Autonomously. Presented at: Digital Libraries 98: Third ACM Conference on Digital Libraries; Pittsburgh, Pa; Jun 24–27, 1998.
- 17.Tuttle MS, Sherertz DD, Olson NE, et al. Toward reusable software components at the point of care. AMIA Annu Fall Symp. 1996:150–4. [PMC free article] [PubMed]
- 18.Egan DE, Remde JR, Gomez LM, Landauer TK, Eberhardt J, Lochbaum CC. Formative design-evaluation of SuperBook. ACM Trans Inf Syst. 1989;7(1):30–57. [Google Scholar]
- 19.Pirolli P, Schank P, Hearst MA, Diehl C. Scatter/Gather Browsing Communicates the Topic Structure of a Very Large Text Collection. Presented at: CHI 96: ACM SIGCHI Conference on Human Factors in Computing Systems. 1996.
- 20.Hersh WR, Elliot DL, Hickam DH, Wolf SL, Molnar A, Leichtenstein C. Towards new measures of information retrieval evaluation. In: SIGIR ‘95: Proceedings of the 18th Annual International ACM-SIGIR Conference on Research and Development in Information Retrieval. 1995:164–70.
- 21.Community Breast Health Project home page. Stanford Medical Center. 1999. Available at: http://www-med.stanford.edu/CBHP/. Accessed Jun 23, 2000.
- 22.Tuttle MS, Sherertz DD, Fagan LM, et al. Toward an interim standard for patient-centered knowledge-access. Proc 17th Annu Symp Comput Appl Med Care. 1994:564–8. [PMC free article] [PubMed]
- 23.Doll W, Torkzadeh F. The measurement of end-user computing satisfaction. MIS Q. 1988;12:259–74. [Google Scholar]