

Abstract
Epifluorescence microscopy is used to determine phase diagrams for lipid monolayers containing binary mixtures of cholesterol or dihydrocholesterol and dimyristoylphosphatidylserine, as well as ternary mixtures that also contain ganglioside GM1. The phase diagrams are unusual in that they show multiple critical points: two upper miscibility critical points and one lower miscibility critical point. These critical points all are associated with the formation of condensed complexes between these lipids and cholesterol (or dihydrocholesterol). The miscibility critical pressures depend on subphase pH and ionic strength. Changes in critical pressures due to changes in subphase composition are closely related to changes in membrane electrostatic pressure and surface ionization.
Keywords: phospholipids, sphingomyelin, phase diagrams, condensed complexes, liquid immiscibility
Liquid–liquid immiscibility is commonly observed in familiar 3D liquid mixtures. Liquid–liquid immiscibility is also observed in many different mixtures of cholesterol and phospholipids in monolayer membranes at the air–water interface (1, 2). Some of these topologically 2D liquids have unique properties not found in 3D liquids. For example, binary mixtures of cholesterol with various phospholipids show two side-by-side upper miscibility critical points. This observation led to a thermodynamic model for the formation of condensed complexes of cholesterol and these phospholipids (3).
Lipid monolayers also differ from familiar 3D liquids in terms of electrostatic effects. In monolayers (but not bilayers) there is a long-range electrostatic repulsion between molecular dipoles that affects the sizes and shapes of lipid domains (2). In monolayers (and bilayers) there may also be charge–charge interaction between molecular ions in the monolayer and ions in the subphase.
In the present work we report that charged monolayers containing cholesterol or dihydrocholesterol (Dchol), dimyristoylphosphatidylserine (DMPS), and ganglioside GM1 (GM1), exhibit three miscibility critical points, all of which involve the formation of condensed complexes. It is also found that the electrostatic pressure arising from the ionization of the serine residue of liquid-phase DMPS yields changes in critical pressures consistent with a surface pKa of 2.7, the value reported in earlier work for the serine residue in dipalmitoylphosphatidylserine (DPPS) bilayers (4).
Experimental Procedures
DMPS and ovine brain GM1 were obtained from Avanti Polar Lipids; cholesterol and Dchol were obtained from Sigma; and Texas red dihexanoylphosphoethanolamine (TR-DHPE) was obtained from Molecular Probes. TR-DHPE is a phospholipid with a fluorescently labeled headgroup that partitions differentially between phases, thereby providing contrast. All lipids were used without further purification in experiments carried out at room temperature (23 ± 0.5°C). Lipid mixtures with 0.2 mol% TR-DHPE were spread from a 1 mg/ml chloroform solution on the air–water interface of a Teflon trough that had a movable barrier to change the surface pressure. Epifluorescence microscopy and methods described previously were used to observe solid–liquid or liquid–liquid phase coexistence (1, 3). Phase transition pressures are defined by the appearance or disappearance of two-phase coexistence as the surface pressure is changed, and pressure-composition phase diagrams are thus measured. Many of the experiments were carried out with Dchol instead of cholesterol to minimize artifacts due to air and photo-oxidation. We have previously found that using Dchol instead of cholesterol does not significantly change the phase behavior (5). Several controls were carried out with cholesterol in a chamber flooded with argon gas and with an argon-saturated subphase. The subphase usually contained distilled water at pH 5.4. We also studied the effect of varying the subphase ionic strength (with NaCl) and pH (using a citrate-phosphate saline buffer in the pH range of 2.6–6.6, and PBS in the pH range of 6.6–7.6). The surface pressure of monolayers is the difference between the surface tensions of water and that of the monolayer. The effect of the ionic strength of NaCl on the surface tension of the bare air–water interface was taken into account for pressure calibrations, so that pressures reported here are referenced to distilled water (6). Error bars shown in figures represent standard errors from at least three independent measurements.
Results
Phase Diagram for Binary Mixtures.
Fig. 1A shows the phase diagram for a binary mixture of DMPS and Dchol on a subphase of distilled water at pH 5.4. Note that there are several two-phase fields. A portion of this phase diagram including just the α and β two-phase fields has been reported (3). Phase diagrams with their characteristic side-by-side upper miscibility critical points have been observed for mixtures of cholesterol (or Dchol) with various saturated phospholipids (3, 7). What has not been reported previously is the liquid–solid phase field (δ) and the nearly horizontal line at higher pressures above which a new liquid–solid phase field (ɛ) appears. The δ two-phase field spans a wide composition range in the case of DMPS–Dchol mixtures. However, in mixtures of phospholipids such as DPPC with Dchol, the liquid–solid transition pressure is higher, rises sharply on addition of small amounts of cholesterol, and is completely abolished (not detectable up to 40 dyne/cm) at compositions higher than 5–10 mol% cholesterol (8).
Fig 1.

Phase diagrams and epifluorescence micrographs of monolayers of binary mixtures of DMPS and Dchol. (A) Experimental pressure-composition phase diagram showing liquid–liquid and solid–liquid immiscibility for a binary monolayer mixture of DMPS and Dchol on a subphase of distilled water at pH 5.4. Plotted data points represent the transition pressures that mark the disappearance or appearance of two-phase coexistence during monolayer compression or expansion. The gray curve is not a fit to theory. α and β denote liquid–liquid two-phase fields, whereas δ and ɛ refer to solid–liquid two-phase fields. Solid domains emerge from a homogeneous liquid background at the points marked by + (see D). At the points marked by x, the identity of the background liquid-phase changes (see E), upon crossing into a different solid–liquid coexistence region (ɛ). Liquid-phase transitions occur at points marked by circles. Spot checks carried out with cholesterol instead of Dchol are shown by squares. Stripe super-structure phases that represent proximity to a critical point (9) were observed at the transitions marked by filled circles (as shown in B) and squares, and not at those marked by open circles and squares. Standard errors for the transition pressures are 3–10% based on three independent measurements (not shown). (B) Monolayer in the α two-phase field composed of 25 mol% Dchol, 74.8 mol% DMPS, and 0.2 mol% TR-DHPE. The surface pressure is 1.4 dyne/cm. Under these conditions, one observes domain shape instability tending toward a stripe phase. (C) Monolayer in the β two-phase field composed of 50 mol% Dchol, 49.8 mol% DMPS, and 0.2 mol% TR-DHPE. The surface pressure is 7.4 dyne/cm. The domains are 1–3 μm in diameter. (D) Monolayer in the δ two-phase field composed of 12 mol% Dchol, 87.8 mol% DMPS, and 0.2 mol% TR-DHPE. The surface pressure is 6.8 dyne/cm. The black domains are irregularly shaped and solid as they do not exhibit thermal fluctuations characteristic of liquid domains (as in B and C). (E) Monolayer in the ɛ two-phase field composed of 12 mol% Dchol, 87.8 mol% DMPS, and 0.2 mol% TR-DHPE. The surface pressure is 11.1 dyne/cm. A new liquid phase forms on the perimeter of the black solid domains, grows, and eventually replaces the background gray liquid phase. B–E have the same scale (scale bar, 10 μm). (F) Calculated pressure-composition phase diagram for a reactive mixture of cholesterol and phospholipid. The δ–ɛ boundary approaches the x0 = 0 axis as the solubility of cholesterol in DMPS approaches zero. Phase boundaries are calculated both in the absence (dotted lines) and presence (solid lines) of double-layer electrostatics. Parameters used are listed in the text. The black dots represent miscibility critical points.
The domain morphologies in the various two-phase fields are distinct. The liquid domains in the α two-phase field are circular (5–10 μm in diameter) and exhibit thermal shape fluctuations, and when near a critical point, these domains form a stripe superstructure phase (9). This is seen in Fig. 1B. The liquid domains in the β two-phase field are typically very small (1–5 μm in diameter) as seen in Fig. 1C. As described, an electric field was subsequently used to fuse these domains, thereby making them easier to observe (3, 10). The fused domains (not shown) share the same features as the α domains (typical of liquids). The δ two-phase field consists of irregularly shaped black solid domains in a gray liquid background, as illustrated in Fig. 1D. The domain shapes do not exhibit thermal fluctuations and often have sharp edges. Fig. 1E shows a new liquid phase forming on the perimeter of the solid phase as the pressure is increased to pass across the horizontal line into the ɛ two-phase field. Fig. 1E clearly shows three phases (black solid and two brighter liquids). However, the bright white domains grow slowly, and given enough time (∼2 h), eventually engulf almost the entire gray background liquid, resulting in two-phase solid–liquid coexistence at equilibrium. These bright domains sometimes detach from their solid substrate. They then assume a circular shape and exhibit thermal fluctuations characteristic of liquids. All of the above transitions are reversible and are seen both during monolayer compression and expansion.
In previous work, the α and β liquid two-phase fields with the pair of upper miscibility critical points have been accounted for by a mean-field thermodynamic model involving the formation of condensed complexes (3, 5). Here, we extend this model to account for the additional details of the DMPS–Dchol phase diagram in Fig. 1A by (i) modifying the lipid–complex immiscibility to yield both upper and lower critical points, (ii) incorporating the freezing of the pure phospholipid to yield the solid–liquid coexistence regions (δ and ɛ), and (iii) including the effect of membrane charge and electrostatic pressure in the free energy.
Condensed Complexes and Chemical Potentials.
As described (3, 5), the assumed equilibrium reaction of complex formation between C (cholesterol or Dchol) and P (phospholipid or glycolipid) is
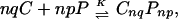 |
where CnqPnp represents the complex, q and p are relatively prime stoichiometry integers, and n is an oligomerization parameter reflecting the cooperativity of the reaction. The chemical potential of each component in the liquid state is a function of the applied pressure, π, and is given by
 |
 |
where μ is the chemical potential of pure k at zero applied pressure (π = 0) and zero membrane electrostatic pressure (πe = 0), kB is Boltzmann's constant, xk is the mole fraction of component k, Ak is the molecular area of k, aij is the interaction energy between i and j normalized with respect to kBTr (Tr = 296°K is a reference temperature), and δ
 = {1 for i = k; 0for i ≠ k}. The indices k = 1, 2, 3 refer to C, P, and CnqPnp, respectively. All symbols refer to liquid phases unless indicated otherwise. As described (3), two of the three pair-wise interaction parameters (aP–C and aC–CnqPnp) have a linear dependence on pressure, aij = 2 + a′ij(π − πe − πij), where πij + πe are the critical pressure parameters of the hypothetical nonreacting binary mixtures of i and j, and the a′ij have units of reciprocal surface pressure. The lipid–complex immiscibility parameter (aP–CnqPnp) is modified here to be a quadratic function of pressure to model the additional immiscibility at the higher pressures,
 |
where a′P–CnqPnp has units of (cm/dyne)2, π̄ + πe is the upper miscibility critical pressure, and π + πeis the lower miscibility critical pressure. The electrostatic pressure, πe, is calculated as outlined in the Appendix.
The chemical potentials can be incorporated in the expression for the free energy, G = N ∑k xkμk, where N is the equilibrium number of molecules in the sample. The standard chemical potential of the complex, μ , is related to the reactant standard chemical potentials through the reaction equilibrium constant, μ
 = nqμ
= nqμ + npμ
+ npμ − kBTln K0. The equilibrium constant varies with the surface pressure, K = K0 exp[−(π − πe)ΔA/kBT], where ΔA is the area change of reaction (Eq. 1), ΔA = ACnqPnp − nqAC − npAP. The compressibility of the phospholipid is included in the calculations, AP = A
 [1 − κ(π − πe)], where A
 is the area of P at zero pressure and κ is its compressibility. The condensed complex and cholesterol are considered to be relatively incompressible, and their compressibilities are neglected. K0 is the equilibrium constant of reaction (1) at the standard conditions of temperature and pressure defined above (or when π = πe). The mole fractions xi are determined by x0, the mole fraction of C in the sample before reaction, and the extent of reaction, ξ = NCnqPnp/N0, where N0 is the number of molecules present if no reaction occurs. The free energy can then be expressed as a function of three variables, G = G(x0, π − πe, ξ). The free energy is minimized with respect to ξ to obtain the composition and free energy at chemical equilibrium. A double tangent construction is used when applicable to determine the compositions of coexisting phases. The electrostatic pressure πe depends on membrane as well as subphase composition and is different in different phases. Calculations of electrostatic pressure, complex formation, and phase separation are iterated so as to be self-consistent. This procedure was used to generate the α, β, and γ two-phase fields, as illustrated for a CnP2n complex in Fig. 1F (n = 2) and see Fig. 4 (n = 1, 3). The α and γ two-phase fields are composed of a phospholipid-rich phase in equilibrium with a phase rich in condensed complex. The β two-phase field consists of a cholesterol-rich phase in equilibrium with a phase rich in condensed complex. The values of many parameters are fixed directly by the experimental data. The value for q/(p + q) is obtained from the location of the cusp in the phase diagrams, and πij + πe, π̄ + πe, and π + πe are close to the critical pressures of the respective two-phase miscibility peaks. The values for other parameters are chosen so as to produce calculated phase diagrams that mimic the experimental data as best as possible. Unless otherwise noted, parameters used are q = 1, p = 2, n = 2, K̄ = 10 (where K̄ = K1/np), AC = 40Å2, ACnqPnp = (q + p) 35 Å2, A
 = 70 Å2, T = Tr = 296°K, κ = 0.008 cm/dyne (11, 12), πP–C = 30 dyne/cm, πC–CnqPnp = 16 dyne/cm, π = 10 dyne/cm, π̄ = 2 dyne/cm, a′P–C = a′C–CnqPnp = −1/20 cm/dyne, and a′P–CnqPnp = −1/30 (cm/dyne)2. See the Appendix for electrostatic pressure parameters.
Fig 4.

Calculated pressure-composition phase diagrams for binary lipid mixtures. The parameters used are listed in the text except that π = 4 dyne/cm, and n = 1 for A and n = 3 for B. In C, n = 3, n0 = 0.15 mol/liter, and π is 15 dyne/cm. The black dots represent miscibility critical points.
Freezing Pressures.
The experimental freezing pressure elevation curve in Fig. 2 (filled circles) is the lower boundary of the δ two-phase field in Fig. 1A. Using the chemical potentials of Eq. 2, a freezing pressure elevation curve due to the addition of cholesterol is calculated for an ideal mixture
 |
Here πfr, πe,l and π , π
, π are the freezing pressures and electrostatic pressures in the presence or absence of cholesterol. Solid and liquid phases are referred to by s and l in the subscripts, respectively. Composition-dependent terms in this equation have been omitted for the solid phase, since it is assumed that cholesterol does not enter this phase. For the distilled water subphase, the electrostatic pressure contribution is small, of the order 0.5 dyne/cm. In the case of a reaction (Eq. 1), freezing pressure elevation curves calculated for K̄ = 10 and n = 1–5 are also given in Fig. 2. The experimental data are consistent with the condensed complex model for n = 2 (see Discussion). A relationship similar to Eq. 4 describes the change in freezing pressures due to variations of subphase pH and ionic strength (see calculations in Fig. 5 C and D).
Fig 2.

Freezing pressures of binary mixtures. Filled and open circles refer to mixtures of DMPS–Dchol and DMPS–GM1, respectively. All measurements were made on a subphase of distilled water at a pH of 5.4. The filled circles also determine the lower boundary of the δ two-phase field of Fig. 1A. Superimposed are calculated freezing pressure elevation curves for the ideal case (no reaction) and for the case of condensed complex formation for different values of n, the cooperativity parameter. The freezing pressure elevation curves are calculated by using Eq. 4 and the parameters listed in the text. In the ideal case (no reaction), xP,l = 1 − xC, where xC is the mole fraction of cholesterol in the sample. In the case of the formation of condensed complexes, xP,l depends on the extent of reaction (Eq. 1). π is 4.3 dyne/cm (Fig. 1A).
Fig 5.

Electrostatic effects on critical and freezing pressures. Critical pressures for the α two-phase field of Fig. 3C are measured as a function of pH (at a constant ionic strength of 150 mM) in A and as a function of ionic strength (at a constant pH of 5.4) in B. The composition of the monolayer was 25 mol% Dchol, 52.4 mol% DMPS, 22.4 mol% GM1, and 0.2 mol% TR-DHPE. The stripe superstructure phase is observed for this composition (see Fig. 1B). Calculated increases in electrostatic pressures for the liquid phase (using Eq. 6) are also shown in A and B. Freezing pressures of a monolayer containing 99.8 mol% Dchol and 0.2 mol% TR-DHPE are measured as a function of pH (at a constant ionic strength of 150 mM) in C and as a function of ionic strength (at a constant pH of 5.4) in D. Rigid, dark, and irregular domains are formed at the liquid–solid freezing transition pressure (see Fig. 1D). Calculated increases in freezing pressures are also shown in C and D. The solid lines include the effect of the compressibility of the phospholipid, while the dotted lines do not. The pressure increases are calculated relative to 2.3 and 6 dyne/cm at a pH of 2.6 (for A and C, respectively), and relative to 1 and 4.2 dyne/cm at an ionic strength of 4 μM (for B and D, respectively). The phospholipid is assumed to be no longer compressible for pressures higher than 25 dyne/cm. Other parameters used are listed in the text.
The new P − CnqPnp immiscibility at the higher pressures results in a lower miscibility critical point and a two-phase field, γ, that is approximately symmetric with the α two-phase field. The point where the γ two-phase field boundary intersects the δ solid–liquid coexistence curve defines a eutectic, and a horizontal line of three-phase coexistence (see Figs. 1F and 4). Depending on the parameters used in the calculations, the eutectic composition can be close to the stoichiometric composition. As a result, the γ two-phase field can be small (Fig. 1F) and is apparently missed experimentally in Fig. 1A.
The open circles in Fig. 2 show the freezing pressures in DMPS/GM1 mixtures as a function of added GM1. No liquid–liquid immiscibility was observed in DMPS/GM1 mixtures. Unlike Dchol, GM1 lowers the freezing pressure of DMPS at low mol fractions up to ∼30%. At higher mol fractions, GM1 acts like Dchol and raises the freezing pressure. Monolayers are unstable at still higher concentrations of GM1.
Phase Diagrams for DMPS–Dchol–GM1 Mixtures.
Fig. 3 shows the effect of GM1 on DMPS–Dchol phase diagrams. The γ two-phase field is probably too small to be observed in the DMPS–Dchol binary phase diagram (Fig. 1A), but is enlarged with the addition of GM1 (Fig. 3 A–C). The α and β two-phase fields do not change significantly, whereas the δ two-phase boundary gets steeper. The three-phase horizontal line marking the boundary between the δ and ɛ two-phase fields does not move significantly with increasing GM1. Details of the domain morphology are the same as for Fig. 1A. The γ liquid–liquid immiscibility (circular white domains that are 1–10 μm in diameter on a dark gray background) emerges from a uniform gray background as the pressure is increased after passing through the α two-phase field.
Fig 3.

Experimental pressure-composition phase diagrams for ternary mixtures of Dchol, DMPS, and GM1. The molar ratios of DMPS/GM1 were 90:10 (A), 85:15 (B), and 70:30 (C and D). In A–C, the subphase was distilled water at pH 5.4. In D, the ionic strength of the subphase was 150 mM (NaCl) and the pH was held constant at 5.4 with a citrate-phosphate saline buffer. α, β, and γ are liquid–liquid coexistence regions (phase boundaries are denoted by circles). δ and ɛ are solid–liquid coexistence regions (phase boundaries are marked by + and ×, respectively). Spot checks carried out with cholesterol instead of Dchol are shown by squares. Errors for the transition pressures are 3–15% based on three independent measurements (not shown). The lines drawn to denote the phase boundaries are not fit to theory. Other details are the same as in the Fig. 1A legend.
In Fig. 3 note that there are three different two-phase fields (α, β, and γ) in a narrow composition and pressure range. In such cases, long mixing times (2–3 h) are required to ensure composition homogeneity. Compositional inhomogeneities due to incomplete mixing have been previously observed in phase diagrams with just an α and a β two-phase field (3) when the overall composition was close to the cusp composition. That is, α-like and β-like domains were observed simultaneously in the same monolayer. In such cases, mixing times of the order of 15–20 min were sufficient for equilibration.
Fig. 4 shows phase diagrams with three miscibility critical points for binary mixtures of C and P calculated by using the procedure outlined above. (Ternary mixtures containing GM1 are treated as pseudobinary mixtures of C and an average P.) As seen in Fig. 4 A and B, critical points and eutectics move toward the stoichiometric composition as n is increased. Increasing the ionic strength of the subphase results in increases in the critical pressures as seen in going from Fig. 4B to Fig. 4C. The δ and ɛ two-phase fields consist of a solid phospholipid phase in equilibrium with a liquid phase. In the δ two-phase field the liquid is rich in phospholipid, whereas in the ɛ two-phase field the liquid is rich in condensed complex.
Effects of Subphase Ionic Strength and pH.
Monolayers containing DMPS (and GM1) are charged over the pH range studied. Fig. 5 A and B (filled circles) show the effect of varying subphase pH and ionic strength, respectively, on the upper miscibility critical point of the α two-phase field for the ternary mixture of DMPS, GM1, and Dchol (Fig. 3C) containing 25 mol% Dchol. Fig. 5 C and D (filled circles) show the effect of varying subphase pH and ionic strength, respectively, on the freezing pressure of DMPS. The subphase ionic strength was held constant at 150 mM (NaCl) in the pH studies [using citrate-phosphate saline (CPS) and PBS buffers]. In the ionic strength studies, the pH of the subphase was held constant at 5.4 with a CPS buffer. For subphase conditions in the pH range of 6.4–6.8 and ionic strength of 10–150 mM, use of the CPS or PBS buffers yielded similar values for the transition pressures. Fig. 5 A and B also shows plots of calculated increases in liquid-phase electrostatic pressures as the subphase pH and ionic strength is changed (using Eq. 5 in the Appendix). Fig. 5 C and D shows plots of calculated increases in freezing pressures for a pure DMPS monolayer. The solid lines take into account the compressibility of the phospholipid, while the dotted lines do not. The calculated increase in pressures is of the same order as that observed experimentally. Compressibility parameters are sometimes quoted to be in the range of 0.001–0.015 cm/dyne (11, 12). (Changes in either compressibility or area parameters can bring about closer agreement with experiment.) For a fixed subphase pH, as the ionic strength increases, the surface potential becomes less negative, the degree of ionization increases, and consequently the electrostatic pressure also increases. For a fixed subphase ionic strength, as the pH increases, the degree of ionization increases, and the electrostatic pressure increases.
Control experiments were carried out with dipalmitoylphosphatidylcholine. The switch from distilled water to PBS increases the freezing pressure by 0.8 dyne/cm, compared to 16 dyne/cm for DMPS.
Discussion
It is reassuring to find that the new phase diagrams with three miscibility critical points conform with the thermodynamic model of condensed complexes used in earlier work (3). That is, one boundary of the new two-phase field γ borders the composition of the condensed complex. In other words, in the phase diagrams seen in Figs. 1A and 3 the composition defined by the cusp between the α and β two-phase fields also serves as boundary limits for the new γ and ɛ two-phase fields. It is also reassuring to see that the effects of aqueous phase pH and ionic strength can be approximated in terms of the ionic double layer related to membrane charge (see Fig. 5). Note that, as shown in Fig. 3D, a change in ionic strength (leading to increased membrane charge) changes some features of the experimental-phase diagrams significantly but not those characteristic of complex formation. The theoretical calculations of electrostatic pressures, as outlined in the Appendix, yield changes in the phase diagrams that are semiquantitatively in accord with experiment. For example, in going from Fig. 3 C to D, the critical pressures of the α, β, and γ two-phase fields are increased by 5, 4, and 7 dyne/cm, respectively, whereas the calculated increases in going from Fig. 4 B to C are 7, 9, and 4 dyne/cm. (No effort was made to vary parameters so as to match these changes as closely as possible.)
The new liquid phase that appears in the ɛ two-phase field is largely condensed complex in equilibrium with solid DMPS (and GM1). In the γ two-phase field, one of the liquid phases is rich in condensed complex. We suggest that the occurrence of this new two-phase field, γ, is related to a preference of GM1 to localize in ordered hydrophobic regions. This preference of GM1 is evident from its preferred solubility in the solid phase of DMPS relative to the liquid phase of DMPS, as seen from the depression in freezing point pressures in Fig. 2 (open circles). Solubility of GM1 in dipalmitoylphosphatidylethanolamine has recently been observed by x-ray scattering studies of monolayers of these mixtures (13).
The glycolipid GM1 is normally localized on the outer leaflet of plasma membranes, whereas phosphatidylserine lipids are largely localized on the inner leaflet (14). In our work GM1 was initially introduced in the membrane as a labeling probe, but fortuitously enabled the augmentation of the γ two-phase field, which was only suspected in the absence of GM1 (Fig. 1A). In the phase diagrams in Fig. 3, the freezing pressures at zero cholesterol concentration are low compared to that in Fig. 1A (in the absence of GM1). This is due to the solubility of GM1 in DMPS.
Unfortunately, it is difficult to estimate the values of the cooperativity n and equilibrium constant K from the phase diagrams. Assuming the equilibrium constant is large enough that the reaction (Eq. 1) is essentially complete at the stoichiometric composition (K̄ > 5), then crude estimates of n can be made. For example, the observed freezing point pressures shown in Fig. 2 conform approximately to both ideal behavior as well as to complex formation with n = 2. However, if the experiments conformed to the ideal curve, then it should have been possible to record more points at higher pressures along this curve. The upswing of the freezing curve is evidently more rapid than ideal at the higher cholesterol concentrations, as suggested by the data (Figs. 1A and 3). Note also that critical points tend to move toward the stoichiometric composition with increasing n (Fig. 4 A and B). The resulting asymmetry in the phase diagrams increases with increasing n. Asymmetry of this type is often observed experimentally in β two-phase fields and is seen here in the γ two-phase field, but is not evident in the small α two-phase field. Again, the crude estimate of n = 2 is compatible with the data.
Except for the presence of the α and β two-phase fields, the phase diagrams in Figs. 3 and 4 bear a similarity to the earlier bilayer phase diagrams calculated by Ipsen et al., (15) when their temperature or our pressure axes are reversed. (See also ref. 16.) Our γ two-phase field corresponds to their two-phase field involving the equilibrium between the “liquid-ordered” and the “liquid-disordered” phases. Their calculated phase diagrams, however, do not show the sharp features characteristic of complex formation.
Both the complexity and consistency of the phase diagrams observed for mixtures of cholesterol with phospholipids (and sphingomyelins) imply some common molecular order. In our work this order is formulated in terms of condensed complexes. The three miscibility critical points reported here are all related to the formation of these complexes. They represent conditions where the complexes become more or less miscible with phospholipids or cholesterol.
Membrane Electrostatic Pressure
The DMPS/GM1/Dchol membranes are charged due to ionization of the carboxylic acid groups of serine in DMPS and sialic acid in GM1. The energy of the resulting ionic double layer contributes to the chemical potentials in Eq. 2 through the electrostatic pressure. Using Gouy-Chapman theory (17–19), the electrostatic pressure is given by the equations,
 |
where s = sinh(Φ0e/2kBT) and e is the charge on an electron. For a univalent ionic solution, the surface charge density σ and surface potential Φ0 are related to one another through the equation
 |
where D ≈ 80 is the dielectric constant of water and n0 is the concentration of singly charged ions in the subphase.
The ionization of the carboxylic acid groups of serine and sialic acid at the membrane surface can be represented by the equilibrium equation, [H ] = Ka(σ0 − σ)/σ where σ0 is the surface charge density for a fully ionized membrane and Ka is the carboxyl group ionization constant at the surface. The surface proton concentration [H
 ] is related to the proton concentration far away from the surface [H
 ] by the Boltzmann equation, [H
 ] = [H
 ]exp(Φ0e/kBT). The foregoing equations can be combined to yield
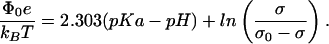 |
Solving Eqs. 6 and 7 simultaneously provides equilibrium values for the surface potential, Φ0, and the degree of ionization, σ/σ0, for specified conditions of pH and ionic strength. Using these equilibrium values, it is possible to calculate the resulting electrostatic pressure from Eq. 5. The electrostatic pressure can then be included in the chemical potentials and free energy function so as to derive phase diagrams for a given subphase pH and ionic strength.
A surface charge–ionization analysis related to the above was used by MacDonald et al. (4) in a study of DPPS bilayer vesicles. We use their value of pKal = 2.7 for DMPS in the liquid phase, but (unlike their work) a value of pKas = 8.0 for DMPS in the solid phase. These values for the ionization constants give acceptable fits to the pressure vs. pH and ionic strength results shown in Fig. 5 C and D. The molecular area for DMPS in the solid phase (AP,s) is taken to be 40 Å2, and its compressibility is assumed to be negligible. Unless otherwise noted in the figure legends, calculations are carried out for distilled water (n0 ≈ 10−5.4 mol/liter and pH = 5.4). In principle, changes in subphase properties change both critical pressures and compositions (Fig. 4 B and C), but the calculated changes in composition are generally negligible, and the changes in calculated critical pressures can be simply estimated from the changes in electrostatic pressures, as shown in Fig. 5 A and B. As a rough approximation, both DMPS and GM1 are assumed to contribute equally to the charge density in the liquid phase.
Acknowledgments
We are indebted to Thomas Fischer, Tom Anderson, and Marija Vrljic for helpful discussions. This work was supported by National Institutes of Health Grant 5R01AI13587-27.
Abbreviations
Dchol, dihydrocholesterol
DMPS, dimyristoylphosphatidylserine
GM1, ganglioside GM1
TR-DHPE, Texas red dihexanoylphosphoethanolamine
References
- 1.Subramaniam S. & McConnell, H. M. (1987) J. Phys. Chem. 91, 1715-1718. [Google Scholar]
- 2.McConnell H. M. (1991) Annu. Rev. Phys. Chem. 42, 171-195. [Google Scholar]
- 3.Radhakrishnan A. & McConnell, H. M. (1999) Biophys. J. 77, 1507-1517. [DOI] [PMC free article] [PubMed] [Google Scholar]
- 4.MacDonald R. C., Simon, S. A. & Baer, E. (1976) Biochemistry 15, 885-891. [DOI] [PubMed] [Google Scholar]
- 5.Radhakrishnan A. & McConnell, H. M. (2002) J. Phys. Chem. 106, 4755-4762. [Google Scholar]
- 6.Lide D. R., (1991) CRC Handbook of Chemistry and Physics (CRC, Ann Arbor, MI), pp. 6–116.
- 7.Keller S. L., Radhakrishnan, A. & McConnell, H. M. (2000) J. Phys. Chem. B 104, 7522-7527. [Google Scholar]
- 8.Weis R. M. & McConnell, H. M. (1985) J. Phys. Chem. 89, 4453-4459. [Google Scholar]
- 9.Keller S. L. & McConnell, H. M. (1999) Phys. Rev. Lett. 82, 1602-1605. [Google Scholar]
- 10.Lee K. Y. C., Klingler, J. F. & McConnell, H. M. (1994) Science 263, 655-658. [DOI] [PubMed] [Google Scholar]
- 11.Albrecht O., Gruler, H. & Sackmann, E. (1981) J. Colloid Interface Sci. 79, 319-338. [Google Scholar]
- 12.Marsh D. (1996) Biochim. Biophys. Acta 1286, 183-223. [DOI] [PubMed] [Google Scholar]
- 13.Majewski J., Kuhl, T. L., Kjaer, K. & Smith, G. S. (2001) Biophys. J. 81, 2707-2715. [DOI] [PMC free article] [PubMed] [Google Scholar]
- 14.Sprong H., van der Sluijs, P. & van Meer, G. (2001) Nat. Rev. Mol. Cell Biol. 21, 504-513. [DOI] [PubMed] [Google Scholar]
- 15.Ipsen J. H., Karlstrom, G., Mouritsen, O. G., Wennerström, H. & Zuckermann, M. J. (1987) Biochim. Biophys. Acta 905, 162-172. [DOI] [PubMed] [Google Scholar]
- 16.Anderson T. G. & McConnell, H. M. (2001) Biophys. J. 81, 2774-2785. [DOI] [PMC free article] [PubMed] [Google Scholar]
- 17.Fennel D. E. & Wennerström, H., (1999) The Colloidal Domain: Where Physics, Chemistry, Biology, and Technology Meet (Wiley, New York), pp. 91–123.
- 18.Adamson A. W., (1967) Physical Chemistry of Surfaces (Wiley-Interscience, New York), pp. 209–223.
- 19.Davies J. T. (1951) Proc. R. Soc. London Ser. A 208, 224-247. [Google Scholar]