Abstract
The sequence-dependent curvature is generally recognized as an important and biologically relevant property of DNA because it is involved in the formation and stability of association complexes with proteins. When a DNA tract, intrinsically curved for the periodical recurrence on the same strand of A-tracts phased with the B-DNA periodicity, is deposited on a flat surface, it exposes to that surface either a T- or an A-rich face. The surface of a freshly cleaved mica crystal recognizes those two faces and preferentially interacts with the former one. Statistical analysis of scanning force microscopy (SFM) images provides evidence of this recognition between an inorganic crystal surface and nanoscale structures of double-stranded DNA. This finding could open the way toward the use of the sequence-dependent adhesion to specific crystal faces for nanotechnological purposes.
It is widely accepted that the local, sequence-dependent curvature and dynamics of the double-stranded DNA chain segments play a crucial and active role in DNA packaging, transcription, replication, recombination, and repair processes, and in nucleosome stability and positioning (1). Thus, a quantitative knowledge of the curvature and the flexibility of double-stranded DNA has become important to understand the determinants of DNA–protein recognition. We have recently described how SFM makes it possible to map sequence-dependent curvature and flexibility along the DNA chain (2, 3). In these previous investigations, indications of preferential adsorption involving curved DNA tracts on the surface of mica were obtained. To reach definite evidence of such recognition we have investigated a highly curved DNA fragment to amplify this effect.
A periodic recurrence of A-tracts phased with the B-DNA periodicity, like tracts of three to six adenine steps centered approximately every 10.5 base pairs, drives extended intrinsic curvatures along a DNA chain (4). These curved DNA tracts give rise to planar or quasi planar superstructures. It is worth noting that, when these short stretches of adenine steps are positioned on the same strand, the adenine bases tend to be preferentially positioned on one side of the curvature plane, while the complementary thymines will be found on the other side. When deposited on a flat surface, these curved DNA tracts will thus interact with that surface, on average, with either an A- or a T-rich face. A tract of DNA with very extensive phasing of repeated A-tracts is readily available in the kinetoplast DNA of the Trypanosomatidae protozoan Crithidia fasciculata. This DNA segment is the most highly curved DNA we know of at present (5). The profiles assumed by these curved DNA molecules on deposition on a flat surface can be observed by scanning force microscopy (SFM). Only if the sequence orientation for each of the imaged molecules could be known would it be possible to determine the face with which the molecules adsorb on the surface (on average) through the study of the average chain-curvature of the molecule ensemble. To remove the uncertainty on the sequence orientation in the imaged molecules, we followed the strategy of constructing palindromic DNA molecules (2) as also proposed by Révet and Fourcade (6). We tailored two palindromes with an intrinsically straight linker bridging two highly curved DNA tracts. The sequence of the two curved tracts in a palindromic construct is characterized by periodical recurrence of repeated AA in the first followed by TT steps in the other, and, conversely, TT followed by AA steps in the other palindromic construct. The use of a palindrome allows the unequivocal correspondence of a position along the DNA trace in the microscope images with a position in the base sequence, without the need to use external chemical labels to define the direction of the sequence (2). The choice to use a palindromic DNA gives way to a dyad symmetry relating the two chemically equivalent halves. This dyad symmetry is also reflected in the stereochemistry of the molecules and therefore in all of the average structural and physical properties experimentally detectable along the DNA chain. The presence of two symmetrically arranged equivalent curved tracts also acts as an internal gauge of the statistical completeness of the experimental data set. Furthermore, the symmetry allows doubling of the curvature data obtained from the analysis of the image of one molecule.
In this paper, we report evidence that the surface of a freshly cleaved mica crystal recognizes the two faces of an intrinsically curved DNA tract and it preferentially interacts with the T-rich one. This is direct evidence of a differential recognition between the surface of an inorganic crystal and the nanoscale structure of a double-stranded DNA chain.
Materials and Methods
Preparation of Palindromic Dimers from C. fasciculata.
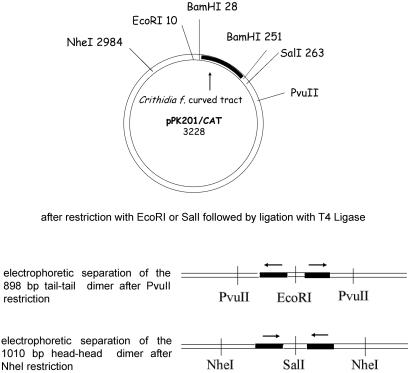
Plasmid pPK201/CAT, kindly provided by E. Di Mauro (University of Rome, “La Sapienza”), contains the StuI–AccI 211-bp bent segment from the kinetoplast DNA of the Trypanosomatidae protozoan C. fasciculata cloned in the BamHI site of the vector pSP65 (7). The 898-bp dimer of the EcoRI–PvuII fragment of pPK201/CAT was obtained as illustrated in Fig. 1. DNA was linearized by digestion with EcoRI, extracted with phenol, precipitated with ethanol, and ligated at a concentration of 1.3 μg/μl for 3 h at 20°C with T4 DNA ligase (1.3 units/μl). Ligated fragments were then cleaved with PvuII and loaded on a preparative 1% agarose gel (SeaKem GTG FMC) to select the desired dimer having the length of 898 bp among the different forms produced by ligation. We called this dimer tail-to-tail, after defining a direction (head-to-tail) in the sequence of each monomer according to that in the plasmid sequence (see Fig. 1).
Figure 1.
Schematic drawing of dimer preparation from the plasmid pPK201/CAT. The arrows indicate the direction of the C. fasciculata curved tract in the plasmid.
The head-to-head 1010-bp dimer of the SalI–NheI fragment of pPK201/CAT was obtained as illustrated in Fig. 1. DNA was linearized by digestion with SalI, extracted with phenol, precipitated with ethanol, and ligated at a concentration of 1.3 μg/μl for 3 h at 20°C with T4 DNA ligase (1.3 units/μl). Ligated fragments were then cleaved with NheI and loaded on a preparative 1% agarose gel (SeaKem GTG FMC) to select among the different forms produced by ligation, the desired dimer having the length of 1010 bp.
Both DNA fragments were extracted from the gel and purified by using the QIAquick gel-extraction kit (Qiagen, Valencia, CA).
SFM Imaging, Image Processing, and Molecule Measurements.
DNA molecules were deposited on freshly cleaved ruby mica (B&M Mica, New York) from a nanomolar DNA solution containing 4 mM Hepes buffer (pH 7.4), 10 mM NaCl, and 2 mM MgCl2. The Mg(II) ions were added to promote DNA adsorption on mica. Ten to 15 μl of DNA solution was deposited on a 1- to 1.5-cm2 mica disk and left there for ≈2 min, then rinsed with 2–3 ml of milliQ deionized water (Millipore), added dropwise, and dried under a gentle flow of nitrogen gas.
Imaging was performed in a tapping mode with PointProbe noncontact silicon probes (NanoSensors, Wetzlar, Germany) on a NanoScope IIIa scanning force microscope system equipped with a multimode head and a type E piezoelectric scanner (Digital Instruments, Santa Barbara, CA). Images have been recorded with a 10–15 μm/s linear scanning speed at a sampling density of 4–9 nm2 per pixel. Raw SFM images have been processed only for background removal (flattening) by using the microscope manufacturer's image processing software. DNA molecules profiles have been measured from the SFM images by using alex, a software package written for probe microscopy image processing (8), and by semiautomatically tracking the molecule contours on the SFM images. In digitizing the molecule contours, we have left out molecules with suspiciously short contour length (probably fragments), and those that had suspiciously long contour lengths.
Analysis of SFM DNA Traces in Terms of Curvature.
The curvature profiles along the contour of each DNA molecule have been evaluated from the location of the pixels corresponding to each DNA chain in the images, by computing the vectorial product of the directional chain segments. The nonuniform pixel sequence of the DNA images was transformed in a uniform curvature distribution along the contour of the molecules through Fourier transform operations. After this transformation, the number of points, which interpolate the DNA traces, corresponds to the average value of pixels per molecule.
According to the classical formulation by Landau and Lifshitz (9), the curvature of a space line is defined as the derivative C = dt/dl of the tangent versor, t, along the line, l. Its modulus is the inverse of the curvature radius and its direction is that of the main normal to the curve. In the case of DNA, the line corresponds to the helical axis and the curvature is a vectorial function of the sequence. It represents the angular deviation between the local helical axes of the nth and (n+1)th helix turns centered on the nth and (n+1)th dinucleotide steps, respectively.
Actually, the DNA curvature is a superstructural sequence-dependent property, which is continuously changed by the thermal energy of the environment. Assuming first-order elasticity, corresponding to a linear response of the DNA to such energy exchanges, the ensemble average value of curvature is defined as:
 |
where C(n) is the observed curvature per bp at position n, C0(n) is the corresponding static curvature, and χ(n) represents the dynamic fluctuation. Brackets 〈…〉 mean averaging is over the statistical ensemble. The latter term, which corresponds to the dynamic contribution to the curvature, is obviously zero. Therefore, the intrinsic curvature, C0(n), is the statistical average of the curvature at the nth sequence position.
However, the segmental nature of the DNA traces, because of the SFM resolution power requires the definition of the segmental curvature, Cm(n) (8), which represents the angular deviation of the local helical axes separated by the segment length in bp, m. Accordingly, 〈Cm(n)〉 represents the ensemble average segmental intrinsic curvature. We adopt m = 21 bp corresponding to two DNA turns, a length adequate to the SFM resolution.
The experimental average curvature profile was compared with the corresponding theoretical intrinsic curvature evaluated by adopting different wedge models (ref. 10 and references therein). The calculations were carried out by using the complex plane formulation of local curvature we introduced (11, 12). Such a formulation represents in modulus and phase the local deviation of the DNA helical axes from the straight direction.
Results and Discussion
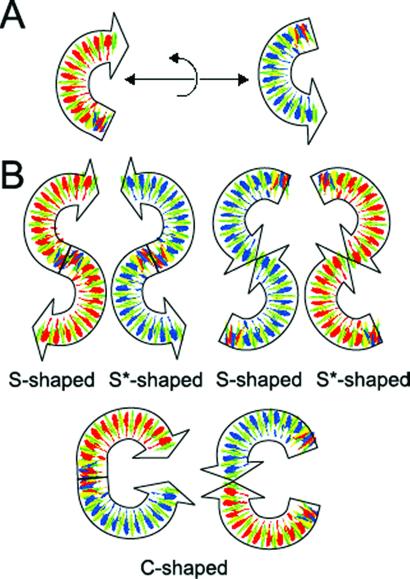
A curve in space can be fully described by its local curvature amplitudes and phases (11, 12). On the surface, the phase information is reduced to the sign of the curvature; if a segment of the curve is rotated counterclockwise with respect to the direction of the preceding segment, the local curvature is positive. In 3D, the dyad axis, which characterizes the averaged shape of the palindromic DNA dimers, can be oriented along any direction of space with respect to the average plane of the curved tracts. This (statistical) symmetry constraint also persists when the molecules are flattened on a crystal surface, such as mica in SFM images, but only two alternative directions of the dyad axis are allowed, parallel or perpendicular to the surface plane. In the former case both curved halves of the molecule have the same curvature sign, in the latter case the two curved halves have curvatures opposite in sign. We called these symmetry species C-like shape and S-like shape (or S*, the asterisk indicating the mirror image), respectively, because the curves are isomorphous with these letters (Fig. 2). The C-like molecules will be characterized by two positive curvatures or two negative ones, depending on which end is chosen as the starting point of the molecule (but the sequence associated will be the same, thanks to the palindromicity). On the contrary, the two main curvatures will be oppositely signed in an S-like or an S*-like shape; either with a positive followed by a negative one (S-shape), or by a negative followed by a positive one (S* shape), independent of the direction of which end is chosen as the starting point of the molecule. These two possibilities are the result of the adhesion of the three-dimensional dimeric molecules on either one of the two opposite faces. In fact, because of the dyad symmetry, the two faces are prochiral and expose complementary sequences. In the case of C-shaped molecules (Fig. 2), the two faces are equivalent, instead, because within either face one half exposes a sequence complementary to that of the other half. This also implies that the two faces of the C-shaped molecules are indistinguishable and belong to the same symmetry species.
Figure 2.
(A) Pictorial representation of the curved DNA tract. In this scheme, the DNA is drawn as a directional ribbon that is thought to be perpendicular to the bases, so that the color of a band of the ribbon tells what base is toward the observer. Red is for A, blue for T, green for G, and yellow for C. The orientation of the base sequence of the DNA tract used to build the dimers can be represented as tail-to-head. If the direction of the DNA tract is reversed, the bases toward the observer are interchanged with those that are complementary. (B) The scheme of the tail-to-tail and head-to-head dimers on the mica surface. S-shaped dimers in one case and S*-shaped dimers in the other expose the same faces to the surface. The C-shaped dimers expose both the types of faces (A-rich and T-rich) to the surface.
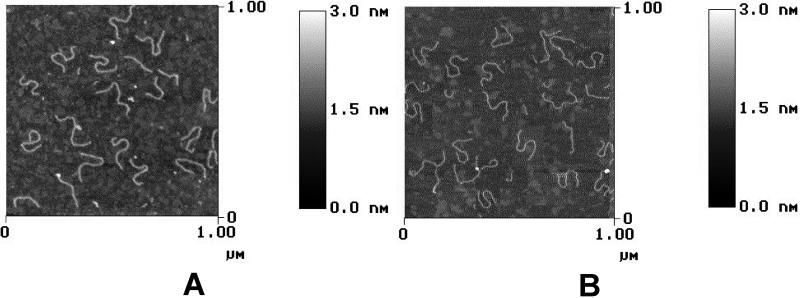
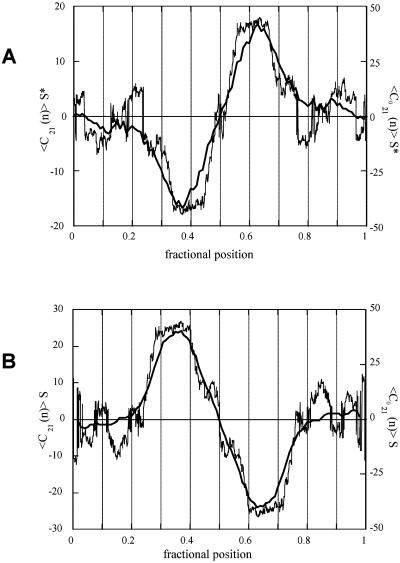
We collected a large pool of SFM images (about 1,500) of both palindromic DNA constructs deposited on the surface of freshly cleaved muscovite mica. Two examples are reported in Fig. 3 for the head-to-head and tail-to-tail palindromic dimers. The molecular shapes have been extracted from the SFM images and analyzed as described (2, 3). As evident in Fig. 3, the thermal energy causes a high variability of the shapes of the molecules. Therefore, at the level of a single molecule, the dyad symmetry is fulfilled as a statistical property of the molecular ensemble. We have shown that, by collecting data from a statistically representative set of SFM images, the intrinsic static curvatures, with their relative orientations, can be mapped along a DNA chain (2, 3). By following this method, we evaluated the average curvature profile for each palindromic DNA dimer. A sigmoidal shape was obtained for the curvature profiles of both dimers, but the signs of the two halves were opposite in respect to each other (Fig. 4). This surprising result can be interpreted as evidence that the surface preferentially binds one of the two faces of the curved DNA tracts. In fact, we should expect that a nondifferential adhesion would lay an equal number of S and S* forms on the surface, so that their contribution to the average molecular curvature would cancel out one another. Thus, a nonzero average curvature profile directly monitors the imbalance of the subpopulations of the S and S* adhesion to the mica.
Figure 3.
SFM images showing a sample of DNA shapes of the head-to-head (A) and tail-to-tail (B) palindromic DNA dimers. The height of the features on the surface are coded in gray shade according to the scale bars on the right. Despite their variability, the S* and S shapes are easily recognizable. The images were obtained by operating in tapping mode on mildly dehydrated DNA spreads.
Figure 4.
Experimental and theoretically predicted local curvature for the head-to-head (A) and the tail-to-tail (B) curved dimers. The average S* shape of the experimental curvature for the head-to-head dimer and the average S shape for the tail-to-tail dimer are evident from the signs of the halves of the two curvature profiles. The theoretical curvatures for the correspondent flattened molecules are displayed as thin traces. The experimental and theoretical curvatures refer to a DNA tract of 21 bp.
In further detail, the preferential adhesion of one of the alternative prochiral faces is such that the head-to-head dimer displays a negative curvature for the first half and a positive curvature for the second, that corresponds to a preferential S* average shape. On the other hand, the tail-to-tail dimer displays a positive curvature for the first half and a negative curvature for the second (see Fig. 4). This palindrome preferentially assumes an S average shape on the crystal surface of mica. This selective adhesion is an expected result because of opposite sequence directions in the two palindromes, as illustrated in Figs. 1 and 2.
The comparison between the experimental and theoretical curvature profiles for both dimers is reported in Fig. 4. The theoretical intrinsic curvature was evaluated by adopting different curvature models (ref. 10 and references therein) obtaining similar results. In particular, all of the models coherently predict an S-shaped 3D superstructure for the tail-to-tail dimer but a nearly C-shaped superstructure for the head-to-head palindrome, because the sequence between the two halves differs by about a half-turn. In the latter case, the theoretical curvature for the S shape was calculated after a virtual twisting around the DNA tract bridging the two curved halves.
A strong asymmetry in the distribution of AA and TT dinucleotide steps in the direction perpendicular to the curvature plane characterizes both the dimers. This is exemplified in Fig. 2. From this analysis, we can infer that both dimers preferentially expose the same T-rich face of the curved tracts to the mica surface. To achieve this preferential adhesion, because of the inversion of the curved sequence (see Figs. 1 and 2), they were forced to assume two shapes that are mirror images to each other.
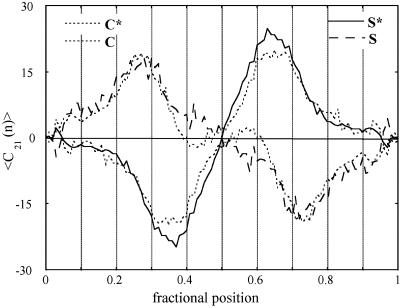
This result was not because of an incomplete ensemble averaging. The symmetrical shape of the sequence-dependent curvature profiles and the equivalence in the amplitude of the curvature of the two halves of the molecules showed that the sampled ensemble is statistically relevant for this system. After this internal check, the curvature profiles have been symmetrized to further improve the statistical averaging by doubling the information on the curved tracts. Two additional proofs of the complete statistical ensemble were achieved. First, for both the examined populations of DNA molecules the experimental local curvature modulus along the chain was found to be proportional to the corresponding standard deviation of the curvature modulus, as predicted theoretically (3). Second, after having classified the shapes of all of the imaged molecules according to the curvature of their halves into the three subpopulations of the S, S*, and C classes of symmetry, the profiles were averaged over these subpopulations, and a crossed equivalence of the halves of the C and S forms was detected. This finding indicates that the subpopulations are rather complete statistical ensembles for the curvature analysis. As an example, experimental curvatures of the tail-to-tail palindromic dimer after shape classification are reported in Fig. 5. For this representation, the C species have been separated in the two subclasses with positive or negative global curvature. The relative populations of the different symmetry species for the tail-to-tail palindrome are S (0.47), S* (0.11), and C+C* (0.42). This classification revealed that the preference of the mica surface for the T-rich face of the C. fasciculata DNA is not a small effect. In fact, for the tail-to-tail palindrome the molecules with an S shape were 5 times as numerous as those in the S* class. Conversely, for the head-to-head dimer, the S* class is much more populated than the S class (9 times as much) despite the predicted 3D C-shaped superstructure. The relative populations of the different symmetry species are S (0.07), S* (0.63), and C+C* (0.30). Therefore, the sequence recognition effect by mica surface appears to overcome the addition of one half turn between the two halves of the head-to-head construct that should favor the C-shaped species.
Figure 5.
Experimental curvature (referred to a DNA tract of 21 bp) of the tail-to-tail palindromic curved DNA dimer after shape classification. The curvatures of the species are coded as in the inserted key. For this representation, the C species have been separated into two subclasses with positive or negative global curvature.
The extent of this recognition effect is controlled by the amplitude of the curvatures. From the analysis of average local curvatures of other DNA palindrome dimers, we obtained the same evidence of the presence of a recognition phenomenon on the adsorption on the surface of mica (2, 3). These palindromes, made of pBR322 restriction fragments, had DNA sequences without any relevant phasing and exhibited only moderate curvatures. The recognition effect reported here is expected to be general for any curved DNA molecules. The choice of the fragment of C. fasciculata and its arrangement in a palindrome dimer was instrumental in amplifying this effect.
In addition, we gathered the same evidence of preferential adsorption also by depositing DNA molecules containing only one C. fasciculata curved tract per molecule, even though the asymmetry of the molecule complicates the analysis of the data (unpublished results).
Such a recognition effect might also account for the two opposite preferential azimuthal orientations of DNA molecules on inorganic crystal surfaces found by Rhodes and Klug (13) to explain the periodicity of about 10.5 base pairs of the nucleosomal DNA digestion by DNase I. In fact, the statistical distribution of dinucleotide steps in a large pool of the nucleosomal DNA sequences obtained by Satchwell et al. (14) contains either phased repetitions of the AA and TT steps or a pseudodyad axis that reports the halves of the molecules. Accordingly, the curvature diagram averaged over the pool of molecules is characterized by two statistically equivalent curved tracts bridged by a straight tract (15).
Currently, nanotechnology is trying to mimic biological mechanisms to assemble technological nanomachines. Much effort is nowadays paid to use DNA molecules for the building of self-assembling nanostructures (16). So far, this has been done by using the self-assembling information that the sequence of these molecules contains. A higher level of information is brought into play when the same DNA molecules can also preferentially assume structures or shapes that are recognized by a crystal surface. One further step toward higher levels of complexity is achieved by also using DNA-binding proteins. DNA-based nanotraces on cationic crystal surfaces can be designed by assembling highly curved and straight DNA tracts, even associated with proteins bonded to consensus targets, for biotechnological purposes.
Finally, sequence-dependent adhesion to specific crystal faces could open interesting perspectives, given the wide opportunities provided by the DNA combinatorial libraries following the guidelines designed by Belcher and coworkers (17) with peptide sequences.
Acknowledgments
This work was supported by “Progetto 60% Ateneo” of University “La Sapienza” Programmi Biotecnologie Legge 95/95 Ministero dell'Università e della Ricerca Scientifica e Tecnologica (MURST), 5% and MURST Progetti di Ricerca di Interesse Nazionale 1999–2001, 2001–2003, Progetti Pluriennali, Università di Bologna (2002), and Istituto Pasteur-Fondazione Cenci-Bolognetti.
Abbreviation
- SFM
scanning force microscopy
References
- 1.Travers A A. DNA–Protein Interactions. London: Chapman & Hall; 1993. [Google Scholar]
- 2.Zuccheri G, Scipioni A, Cavaliere V, Gargiulo G, De Santis P, Samorì B. Proc Natl Acad Sci USA. 2001;98:3074–3079. doi: 10.1073/pnas.051631198. [DOI] [PMC free article] [PubMed] [Google Scholar]
- 3. Scipioni, A., Zuccheri, G., Anselmi, C., Samorì, B. & De Santis, P. (2002) Biophys. J., in press. [DOI] [PMC free article] [PubMed]
- 4.Marini J C, Levene S D, Crothers D M, Englund P T. Proc Natl Acad Sci USA. 1982;79:7664–7668. doi: 10.1073/pnas.79.24.7664. [DOI] [PMC free article] [PubMed] [Google Scholar]
- 5.Griffith J, Bleyman M, Rauch C A, Kitchin P A, Englund P T. Cell. 1986;46:717–724. doi: 10.1016/0092-8674(86)90347-8. [DOI] [PubMed] [Google Scholar]
- 6.Révet B, Fourcade A. Nucleic Acids Res. 1998;26:2099–2104. doi: 10.1093/nar/26.9.2092. [DOI] [PMC free article] [PubMed] [Google Scholar]
- 7.Kitchin P A, Klein V A, Ryan K A, Gamm K L, Ranch C A, Kang D S, Wells R D, Englund P T. J Biol Chem. 1986;261:11302–11309. [PubMed] [Google Scholar]
- 8.Rivetti C, Guthold M, Bustamante C. J Mol Biol. 1996;264:919–932. doi: 10.1006/jmbi.1996.0687. [DOI] [PubMed] [Google Scholar]
- 9.Landau L D, Lifshitz E M. Theory of Elasticity. Oxford: Pergamon; 1991. [Google Scholar]
- 10.Crothers D M. Proc Natl Acad Sci USA. 1998;95:15163–15165. doi: 10.1073/pnas.95.26.15163. [DOI] [PMC free article] [PubMed] [Google Scholar]
- 11.De Santis P, Palleschi A, Morosetti S, Savino M. In: Structures and Dynamics of Nucleic Acids, Proteins and Membranes. Clementi E, Chin S, editors. New York: Plenum; 1986. pp. 31–49. [Google Scholar]
- 12.De Santis P, Palleschi A, Savino M, Scipioni A. Biochemistry. 1990;29:9269–9273. doi: 10.1021/bi00491a023. [DOI] [PubMed] [Google Scholar]
- 13.Rhodes D, Klug A. Nature. 1980;286:573–578. doi: 10.1038/286573a0. [DOI] [PubMed] [Google Scholar]
- 14.Satchwell S C, Drew H S, Travers A A. J Mol Biol. 1986;191:659–675. doi: 10.1016/0022-2836(86)90452-3. [DOI] [PubMed] [Google Scholar]
- 15.Boffelli D, De Santis P, Palleschi A, Savino M. Biophys Chem. 1991;39:127–136. doi: 10.1016/0301-4622(91)85014-h. [DOI] [PubMed] [Google Scholar]
- 16.Seeman N C. Trends Biotechnol. 1999;17:437–443. doi: 10.1016/s0167-7799(99)01360-8. [DOI] [PubMed] [Google Scholar]
- 17.Whaley S R, English D S, Hu E L, Barbara P F, Belcher A M. Nature. 2000;405:665–668. doi: 10.1038/35015043. [DOI] [PubMed] [Google Scholar]


