Abstract
Tuberous sclerosis complex (TSC) is an autosomal dominant genetic disorder that occurs upon mutation of either the TSC1 or TSC2 genes, which encode the protein products hamartin and tuberin, respectively. Here, we show that hamartin and tuberin function together to inhibit mammalian target of rapamycin (mTOR)-mediated signaling to eukaryotic initiation factor 4E-binding protein 1 (4E-BP1) and ribosomal protein S6 kinase 1 (S6K1). First, coexpression of hamartin and tuberin repressed phosphorylation of 4E-BP1, resulting in increased association of 4E-BP1 with eIF4E; importantly, a mutant of TSC2 derived from TSC patients was defective in repressing phosphorylation of 4E-BP1. Second, the activity of S6K1 was repressed by coexpression of hamartin and tuberin, but the activity of rapamycin-resistant mutants of S6K1 were not affected, implicating mTOR in the TSC-mediated inhibitory effect on S6K1. Third, hamartin and tuberin blocked the ability of amino acids to activate S6K1 within nutrient-deprived cells, a process that is dependent on mTOR. These findings strongly implicate the tuberin-hamartin tumor suppressor complex as an inhibitor of mTOR and suggest that the formation of tumors within TSC patients may result from aberrantly high levels of mTOR-mediated signaling to downstream targets.
Tuberous sclerosis complex (TSC) is an autosomal-dominant genetic disorder that leads to the formation of benign tumors known as hamartomas in the kidneys, brain, heart, eyes, and skin. These slowly proliferating growths are disorganized yet differentiated and often contain giant cells, leading to renal complications and neurological abnormalities such as autism, mental retardation, and epilepsy (for review, see ref. 1). Genetic studies show that TSC is caused by mutations within the TSC1 or TSC2 genes that encode the protein products hamartin (≈130 kDa) and tuberin (≈200 kDa), respectively, resulting in their inability to function as a tumor suppressor (2, 3). Hamartin and tuberin have been reported to interact in vivo and as a complex, they negatively regulate cell growth (an increase in cell mass/size) and proliferation (an increase in cell number; refs. 4 and 5). How TSC1 and TSC2 function at a molecular level is unclear.
In Drosophila melanogaster, dTSC1 and dTSC2 act together to regulate both cell growth and proliferation, and genetic epistatsis analyses place the tuberin-hamartin complex downstream of Drosophila phosphoinositide-3-kinase (PI3K) and dAkt/protein kinase B (PKB) but upstream of dS6K (6, 7). More recently, Akt was reported to phosphorylate tuberin in vivo at Ser-939 and Thr-1462 within mammalian cells (8). Also, a tuberin mutant with these Akt phosphorylation sites mutated to alanine dominantly inhibited the activation of ribosomal protein S6 kinase 1 (S6K1) upon insulin stimulation (8), indicating that the tuberin-hamartin complex acts downstream of Akt and upstream of S6K1 within mammalian cells. These data are consistent with the observation that S6K1 activity is aberrantly increased within lesions of lymphangioleiomyomatosis patients as a result of TSC2 mutations (9) and within TSC1-null mouse embryonic fibroblast cell lines (10), whereas the basal activity of PI3K and Akt remain unchanged.
S6K1 activation is effected through both PI3K-dependent and mTOR-dependent signaling mechanisms (refs. 11 and 12, and see review in ref. 13). mTOR (also referred to as FRAP/RAFT/RAPT) is a critical regulator of S6K1, as treatment of cells with the specific inhibitor, rapamycin, rapidly and completely inactivates S6K1 (see review in ref. 14). mTOR belongs to a family of phosphatidylinositide kinase-related kinases and is proposed to sense nutritional (e.g., amino acids; ref. 15) and energetic (e.g., ATP) sufficiency (16). mTOR is involved in the modulation of protein translation, cell-cycle progression, and cellular proliferation (14, 17). The regulation of 4E-binding protein 1 (4E-BP1) also is dependent on mTOR, where hypophosphorylated 4E-BP1, which occurs upon rapamycin treatment of cells, binds to and prevents eIF4E from forming initiation complexes required for driving cap-dependent translation (see review in ref. 14). Similarly to S6K1, phosphorylation of 4E-BP1 is effected through both PI3K- and mTOR-dependent signaling mechanisms (see review in ref. 13).
Here, we show that the TSC1 and TSC2 gene products, hamartin and tuberin, inhibit the mTOR-mediated input to both 4E-BP1 and S6K1. Importantly, a mutant of TSC2 derived from TSC patients is defective in repressing phosphorylation of 4E-BP1, underscoring the physiological significance of this work. These studies extend the current understanding of TSC and identifies mTOR and its downstream components as possible targets for the screening of drugs to be used to treat TSC patients.
Materials and Methods
cDNA Constructs.
Human TSC1 and TSC2 cDNAs were supplied by D. J. Kwiatkowski (Harvard University, Boston, MA) and subcloned into pRK7 so that hamartin or tuberin were expressed with N-terminal Flag-tagged (MDYDDDDK) fusions. N-terminal hemagglutinin (HA)-tagged (HA)-S6K1 vectors were generated as described (18). The pACTAG2/3HA-4E-BP1 was a gift from N. Sonenberg (McGill University, Montreal, Canada). Site-directed mutagenesis was carried out by using QuikChange (Stratagene) to generate mutations within TSC2.
Cell Culture, Transfection, and Extract Preparation.
Human embryonic kidney 293E (HEK293E) and human U20S osteosarcoma cells were cultured and maintained as described (18, 19). Transient transfections of HEK293E cells were performed by calcium phosphate (18) and U20S cells with Fugene6. After transfection (40 h), cells were harvested as described (19). Transfections using a green fluorescent protein expression vector revealed that ≈25–30% of the cells were transfected. Cells were serum-starved for 18 h, where applicable. For analysis of the insoluble pellet, the pellet was washed twice with lysis buffer (10 mM KPO4/1 mM EDTA/10 mM MgCl2/50 mM β-glycerophosphate/5 mM EGTA/0.5% Nonidet P-40/0.1% Brij 35/1 mM sodium orthovanadate/40 mg/ml phenylmethyl sufonyl fluroride/10 μg/ml leupeptin/5 μg pepstatin, pH 7.2) and then boiled for 20 min in sample buffer. For amino acid withdrawal/re-addition, cells were washed once and incubated with D-PBS (PBS containing 1 mg/ml D-glucose; GIBCO/BRL) for 1 h. The media was replaced with D-PBS pH 7.2 (1 mg/ml D-glucose) supplemented with 5× amino acid mixture diluted from MEM (Eagle's minimal essential medium) amino acid solution (GIBCO/BRL) for 1 h before the cells were lysed.
Analysis of Protein Phosphorylation and Association.
Western blotting was carried out as described (19). Anti-Flag monoclonal mouse M2 antibody was purchased from Eastman Kodak. The anti-HA antibody was a kind gift from M. Chou (Univ. of Pennsylvania, Philadelphia). Anti-4E-BP1, -tuberin, -Akt, and -eIF4E antibodies were obtained from Cell Signaling Technology (Beverly, MA). Mitogen-activated protein kinase (MAPK) antibodies were generated as described (20). Purification of eIF4E by affinity chromatography on m7GTP-Sepharose was carried out as described (19).
Immunoprecipitation and Immune Complex Kinase Assays.
HA-tagged Akt and S6K1 were immunoprecipitated from extracts with an anti-HA antibody bound to protein A-Sepharose (Amersham Pharmacia) for 3 h. Immunoprecipitates were washed and S6K1 kinase activity was determined in vitro by using recombinant GST-S6, as described (21). Quantification of incorporation of the 32P label was determined on a Bio-Rad PhosphorImager with IMAGEQUANT software.
Results
Coexpression of Hamartin and Tuberin Inhibits Insulin-Stimulated Phosphorylation of 4E-BP1, Resulting in Repression of eIF4E Function.
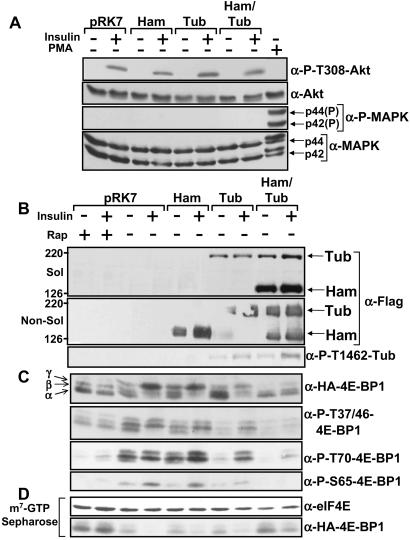
Given that S6K1 activity is high in cells containing inactivating mutations within the TSC1 or TSC2 genes (9, 10), we examined whether 4E-BP1, another downstream target of PI3K- and mTOR-dependent signaling, was affected by hamartin and tuberin. HEK293E cells transfected with hamartin, tuberin, and 4E-BP1 were serum-starved and then stimulated with insulin. Insulin stimulation of these cells specifically activates the PI3K pathway (as observed by Thr-308 phosphorylation of Akt, see Fig. 1A) but not the MAPK pathway. Phorbol 12-myristate 13-acetate (PMA), an activator of protein kinase C that strongly activates the MAPK pathway, was used as a control. Analysis of hamartin and tuberin within the Nonidet P-40 soluble and nonsoluble fraction (Fig. 1B Top and Middle, respectively) showed that hamartin was more abundant within the cell lysate when coexpressed with tuberin. The higher levels of hamartin likely reflect tuberin's reported ability to chaperone hamartin from an insoluble membrane fraction to the cytosol (22). As expected, tuberin was phosphorylated at the Akt phosphorylation site, Thr-1462, upon insulin stimulation (Fig. 1B Bottom).
Figure 1.
Hamartin and tuberin inhibits PI3K-dependent 4E-BP1 phosphorylation. HEK293E cells coexpressing Flag-tagged hamartin (Ham) and tuberin (Tub), where indicated, with HA-tagged 4E-BP1 were serum-starved and pretreated with 20 nM rapamycin (rap) for 30 min before being stimulated with insulin (100 nM) or PMA (100 ng/ml) for 30 min, where indicated. (A) The levels and Thr-308 phosphorylation of Akt and the levels and phosphorylation of the MAPK isoforms (p44 and p42) were determined. (B) Hamartin and tuberin protein levels were accessed from the cell lysates (Sol) and the insoluble fraction (Non-Sol) as described in Materials and Methods by using the anti-Flag antibody. Thr-1462 tuberin phosphorylation was analyzed by using a tuberin Thr-1462 phospho-specific antibody. (C) The phosphorylation of exogenous 4E-BP1 was determined with an anti-HA antibody and phospho-specific antibodies for 4E-BP1 at Thr-37 and/or 46, Ser-65, and Thr-70, as indicated. The α-, β-, and γ-species of 4E-BP1 are labeled accordingly. (D) Cell extracts were subjected to affinity chromatography on m7GTP-Sepharose, as described in Materials and Methods. The levels of eIF4E and exogenous 4E-BP1 that was copurified were determined.
Three phosphorylated species of 4E-BP1 can be resolved by SDS/PAGE, with α-isoforms being the least and γ-isoforms the most highly phosphorylated forms. Hamartin and tuberin coexpression blocked insulin-stimulated 4E-BP1 phosphorylation at Thr-36 and/or Thr-45, Ser-65, and Thr-70, as observed with rapamycin (Fig. 1C). To examine the association of 4E-BP1 with eIF4E, endogenous eIF4E was first purified by using the m7GTP analogue (coupled to Sepharose beads). The m7GTP cap moiety is found at the 5′-end of most mammalian mRNAs which eIF4E interacts with to drive cap-dependent translation (see review ref. 14). The level of HA-tagged 4E-BP1 bound to the eIF4E/m7GTP complex was compared (Fig. 1D). Rapamycin treatment or coexpression of hamartin and tuberin inhibited the ability of insulin to induce release of 4E-BP1 from eIF4E, showing that tuberin-hamartin complexes inhibit eIF4E function and, therefore, likely repress cap-dependent translation.
Hamartin and Tuberin Inhibit Signaling to 4E-BP1 and S6K1 in Proliferating U20S Cells, and a Tuberin Mutant (K599M) Derived from TSC Patients Is Defective in Repression of 4E-BP1 Phosphorylation.
To rule out cell-specific or agonist-specific effects, we examined 4E-BP1 phosphorylation in U2OS cells overexpressing hamartin and tuberin grown in the presence of serum. The coexpression of both hamartin and tuberin had a significant effect on repressing 4E-BP1 phosphorylation and S6K activity (Fig. 2 A and B, respectively), showing that the tuberin-hamartin complex influences the upstream signaling components that modulate both 4E-BP1 and S6K1.
Figure 2.
Hamartin and tuberin inhibit 4E-BP1 phosphorylation and S6K1 activity within proliferating cells. U20S cells overexpressing 4E-BP1 (A) or S6K1 (B) with or without hamartin (Ham) and tuberin (Tub), where indicated, were grown in serum and treated with 20 nM of rapamycin (Rap) for 30 min, as indicated. Hamartin, tuberin, and MAPK isoform (as a loading control) protein levels are shown. The α-, β-, and γ-species of 4E-BP1 are labeled accordingly. S6K1 kinase assays were carried out as described in Materials and Methods. The total levels of S6K1 are shown. Incorporation of 32P label into GST-S6 was assessed, and an autoradiograph of the gel is presented. The ratios of 32P label incorporated into GST-S6 were normalized against the empty vector (pRK7). The data presented are representative of at least three experiments. (C) HEK293E cells overexpressing 4E-BP1 with or without hamartin (Ham), tuberin (Tub), and the tuberin K599M mutant [Tub(K599M)], where indicated, were serum-starved and then stimulated with 100 nM insulin for 30 min, where indicated. Hamartin and tuberin expression and the extent of phosphorylation of 4E-BP1 was analyzed as for Fig. 1C.
It is likely that mutant forms of TSC2 found within TSC patients would encode dysfunctional tuberin that are impaired in their ability to repress signaling to 4E-BP1. To address this model, a tuberin point mutant (K599M) found within TSC patients was coexpressed with hamartin and 4E-BP1 (Fig. 2C). Expression of hamartin and the tuberin K599M mutant failed to repress 4E-BP1 phosphorylation, whereas coexpression of wild-type tuberin with hamartin did.
The Inhibition of S6K1 Activity by Hamartin and Tuberin Depends on mTOR.
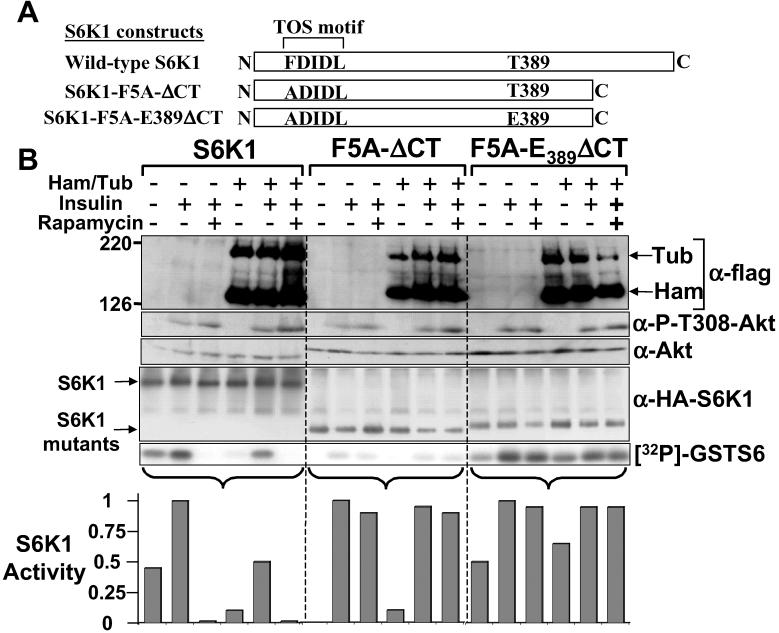
To explore whether tuberin-hamartin complexes negatively regulate S6K1 activity at the level of mTOR, we used S6K1 mutants that are resistant to rapamycin (Fig. 3A). We compared wild-type S6K1 to S6K1-F5A-ΔCT, which contains a point mutation (Phe5Ala) within the mTOR signaling motif in combination with a C-terminal deletion of 101 amino acids. This S6K1 mutants is insulin-responsive but completely resistant to the inhibitory effects of rapamycin (although with significantly reduced specific activity). The second mutant, F5A/E389-ΔCT (generated from F5A-ΔCT) is highly active, completely resistant to rapamycin, and has specific activity similar to wild-type S6K1 (18).
Figure 3.
Tuberin-hamartin inhibition of S6K1 depends on mTOR. (A) Diagrammatic representation of the S6K1 constructs. (B) HEK293E cells overexpressing these S6K1 proteins with or without hamartin (Ham) and tuberin (Tub) were serum-starved, pretreated with 20 nM rapamycin for 30 min before being stimulated with 100 nM insulin for 30 min, where indicated. Expression of hamartin, tuberin, and the protein levels and extent of Akt phosphorylation at Thr-308 were determined. S6K1 kinase assays were carried out as for Fig. 2. The graphs show the activity of S6K1 that is standardized to 1 for the insulin-treated sample for each of the S6K1 constructs. The data are representative of three individual experiments.
Analysis of these S6K1 derivatives upon insulin stimulation of HEK293E cells showed that hamartin and tuberin coexpression resulted in a fourfold reduction in the basal activity and a twofold reduction in the insulin-stimulated activity of wild-type S6K1 (Fig. 3B). The rapamycin-resistant mutants of S6K1 (F5A-ΔCT, and F5A/E389-ΔCT) were completely insensitive to the inhibitory effects of hamartin and tuberin coexpression and rapamycin treatment. These results indicate that the tuberin-hamartin complex inhibits S6K1 through a mTOR-dependent pathway, albeit not as potently as rapamycin.
Hamartin and Tuberin Inhibit Amino Acid-Dependent Signaling Through mTOR.
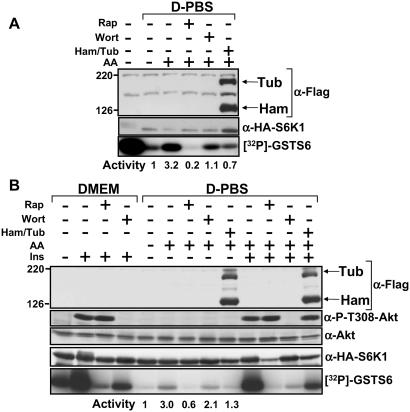
Withdrawal of amino acids, like inhibition of mTOR with rapamycin, prevents activation of wild-type S6K1 but not rapamycin-resistant mutants of S6K1 (23, 24). Therefore, we examined whether hamartin and tuberin could prevent S6K1 activation upon the re-addition of amino acids to cells. Hamartin and tuberin coexpression prevented amino acid-mediated activation of S6K1 within U20S cells (Fig. 4A). This effect was more pronounced than the inhibition observed upon wortmannin treatment, which implies that tuberin-hamartin complexes inhibit signaling pathways that converge on mTOR. To support this result further, HEK293E cells were deprived of amino acids and then stimulated with amino acids and insulin (Fig. 4B). Either rapamycin treatment or coexpression of hamartin and tuberin inhibited the amino acid-mediated activation of S6K1 more potently than wortmannin. However, upon insulin stimulation in the presence of amino acids, wortmannin inhibited activation of S6K1 to levels comparable to stimulation with amino acids alone, and this inhibition was more potent than when hamartin and tuberin were coexpressed. Therefore, in these experiments, hamartin and tuberin coexpression does not fully block mTOR-dependent signaling in response to mitogens.
Figure 4.
Hamartin and tuberin inhibit amino acid-mediated signaling through mTOR to S6K1. U20S (A) and HEK293E (B) cells overexpressing hamartin (Ham) and tuberin (Tub) with S6K1 were nutrient-deprived (D-PBS), as described in Materials and Methods. Cells were pretreated with either 20 nM rapamycin or 100 nM wortmannin for 30 min before the re-addition of amino acids in the continued presence of inhibitors, where indicated. HEK293E cells were treated for 30 min with 100 nM insulin as indicated. Levels of hamartin, tuberin, and Akt, as well as the phosphorylation of Akt at Thr-308, where determined. S6K1 kinase assays were carried out as for Fig. 2. The activity of S6K1 is standardized to 1 for the amino acid withdrawal-only sample. The data presented here are representative of three individual experiments.
Hamartin and Tuberin Inhibit mTOR-Mediated Signaling That Is Independent of PI3K.
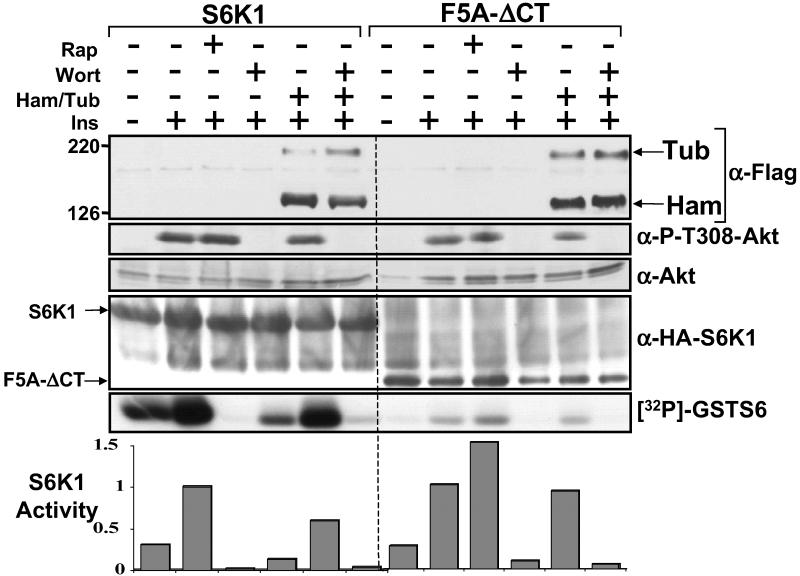
This study and our previous study indicate that the tuberin-hamartin complex impairs activation of S6K1 and that phosphorylation of tuberin by Akt in response to PI3K activation circumvented this inhibition (8). To investigate the effect of tuberin-hamartin complexes on PI3K-independent S6K1 activation, insulin-stimulated S6K1 activation was investigated in the presence of wortmannin with and without coexpressing hamartin and tuberin (Fig. 5). Wortmannin blocked Akt phosphorylation at Thr-308, confirming that PI3K was inhibited. Hamartin and tuberin coexpression further repressed the activity of wild-type S6K1 in wortmannin-treated cells to a level comparable to that of cells treated with rapamycin. Wortmannin treatment completely blocked insulin-dependent activation of the F5A-ΔCT (rapamycin resistant) S6K1 mutant (Fig. 5), whereas hamartin and tuberin coexpression or rapamycin treatment had little or no effect (as shown in Fig. 3B). These data further support the model that tuberin-hamartin complexes repress mTOR-mediated signaling.
Figure 5.
Hamartin and tuberin inhibits S6K1 activity that is independent of PI3K signaling. HEK293E cells overexpressing wild-type or F5A-ΔCT S6K1 with or without hamartin (Ham) and tuberin (Tub) were serum-starved, pretreated with 20 nM rapamycin or 100 nM wortmannin for 30 min, and then stimulated with 100 nM insulin for 30 min, where indicated. Expression of hamartin and tuberin and the protein levels and extent of phosphorylation of Akt at Thr-308 were determined. S6K1 kinase assays were carried out as for Fig. 2. The graphs show the activity of S6K1 that is standardized to 1 for the insulin-stimulated sample for each of the S6K1 constructs.
Discussion
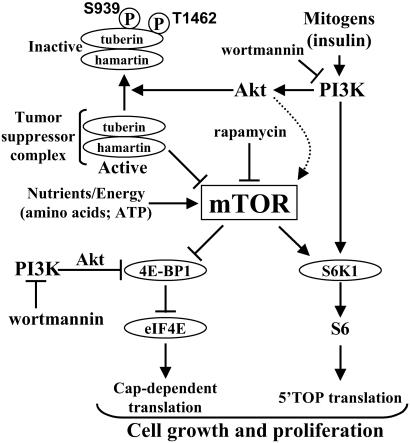
Here, we show that the tuberin-hamartin complex inhibits mTOR-mediated signaling to both 4E-BP1 and S6K1. We also show that the tuberin-hamartin complex not only impairs the insulin-dependent stimulation of S6K1 but also blocks the insulin-independent pathway. In all aspects of signaling to 4E-BP1 and S6K1 investigated, the tuberin-hamartin complex had similar effects to those of rapamycin, a known inhibitor of mTOR. On the basis of these results, we propose a model whereby hamartin and tuberin function to restrict mTOR-dependent signaling, either directly or indirectly. PI3K-dependent signaling, activated by mitogen treatment, results in the full phosphorylation and activation of S6K1 and the phosphorylation and inactivation of 4E-BP1 only if mTOR-dependent signaling is intact, as during nutritional and energetic sufficiency. Signaling through PI3K and Akt serves another important purpose, which is to phosphorylate tuberin (8) and inhibit the ability of the tuberin-hamartin complex to function as an mTOR suppressor. Thus, mTOR can only provide the permissive signal for S6K1 and 4E-BP1 phosphorylation during nutritional, energetic, and mitogenic sufficiency (see Fig. 6).
Figure 6.
Model showing that tuberin-hamartin complexes modulate PI3K-dependent signaling through mTOR to both 4E-BP1 and S6K1. Activation of PI3K leads to inactivation of the tuberin-hamartin complex by Akt-mediated phosphorylation of tuberin at Ser-939 and Thr-1462 (8). Inactivation of the tuberin-hamartin complex releases the inhibition of mTOR and allows nutrient-dependent signaling from mTOR to S6K1 and the 4E-BP1-eIF4E complex. As a result, cap-dependent and 5′terminal oligopyrimidine tract (5′-TOP) mRNA-mediated translation are increased. The dotted arrow depicts the finding that Akt phosphorylates mTOR (32).
The data we present suggests that hamartin and tuberin coexpression inhibits eIF4E. Overexpression of eIF4E results in cellular transformation (25, 26), and overexpression of 4E-BP1 blocks eIF4E-dependent transformation (25). We show that, unlike wild-type tuberin, a tuberin protein found in TSC patients (K599M) was impaired in its ability to repress 4E-BP1 phosphorylation (Fig. 2C). This result indicates that failure of the tuberin-hamartin complex to down-regulate 4E-BP1 phosphorylation could contribute physiologically to the human disease. Thus, a loss of normal eIF4E regulation may at least partially drive the expansion of TSC tumors resulting in the inappropriate expression of factors involved in cell growth and proliferation (27). Hamartin and tuberin coexpression also inhibit amino acid-mediated activation of S6K1 more potently than wortmannin, which implies that the tuberin-hamartin complexes also can inhibit the mTOR-dependent input to S6K1 activation independently of PI3K signaling.
Within mammalian cells, overexpression of either hamartin or tuberin leads to a delay in cell-cycle progression through the G1/S transition (28, 29). The presence of giant cells within hamartomas from TSC patients also highlights that these tuberin-hamartin complexes can restrict cellular growth. Recent work in Drosophila are concordant with the above mammalian data where inactivation of dTSC1 or dTSC2 increases both cell number and cell size (6, 7). Given the connection that we make between mTOR signaling and TSC, it is possible that the growth and proliferative inhibition mediated by the tuberin-hamartin complex is through suppression of mTOR-dependent signaling, which is abolished within TSC patient tumors. Consistent with this connection, recent work in both Drosophila and mammalian cells showed that mTOR signaling enhanced both cellular growth and the progression of cells through the G1/S transition (19, 30, 31). It seems likely that the failure to suppress mTOR signaling accounts for the increased growth seen in various tissues from TSC patients. Rapamycin, which is currently being tested in clinical trials as an anti-proliferative drug for cancer chemotherapy and restenosis, may, therefore, prove useful for the treatment of patients with TSC. The work presented here reveals that the downstream targets of mTOR, 4E-BP1/eIF4E and S6K1, could be important targets for the design of therapeutic drugs to treat tuberous sclerosis.
Acknowledgments
We thank the Tuberous Sclerosis (TS) Alliance and The Rothberg Courage Fund. This work was supported by National Institutes of Health Grants GM51405 (to J.B.), and GM56203 and GM41890 (to L.C.C.), and by the TS Alliance (to J.B., L.C.C., and D.J.K.). A postdoctoral fellowship was supported by the American Cancer Society (for B.D.M.) and by the TS Alliance (for D.C.F.).
Abbreviations
- mTOR
mammalian target of rapamycin
- TSC
tuberous sclerosis complex
- PI3K
phosphoinositide-3-kinase
- S6K1
ribosomal protein S6 kinase 1
- 4E-BP1
eIF4E-binding protein
- HEK
human embryonic kidney
- HA
hemagglutinin
References
- 1.Gomez E R, Sampson J R, Whittemore V H. Developmental Perspectives in Psychiatry. Oxford: Oxford Univ. Press; 1999. [Google Scholar]
- 2.Green A J, Smith M, Yates J R. Nat Genet. 1994;6:193–196. doi: 10.1038/ng0294-193. [DOI] [PubMed] [Google Scholar]
- 3.Green A J, Johnson P H, Yates J R. Hum Mol Genet. 1994;3:1833–1834. doi: 10.1093/hmg/3.10.1833. [DOI] [PubMed] [Google Scholar]
- 4.Plank T L, Yeung R S, Henske E P. Cancer Res. 1998;58:4766–4770. [PubMed] [Google Scholar]
- 5.van Slegtenhorst M, Nellist M, Nagelkerken B, Cheadle J, Snell R, van den Ouweland A, Reuser A, Sampson J, Halley D, van der Sluijs P. Hum Mol Genet. 1998;7:1053–1957. doi: 10.1093/hmg/7.6.1053. [DOI] [PubMed] [Google Scholar]
- 6.Potter C J, Huang H, Xu T. Cell. 2001;105:357–368. doi: 10.1016/s0092-8674(01)00333-6. [DOI] [PubMed] [Google Scholar]
- 7.Gao X, Pan D. Genes Dev. 2001;15:1383–1392. doi: 10.1101/gad.901101. [DOI] [PMC free article] [PubMed] [Google Scholar]
- 8.Manning B D, Tee A R, Logsdon N M, Blenis J, Cantley L C. Mol Cell. 2002;10:151–162. doi: 10.1016/s1097-2765(02)00568-3. [DOI] [PubMed] [Google Scholar]
- 9. Goncharova, E. A., Goncharov, D. A., Eszterhas, A., Hunter, D. S., Glassberg, M. K., Yeung, R. S., Walker, C. L., Noonan, D., Kwiatkowski, D. J., Chou, M. M., et al. (2002) J. Biol. Chem.277, in press. [DOI] [PubMed]
- 10.Kwiatkowski D J, Zhang H, Bandura J L, Heiberger K M, Glogauer M, el-Hashemite N, Onda H. Hum Mol Genet. 2002;11:525–534. doi: 10.1093/hmg/11.5.525. [DOI] [PubMed] [Google Scholar]
- 11.Sanchez-Margalet V, Goldfine I D, Vlahos C J, Sung C K. Biochem Biophys Res Commun. 1994;204:446–452. doi: 10.1006/bbrc.1994.2480. [DOI] [PubMed] [Google Scholar]
- 12.Chung J, Kuo C J, Crabtree G R, Blenis J. Cell. 1992;69:1227–1236. doi: 10.1016/0092-8674(92)90643-q. [DOI] [PubMed] [Google Scholar]
- 13. Martin, K. A. & Blenis, J. (2002) Adv. Cancer Res.86, in press. [DOI] [PubMed]
- 14.Gingras A C, Raught B, Sonenberg N. Genes Dev. 2001;15:807–826. doi: 10.1101/gad.887201. [DOI] [PubMed] [Google Scholar]
- 15.Proud C G, Wang X, Patel J V, Campbell L E, Kleijn M, Li W, Browne G J. Biochem Soc Trans. 2001;29:541–547. doi: 10.1042/bst0290541. [DOI] [PubMed] [Google Scholar]
- 16.Dennis P B, Jaeschke A, Saitoh M, Fowler B, Kozma S C, Thomas G. Science. 2001;294:1102–1105. doi: 10.1126/science.1063518. [DOI] [PubMed] [Google Scholar]
- 17.Schmelzle T, Hall M N. Cell. 2000;103:253–262. doi: 10.1016/s0092-8674(00)00117-3. [DOI] [PubMed] [Google Scholar]
- 18.Schalm S S, Blenis J. Curr Biol. 2002;12:632–639. doi: 10.1016/s0960-9822(02)00762-5. [DOI] [PubMed] [Google Scholar]
- 19.Fingar D C, Salama S, Tsou C, Harlow E, Blenis J. Genes Dev. 2002;16:1472–1487. doi: 10.1101/gad.995802. [DOI] [PMC free article] [PubMed] [Google Scholar]
- 20.Richards S A, Fu J, Romanelli A, Shimamura A, Blenis J. Curr Biol. 1999;9:810–820. doi: 10.1016/s0960-9822(99)80364-9. [DOI] [PubMed] [Google Scholar]
- 21.Martin K A, Schalm S S, Richardson C, Romanelli A, Keon K L, Blenis J. J Biol Chem. 2001;276:7884–7891. doi: 10.1074/jbc.M006969200. [DOI] [PubMed] [Google Scholar]
- 22.Nellist M, Verhaaf B, Goedbloed M A, Reuser A J, van den Ouweland A M, Halley D J. Hum Mol Genet. 2001;10:2889–2898. doi: 10.1093/hmg/10.25.2889. [DOI] [PubMed] [Google Scholar]
- 23.Hara K, Yonezawa K, Weng Q P, Kozlowski M T, Belham C, Avruch J. J Biol Chem. 1998;273:14484–14494. doi: 10.1074/jbc.273.23.14484. [DOI] [PubMed] [Google Scholar]
- 24.Iiboshi Y, Papst P J, Kawasome H, Hosoi H, Abraham R T, Houghton P J, Terada N. J Biol Chem. 1999;274:1092–1099. doi: 10.1074/jbc.274.2.1092. [DOI] [PubMed] [Google Scholar]
- 25.Rousseau D, Gingras A C, Pause A, Sonenberg N. Oncogene. 1996;13:2415–2420. [PubMed] [Google Scholar]
- 26.Lazaris-Karatzas A, Montine K S, Sonenberg N. Nature (London) 1990;345:544–547. doi: 10.1038/345544a0. [DOI] [PubMed] [Google Scholar]
- 27.Sonenberg N, Gingras A C. Curr Opin Cell Biol. 1998;10:268–275. doi: 10.1016/s0955-0674(98)80150-6. [DOI] [PubMed] [Google Scholar]
- 28.Miloloza A, Rosner M, Nellist M, Halley D, Bernaschek G, Hengstschlager M. Hum Mol Genet. 2000;9:1721–1727. doi: 10.1093/hmg/9.12.1721. [DOI] [PubMed] [Google Scholar]
- 29.Soucek T, Pusch O, Wienecke R, DeClue J E, Hengstschlager M. J Biol Chem. 1997;272:29301–29308. doi: 10.1074/jbc.272.46.29301. [DOI] [PubMed] [Google Scholar]
- 30.Zhang H, Stallock J P, Ng J C, Reinhard C, Neufeld T P. Genes Dev. 2000;14:2712–2724. doi: 10.1101/gad.835000. [DOI] [PMC free article] [PubMed] [Google Scholar]
- 31.Oldham S, Montagne J, Radimerski T, Thomas G, Hafen E. Genes Dev. 2000;14:2689–2694. doi: 10.1101/gad.845700. [DOI] [PMC free article] [PubMed] [Google Scholar]
- 32.Scott P H, Lawrence J C., Jr J Biol Chem. 1998;273:34496–34501. doi: 10.1074/jbc.273.51.34496. [DOI] [PubMed] [Google Scholar]


