

Abstract
A critical issue in brain energy metabolism is whether lactate produced within the brain by astrocytes is taken up and metabolized by neurons upon activation. Although there is ample evidence that neurons can efficiently use lactate as an energy substrate, at least in vitro, few experimental data exist to indicate that it is indeed the case in vivo. To address this question, we used a modeling approach to determine which mechanisms are necessary to explain typical brain lactate kinetics observed upon activation. On the basis of a previously validated model that takes into account the compartmentalization of energy metabolism, we developed a mathematical model of brain lactate kinetics, which was applied to published data describing the changes in extracellular lactate levels upon activation. Results show that the initial dip in the extracellular lactate concentration observed at the onset of stimulation can only be satisfactorily explained by a rapid uptake within an intraparenchymal cellular compartment. In contrast, neither blood flow increase, nor extracellular pH variation can be major causes of the lactate initial dip, whereas tissue lactate diffusion only tends to reduce its amplitude. The kinetic properties of monocarboxylate transporter isoforms strongly suggest that neurons represent the most likely compartment for activation-induced lactate uptake and that neuronal lactate utilization occurring early after activation onset is responsible for the initial dip in brain lactate levels observed in both animals and humans.
Keywords: astrocyte-neuron lactate shuttle, brain energy metabolism, mathematical model, monocarboxylate transporter
Brain energy metabolism is considered nearly fully aerobic (1), with glucose as the major energy substrate of neurons, at rest and during activation. Some observations, however, made with functional brain imaging methods challenged this classical view. Fox and Raichle (2) observed a mismatch between the increases in cerebral metabolic rate of glucose and the relatively smaller increase in cerebral metabolic rate of O2 during somatosensory and visual activations. As a consequence, it was postulated that brain activation can lead to a disproportionate stimulation of glycolysis despite the presence of sufficient oxygen levels. This hypothesis was substantiated by the finding that an increase in lactate levels within the activated area is obtained under different stimulation paradigms and modalities (3-6). As a consequence, one of the critical issues in brain energy metabolism concerns our understanding of brain lactate metabolism and especially its compartmentalization between neurons and astrocytes (7-9). Interpretation of lactate kinetics in terms of cellular production, utilization, or disposal remains complex. For instance, Hu and Wilson (10) found an initial dip of extracellular lactate concentration in the rat hippocampus, and an early decrease in tissue lactate was recently reported by Mangia et al. (11) using 1H magnetic resonance spectroscopy. This initial lactate dip was interpreted by Hu and Wilson as a consequence of lactate consumption by neurons, a view that was challenged by Mangia et al. The difficulty in interpreting such kinetics lies in its dependence on various physiological factors. Therefore, it seems important to make a synthesis from the various lactate kinetics data and identify the different possible physiological determinants for lactate kinetics. The aim of this work was to quantify the contribution of various physiological mechanisms to brain lactate kinetics. This quantification relies on a review of experimental data and a mathematical model of lactate exchanges, based on a previously validated model of compartmentalized energy metabolism (12). Our modeling approach takes into account all mechanisms that are known to determine extracellular lactate concentration and includes a systematic study of the effect of changing these parameters. Specifically, we studied the effect of cellular production or consumption, regional cerebral blood flow (CBF), exchanges through the blood-brain barrier (BBB) and extracellular pH variation, which in turn can affect BBB exchanges. Focusing on the question of the initial dip of the extracellular or tissue lactate concentration, we show that it cannot be satisfactorily explained either by an early increase in CBF or pH variations; furthermore, tissue lactate diffusion could only reduce the amplitude of this dip. Thus, we conclude that the lactate initial dip is a consequence of an increased lactate consumption by some cells or a decrease of lactate production during the first 10-20 s of stimulation. An analysis of magnetic resonance spectroscopy data shows that the latter hypothesis is quite unlikely, so that cell lactate consumption must occur at the beginning of the stimulation. Moreover, based on the kinetic properties of the various isoforms of monocarboxylate transporters (MCTs), we show that neurons are better candidates than astrocytes to be these early lactate-consuming cells. Thus, the presence of an initial lactate dip strongly suggests that lactate consumption by neurons occurs from the very start of stimulation.
Description of the Model
Model of Lactate Kinetics. The present model is designed to allow a rigorous and systematic reasoning on extracellular lactate kinetics, so it is intentionally reduced to those elements that are central to this reasoning: (i) production or uptake by cells, (ii) exchange through the BBB, (iii) diffusion of lactate through the tissue, and (iv) pH variations. Extracellular and capillary lactate concentrations are expressed in mM and denoted as LACe and LACc, respectively. Volumes and blood flow values are expressed per unit tissue volume. Thus, Vc and Ve are the dimensionless capillary and extracellular space volume fraction, respectively, and the capillary blood flow CBF(t) is expressed in s-1. The subscript 0 refers to baseline steady-state values. The equation set is based on elements of our previously developed models (12, 13).
Mass balance of extracellular and capillary lactate leads to the following system of differential equations:
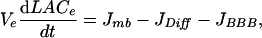 |
[1] |
 |
[2] |
where Jmb is the difference between lactate release by some cells (astrocytes or neurons) and lactate uptake by other cells (neurons or astrocytes), JDiff is the flux of diffusion of lactate through the extracellular space, JBBB is the rate of lactate transport through the BBB, and JCap is the blood flow contribution to capillary lactate variation. All of these rates are expressed in mmol per s per unit tissue volume (in liters). Contribution of sensor to lactate fluxes and the influence of lactate diffusion coefficient can be neglected (see Supporting Text, which is published as supporting information on the PNAS web site, for details).
Neural tissue contribution. In a simple approach, diffusion of lactate through the extracellular space could be described as an exchange between the stimulated region, with lactate concentration LACe, and remote brain regions, with concentration LACe,0. The flux of diffusion from the stimulated region toward the remote regions, as a first approximation, will be proportional to De(LACe - LACe,0), De being the extracellular diffusion coefficient of lactate. We can thus write JDiff as β1(LACe - LACe,0), β1 being a positive constant. The Jmb term obviously depends on LACe, so we write Jmb as β2(LACe,0 - LACe) + J(t), where J(t) is an input function that includes all phenomena that are not explicitly taken into account in Eq. 1, namely the variation of intracellular lactate and pH gradient across cell membranes. Especially, cellular lactate production, as well as intracellular diffusion of lactate, can contribute to lactate kinetics only by intracellular lactate concentration, so that their possible effect is included in the input function J(t). Setting β = β1 + β2, we can write the total tissue contribution to extracellular lactate variation as:
 |
[3] |
We have investigated alternative hypotheses for the input term J(t), especially:
(J1) Based on the results of our previous model (12), we assumed that J(t) first decreases below the baseline value J0, then increases above the baseline, so that we set:
 |
[4] |
and J(t) linearly increases for ti ≤ t ≤ ti + tJ and linearly decreases for tend ≤ t ≤ tend + tJ. The constants αJi and αJ represent the J(t) decrease (at the stimulation onset) and increase fractions, respectively.
(J2) J(t) is constant from 0 ≤ t ≤ ti, namely αJi = 0. Thus the increase in J(t) is only delayed with regard to the CBF increase.
Brain-blood transport of lactate. We have considered various hypotheses:
(H1) Lactate is supposed to leave the extracellular space through the BBB by means of a facilitated passive transport of Michaelis-Menten type (14):
 |
[5] |
where Tmax and Kt are, respectively, the maximum transport rate and Michaelis constant (12, 13).
(H2) We took into account the effect of extracellular and capillary H+ ion concentrations on lactate transport through the BBB by setting:
 |
[6] |
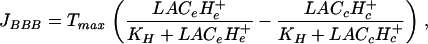
where KH is a constant expressed in mM2. This formula is a simplified version of a more general equation for carrier-mediated symport (15). H+e and H+c, the extracellular and capillary proton concentrations respectively, are taken as input terms.
Based on data from the literature about extracellular pH variations, we considered the following hypotheses:
Alk-acid: To describe the experimental data of many authors, for instance (16, 17), consisting of an extracellular alkalinization followed by an acidification, we set:
 |
[7] |
Acid: Because other data (17) only show an acidification, preceded by a small delay td, we also tested the following equation:
 |
[8] |
with pHe remaining at its baseline value pHe,0 for 0 ≤ t < td.
Because of the lack of reliable data about capillary pH variation, we tested in each case two extreme hypotheses: either capillary pH remains constant or its kinetics follows that of extracellular pH.
Blood flow through capillaries. The CBF through capillaries, CBF(t), is an input function, based on the model of Buxton et al. (18) and magnetic resonance data, namely
 |
[9] |
while CBF(t) linearly increases for 0 < t < tF and decreases for tend ≤ t ≤ tend + tF.
Blood flow contribution to LACc variation. The CBF contribution to capillary concentration changes is given by JCap = CBF(t) (LACa - LACv), where LACa and LACv are the arterial and venous lactate concentrations, respectively. Based on our preceding models (12, 13), we write:
 |
[10] |
A similar equation was already put forward by Gjedde (19) for oxygen. In a preceding study, we showed that this simple formulation is nearly equivalent to more complex ones, based on partial differential equations (20).
Model of Neuronal and Astrocytic Membrane Lactate-H+ Cotransport. To investigate which cells, neurons or astrocytes, are more likely to consume or produce lactate under various circumstances, the transmembrane flux of lactate via MCTs was described by using the following equation:
 |
[11] |
where LACi and H+i are the intracellular lactate and hydrogen ion concentrations, respectively; Tmax,ie is the maximal transport rate through the cell membrane; and KHie is the product of the Michaelis constant by a mean H+ concentration, namely KHie = Kt·10-4.3. We computed Jmb/Tmax,ie as a function of the intracellular lactate concentration LACi, in two cases: low Kt (neurons) or higher Kt (astrocytes).
Results
Typical Simulations and Comparison to Experimental Data. In this section, we compare typical results obtained by using our model to the experimental data of Hu and Wilson (10), which are displayed in Figs. 1A and 2A. Using an enzyme-based lactate microsensor, Hu and Wilson measured in vivo, with high temporal resolution, extracellular lactate levels in the dentate gyrus of the rat hippocampus, after a 5-s electrical stimulation of the perforant pathway.
Fig. 1.

Changes of extracellular lactate concentration on a single stimulation. (A) Experimental data. Extracellular lactate concentration, measured by Hu and Wilson (10) in rat brain hippocampus, after a 5-s electrical stimulation of the perforant pathway. [Reproduced with permission from ref. 10 (Copyright 1997, Blackwell, Oxford).] (B) Typical simulation of extracellular lactate (LACe) changes as a function of time in the case of a sustained activation with a 70-s blood flow (CBF) increase. According to hypothesis J1, because of the cellular contribution J(t), JTissue first decreases for 0 < t < 18 s, then increases for 18 s < t < 70 s. (C) Simulated rates. Temporal evolution of JTissue, JBBB, and JCap. LACe is expressed as percent of LACe,0, the basal extracellular lactate concentration. Parameter values (14, 18, 19, 22) are Ve = 0.2, Vc = 0.0055, β = 0.001 s-1, J0 = 0.001 mM·s-1, Tmax = 0.0061 mM·s-1, Kt = 3.5 mM (hypothesis H1), CBF0 = 0.01 s-1, and LACa = 0.3 mM, so that at steady-state values for lactate are LACe = 1.19 mM, LACc = 0.35 mM. Stimulation parameter values are αF = 0.8, tF = 5s, αJi = -0.8, ti = 18 s, αJ = 4.73, tJ = 5s, and tend = 70 s.
Fig. 2.

Changes of extracellular lactate concentration on repetitive stimulation. (A) Experimental data. Measured variation in extracellular lactate concentration, obtained by Hu and Wilson (10) in rat brain hippocampus, during a sequence of 5-s electrical stimulations of the perforant pathway with 2-min rest intervals. [Reproduced with permission from ref. 10 (Copyright 1997, Blackwell, Oxford).] (B) Typical simulation of extracellular lactate (LACe) changes as a function of time in the case of a repetitive activation. All parameters are the same as in Fig. 1, except that αJi = -1.5 and αJ = 3.85, to match the amplitude of the first initial dip reported by Hu and Wilson (10). (C) Simulated rates. Note the time evolution of the initial dip of JTissue.
Unique activation. Fig. 1B shows a typical simulation of extracellular lactate changes as a function of time with a 70-s CBF increase, which was chosen to match the duration of the increased oxygen supply, as reflected by measured pO2 [figure 5 in Hu and Wilson's paper (21)]. Extracellular lactate concentration (LACe) increases, with a peak at 177% of its baseline value 73 s after stimulation onset, and a time constant for LACe relaxation of ≈247 s, which is in good agreement with the values published by Hu and Wilson, i.e., ≈230 s (10). Most importantly, we could reproduce the LACe initial dip at stimulation onset (for 0 ≤ t ≤ 23 s) as reported by Hu and Wilson. It must be emphasized that in this stimulation, cellular contribution J(t) first decreases (for 0 ≤ t ≤ 18 s), then increases (for 18 s ≤ t ≤ 70 s), which causes a similar variation of JTissue. This initial decrease of J(t) is essential to obtain a significant initial dip, as discussed below.
Repetitive activation. Fig. 2B shows a typical simulation of extracellular lactate changes as a function of time obtained with a repetitive activation consisting of 10 cycles, Eqs. 1-5 being applied to each cycle. The duration of the CBF increase in the simulation was chosen on the basis of the duration of the increased oxygen supply, as reflected by pO2 measured by Hu and Wilson (figure 2 in ref. 10). Sustained elevation of lactate levels up to a maximum level of 206% was obtained, close to the reported experimental 204% value (Fig. 2 A). Moreover, at each new stimulation, a dip in lactate concentration was observed, the amplitude of which increased with repeated stimulations from 10.5% up to 24.5% of the baseline value.
Robustness of the Model. To test the robustness of these results, we studied the effect of independent modifications of each of the main parameters, over a wide range, on the LACe time course (some of the results being displayed in Table 1). Note that parameters J0, Tmax, Kt, CBF0, LACa, and β result in various values of LACe,0 and dip amplitude. It must be emphasized that the CBF increase fraction αF has nearly no effect on the initial dip, but the initial decrease of lactate production by cells and/or increase in lactate uptake, αJi, has a dramatic effect.
Table 1. Effect of parameter values on the extracellular lactate (LACe) kinetics.
| Initial dip, % of baseline
|
||||||
|---|---|---|---|---|---|---|
| Parameter | LACe,0, mM | αJi = −0.8 αF = 0.8 | αJi = 0 αF = 0.8 | αJi = −0.8 αF = 0 | Peak, % of baseline | τdecrease, S |
| Values of Fig. 1A | 1.19 | 5.7 | 0.2 | 5.5 | 177 | 247 |
| 0.0005 < J0 < 0.0015 mM·s−1 | 0.7−1.81 | 4.6−5.4 | 0.2−0.2 | 4.6−5.3 | 164−178 | 191−334 |
| 0.004 < Tmax < 0.01 mM·s−1 | 1.81−0.83 | 3.6−8 | 0.1−0.4 | 3.4−7.6 | 153−202 | 476−135 |
| 2 < Kt < 5 mM | 0.91−1.48 | 7.4−4.5 | 0.4−0.1 | 6.8−4.3 | 197−164 | 184−318 |
| 0.008 < CBF0 < 0.012 s−1 | 1.21−1.18 | 5.6−5.6 | 0.2−0.1 | 5.2−5.3 | 175−178 | 253−245 |
| 0.3 < LACa < 0.96 mM | 1.19−2.21 | 5.7−3.0 | 0.2−0.1 | 5.5−2.9 | 177−142 | 247−358 |
| 0.0005 < β < 0.0015 s−1 | 1.19−1.19 | 5.7−5.4 | 0.2−0.2 | 5.4−5.2 | 181−173 | 248−245 |
Conditions Necessary to Observe an Initial Dip of Extracellular Lactate Concentration. Unique activation. If we consider Eq. 1, we see that the initial dip can only be caused by a decrease in JTissue = Jmb - JDiff = J(t) + β(LACe,0 - LACe), or an increase in JBBB, or both. Because LACe is lower than its resting value, we can note that a possible increase in JBBB can only be caused by a decrease in LACc, which in turn must be caused by the CBF increase. To obtain an initial dip comparable to the data of Hu and Wilson (10), i.e., a maximal decrease in LACe of ≈0.07 mM at 18 s, JBBB must be increased by a factor of 4. If CBF was dramatically increased, LACc would be nearly equal to arterial lactate concentration, a low value of which is LACa = 0.3 mM. Then a simple calculation shows that JBBB is multiplied by no more than 1.08. Even if we consider LACc = 0 mM, JBBB is only multiplied by a factor 1.56. Thus, the lactate wash-out through the BBB, caused by CBF increase, cannot be the main contributing factor to the LACe initial dip. Conversely, the findings of the current study support the claim that the initial LACe dip originates in a decrease in JTissue below its baseline value at stimulation onset. Furthermore, the existence of the initial dip can only be caused by a decrease in the cell contribution term J(t), because the decrease in LACe below its baseline value makes the term β(LACe,0 - LACe) positive. The importance of this initial decrease of cellular contribution can be seen in Table 1 by comparing the columns αJi = -0.8 and αJi = 0, which emphasizes the role of an increase in cell lactate consumption or a reduction of cell lactate production.
Repetitive activation. In Hu and Wilson's paper (10) repetitive activation induces a progressive increase of the initial dip compared with the preceding cycle. We investigated the origin, tissular or hemodynamic, of this increase in lactate dip amplitude. In the case of a repetitive activation, the first initial dip is caused by the initial undershoot of Jmb, as previously discussed. When the extracellular lactate concentration increases, the situation becomes more complex, because JBBB and the -β(LACe,0 - LACe) term, which reflects the effect of extracellular lactate concentration both on extracellular diffusion and cell membrane transport of lactate, are enhanced because of the high level of LACe. For instance, in the case of the last initial dip in Fig. 2B, the amplitude of which is 24.5% of the lactate baseline value, about half of this amplitude is caused by the initial dip in JTissue, the remaining part being caused by JBBB. Therefore, the increase in amplitude of the initial dip under repetitive stimulations can be caused by increased consumption by cell, diffusion, and lactate washout by CBF.
Influence of pH Variation. Because pH changes can modify lactate exchanges by modifying the rate of the lactate-proton symport through the BBB, we replaced hypothesis H1 with hypothesis H2, i.e., we took into account the effect of H+ concentrations. Parameter values were carefully chosen to match experimental data, especially those published by Xiong and Stringer (17). Obviously, any extracellular acidification will increase the JBBB term, and thus will tend to favor the extracellular lactate dip, whereas capillary acidification will not favor the dip. The main findings are summarized in Fig. 3, taking into account various hypotheses for extracellular pH variation as described in Eqs. 7 or 8. First, if extracellular acidification only occurs (Fig. 3B Left), the extracellular lactate dip is slightly increased (at most 6% of the baseline value instead of 5.7%). Second, an initial extracellular alkalinization reduces the initial dip from 5.7% to 5.2%.
Fig. 3.

Effect of pH variations on lactate levels. (A) Effect of pH variation on LACe time course in the case of a unique activation (hypothesis H2). The effect of extracellular and capillary H+ ion concentrations on blood-brain transport of lactate are taken into account by using Eq. 6 instead of Eq. 5. Parameter values are KH = 3.5 × 10-4.3 mM2, pHe,0 = 7.3, and pHc,0 = 7.38. Stimulation parameters are A1 = 0.164, A2 = 0.114, A3 = 0.025, τ1 = 10.7 s, τ2 = 15.4 s, τ3 = 21 s, and td = 12.75 s. All other parameter values are the same as in Fig. 1. (B) Extracellular and capillary pH time courses (pHe and pHc). (Left) Acid case: pHe undergoes an acidification (17), whereas pHc either decreases (dashed line) or remains constant (dotted line). (Right) Alk-acid case: pHe undergoes an alkalinization followed by an acidification (16, 17), whereas pHc either follows pHe evolution (dashed line) or remains constant (dotted line). (C) Corresponding time evolution of extracellular lactate, in the acid case (Left) and the alk-acid case (Right). Solid line indicates no pH variation (hypothesis H1); dashed line indicates that both pHe and pHc vary, according to B Left or B Right, respectively; dotted line indicates only pHe varies, according to B Left or B Right, respectively.
Neuronal and Astrocytic Lactate-H+ Cotransport. The characteristics of the intraparenchymal cells make them more or less likely to take up or produce lactate during activation. To determine which cell type, namely neurons or astrocytes, is more likely to consume lactate, we assumed that lactate transport via MCTs through the cell membrane can be defined by Eq. 11. In these conditions (Fig. 4), the astrocytic capacity to consume lactate when intracellular lactate is decreased appears to be low compared with neurons, for instance, even if intracellular lactate equals 0, Jmb only reaches -0.25·Tmax,ie, while it reaches -0.63·Tmax,ie for neurons. Conversely, astrocytes are more likely to secrete lactate in the interstitial space than neurons with increasing intracellular concentration.
Fig. 4.

The ratio between the transmembrane flux of lactate via MCTs (Jmb) and the maximal transport rate through the cell membrane (Tmax,ie) as a function of the intracellular lactate concentration (LACi), in two cases: (i) Kt = 0.7 mM for neurons (thin solid line), and (ii) Kt = 3.5 mM for astrocytes (thick solid line). Lactate transport via MCTs through cellular membrane is defined by Eq. 11. Other parameter values are LACe = 1.19 mM, H+i = 10-4.1 mM, H+e = 10-4.3 mM (which corresponds to an equilibrium value of 0.75 mM for intracellular lactate).
Discussion
The possibility that intraparenchymally formed lactate could act as a significant energy substrate for neurons has been substantiated by a number of in vitro, ex vivo, and in vivo observations (for review, see ref. 23). Nevertheless, a clear description of brain lactate kinetics has become essential for defining its key role in neuroenergetics. Some attempts have been made in the past to provide a better description of brain lactate kinetics. Kuhr and colleagues (24) developed a model to interpret their measurements of extracellular, arterial, and venous lactate in rats in vivo, under various conditions. Although their model does not include the BBB, their data suggest that lactate clearance from brain tissue by the bloodstream plays only a minor role, whereas most tissue lactate would be recycled to pyruvate. More recently, Leegsma-Vogt and colleagues (25) developed a model of arteriovenous lactate differences that is in favor of brain lactate utilization as an energy substrate. Finally, on the basis of a previous model describing the relationships between brain electrical activity, energy metabolism, and hemodynamics (13), some of us developed a model of compartmentalized energy metabolism between neurons and astrocytes (12). This theoretical study suggested that the following mechanisms could occur, at least during the initial 10-20 s of a sustained stimulation: (i) at the beginning of the stimulation, neurons would undergo an increased mitochondrial activity that would consume lactate, part of which would be supplied by the extracellular pool, and (ii) intracellular astrocytic lactate levels may slightly decrease because of lactate consumption by neurons, but this phenomenon would be progressively overwhelmed by the stimulation of astrocytic glycolysis. Glycolysis would result in a delayed increase in astrocytic NADH, a suggestion that is fully consistent with the NADH fluorescence data of Kasischke et al. (26). The next step, presented in this article, was to determine whether the purported neuronal lactate consumption is necessary to explain experimental lactate kinetics.
A Comprehensive Description of Brain Lactate Kinetics Requires Enhanced Lactate Consumption upon Activation. By taking parameter values consistent with brain data for humans or animals, we were able to simulate extracellular lactate time courses that compared rather remarkably with the experimental data of Hu and Wilson (10) obtained in the rat hippocampus, by using rapid-response lactate sensor during both sustained and repetitive stimulations of the perforant pathway. Our analysis shows that CBF increase cannot explain the lactate initial dip in the case of a unique stimulation. Furthermore, CBF increase cannot entirely account for the increased amplitude of lactate dips occurring upon repetitive stimulations, which could also be caused by cell uptake and tissue diffusion. Second, we investigated the effect of pH variations on lactate kinetics. Indeed, because of the lactate/proton cotransport, an acidification of extracellular space would favor proton outflow through the BBB whereas an alkalinization would have the opposite effect. According to the recent review by Chesler (27), stimulated activity, seizure, or spreading depression are generally associated with an initial interstitial alkaline shift followed by an acidosis that can persist for minutes. These facts would indicate that pH transients are a poor candidate for the lactate initial dip. However, in some instances, the initial alkalinization is absent. To complete our interpretation of the data of Hu and Wilson (10) in the hippocampus, we incorporated in our model the extracellular pH data of Xiong and Stringer (17). Those authors found either an alkalinization followed by an acidification, in the CA1 area after Schaffer collaterals' stimulation, or a delayed acidification in the dentate gyrus after stimulation of the perforant path. Furthermore, we assumed that capillary pH is not decreased, which is an extreme case that favors proton outflow through the BBB. In any case, our results show that only a small contribution of pH variation may occur (Fig. 3), but cannot be sufficient to explain the initial dip. Thus, using a reductio ad absurdum-like approach, our results strongly indicate that the lactate initial dip has mainly a metabolic origin, at least when the lactate level is below its baseline value, being caused by either an increase in lactate consumption by some cells, a decrease in lactate production by other cells, or both. If we assume that the main phenomenon is a decrease in lactate production relative to its baseline value, we can estimate an order of magnitude of this decrease, based on the magnetic resonance spectroscopy data of Mangia et al. (11), in which tissue lactate is decreased by ≈40% within 5 s. Assuming a tissue lactate concentration of ≈1 mM, it would correspond to a decrease in lactate production of ≈0.08 mM·s-1. Such calculations lead to the implausible conclusion that resting metabolism would be fairly high and entirely anaerobic. Therefore, we can conclude that an increase in cellular lactate consumption by certain cells remains the only possible mechanism to explain most of the lactate initial dip. We can note that extracellular lactate diffusion is not a mechanism that can underlie the first initial dip of lactate, because it can only induce the opposite effect, namely a limitation of the decrease in extracellular lactate concentration.
As pointed out above, the most likely explanation for the observed lactate kinetics upon stimulation is enhanced lactate uptake by some cells followed by enhanced production by others (although it does not exclude that these two processes can overlap over a certain period). Previous studies performed on cultured cells had indicated that among brain cells neurons can take up and use lactate as an oxidative substrate (28) whereas astrocytes constitutively produce large amounts of lactate (29). More recently, it was shown that lactate represents a preferential oxidative substrate over glucose for neurons (30, 31). In contrast, it was not the case for astrocytes that rather displayed a substantial glycolytic metabolism with lactate production (31). The distribution of MCTs that are involved in lactate transport is also consistent with the metabolic preference of each cell type. It was found that astrocytes express MCT1 and MCT4 whereas neurons contain MCT2 (32). Our analysis clearly indicates that the subtype of MCT expressed by each cell type would favor either export or import of lactate as a function of its metabolic preference. Thus, in the case of increased glycolytic activity, astrocytes are better equipped to release lactate as their intracellular concentration increases. In contrast, neurons would more efficiently take up lactate than astrocytes with increased oxidation and a drop in their intracellular lactate concentration. Altogether, these observations strongly suggest that early lactate-consuming cells are neurons whereas late producers would be astrocytes. Finally, to estimate the contribution of lactate (vs. glucose) to neuronal extra pyruvate supply, we carried out a determination of glucose fluxes based on a similar model (see Supporting Text and Figs. 5 and 6, which are published as supporting information on the PNAS web site, for details). Results show that lactate uptake contribution would be comprised between 29% and 60% of the additional pyruvate supply to neurons. It is thus clear that lactate uptake by neurons represents a significant contribution to neuroenergetics upon activation.
Concordance Between the Proposed Description of Brain Lactate Kinetics and Other Related Aspects of Brain Energy Metabolism. The description of brain lactate kinetics obtained with our modeling approach is consistent with several observations and previous models describing different aspects of brain energy metabolism. First, it was previously shown that NADH levels in neural tissue vary in a biphasic manner upon stimulation (33). In addition, Kasischke and coworkers (26) have demonstrated that the initial dip in NADH occurs in dendrites of neurons, whereas the late peak takes place in astrocytes. Because it is well known that the lactate/pyruvate ratio critically depends on the NADH/NAD+ ratio (34), the present description of a biphasic change in extracellular lactate concentration upon activation that reflects both an increased consumption by neurons and production by astrocytes would be entirely consistent with this view. Moreover, a recent modeling of brain energy metabolism that takes into account a metabolic compartmentalization between neurons and astrocytes provides a coherent framework to explain the biphasic behavior of both the NADH/NAD+ ratio and extracellular lactate concentration (12). A physiological mechanism to explain the differential activation of glycolysis in astrocytes and oxidative metabolism in neurons has been proposed previously and is known as the astrocyte-neuron lactate shuttle (7, 9). Our analysis of lactate kinetics supports this model as it further emphasizes the necessity of cellular lactate consumption early upon activation followed by distinct cellular lactate production later on. The fact that neurons are predicted to be the lactateconsuming cells whereas astrocytes would be the lactate producers is in agreement with the main tenets of this model. Furthermore, recent observations made in vivo suggest that indeed lactate production by non-neuronal cells (presumably astrocytes) increases with enhanced glutamatergic activation, whereas consumption of lactate by neurons (at the expense of glucose) also increases (35). Thus, our description of brain lactate kinetics provides a unifying framework to explain a number of in vitro, ex vivo, and in vivo data.
Supplementary Material
Acknowledgments
We thank Dr. Karl A. Kasischke for stimulating discussions and supplying us with raw data; two referees for useful comments; and Julia Parafita and Marie Evo for their help. This work was supported by the Fondation pour la Recherche Médicale (A.A.), the Action Concertée Incitative “Neurosciences Intégratives et Computationnelles” (French Ministry of Research) (R.C.), and Swiss Fonds National de la Recherche Scientifique Grants 31-00A0-100679 (to L.P.) and 31-56930-99 (to P.J.M.).
Author contributions: A.A., R.C., P.J.M., and L.P. designed research; A.A. and R.C. performed research; A.A. and R.C. contributed new reagents/analytic tools; A.A., R.C., and L.P. analyzed data; and A.A., R.C., P.J.M., and L.P. wrote the paper.
Conflict of interest statement: No conflicts declared.
This paper was submitted directly (Track II) to the PNAS office.
Abbreviations: CBF, cerebral blood flow; BBB, blood-brain barrier; MCT, monocarboxylate transporter.
References
- 1.Siesjö, B. K. (1978) Brain Energy Metabolism (Wiley, New York).
- 2.Fox, P. T. & Raichle, M. E. (1986) Proc. Natl. Acad. Sci. USA 83, 1140-1144. [DOI] [PMC free article] [PubMed] [Google Scholar]
- 3.Prichard, J., Rothman, D., Novotny, E., Petroff, O., Kuwabara, T., Avison, M., Howseman, A., Hanstock, C. & Shulman, R. (1991) Proc. Natl. Acad. Sci. USA 88, 5829-5831. [DOI] [PMC free article] [PubMed] [Google Scholar]
- 4.Sappey-Marinier, D., Calabrese, G., Fein, G., Hugg, J. W., Biggins, C. & Weiner, M. W. (1992) J. Cereb. Blood Flow Metab. 12, 584-592. [DOI] [PubMed] [Google Scholar]
- 5.Frahm, J., Krüger, G., Merboldt, K.-D. & Kleinschmidt, A. (1996) Magn. Reson. Med. 35, 143-148. [DOI] [PubMed] [Google Scholar]
- 6.Fellows, L. K., Boutelle, M. G. & Fillenz, M. (1993) J. Neurochem. 60, 1258-1263. [DOI] [PubMed] [Google Scholar]
- 7.Pellerin, L. & Magistretti, P. J. (1994) Proc. Natl. Acad. Sci. USA 91, 10625-10629. [DOI] [PMC free article] [PubMed] [Google Scholar]
- 8.Hertz, L. (2004) Neurochem. Int. 45, 285-296. [DOI] [PubMed] [Google Scholar]
- 9.Pellerin, L. & Magistretti, P. J. (2003) J. Cereb. Blood Flow Metab. 23, 1282-1286. [DOI] [PubMed] [Google Scholar]
- 10.Hu, Y. & Wilson, G. S. (1997) J. Neurochem. 69, 1484-1490. [DOI] [PubMed] [Google Scholar]
- 11.Mangia, S., Garreffa, G., Bianciardi, M., Giove, F., Di Salle, F. & Maraviglia, B. (2003) Neuroscience 118, 7-10. [DOI] [PubMed] [Google Scholar]
- 12.Aubert, A. & Costalat, R. (2005) J. Cereb. Blood Flow Metab. 25, 1476-1490. [DOI] [PubMed] [Google Scholar]
- 13.Aubert, A. & Costalat, R. (2002) NeuroImage 17, 1162-1181. [DOI] [PubMed] [Google Scholar]
- 14.Cremer, J. E., Cunningham, V. J., Pardridge, W. M., Braun, L. D. & Oldendorf, W. H. (1979) J. Neurochem. 33, 439-445. [DOI] [PubMed] [Google Scholar]
- 15.Keener, J. & Sneyd, J. (1998) Mathematical Physiology (Springer, New York).
- 16.Urbanics, R., Leniger-Follert, E. & Lübbers, D. W. (1978) Pflügers Arch. 378, 47-53. [DOI] [PubMed] [Google Scholar]
- 17.Xiong, Z.-Q. & Stringer, J. L. (2000) J. Neurophysiol. 83, 3519-3524. [DOI] [PubMed] [Google Scholar]
- 18.Buxton, R. B., Wong, E. C. & Frank, L. R. (1998) Magn. Reson. Med. 39, 855-864. [DOI] [PubMed] [Google Scholar]
- 19.Gjedde, A. (1997) in Cerebrovascular Disease, ed. Batjer, H. H. (Lippincott-Raven, Philadelphia), pp. 23-40.
- 20.Valabrègue, R., Aubert, A., Burger, J., Bittoun, J. & Costalat, R. (2003) J. Cereb. Blood Flow Metab. 23, 536-545. [DOI] [PubMed] [Google Scholar]
- 21.Hu, Y. & Wilson, G. S. (1997) J. Neurochem. 68, 1745-1752. [DOI] [PubMed] [Google Scholar]
- 22.Gjedde, A., Marrett, S. & Vafaee, M. (2002) J. Cereb. Blood Flow Metab. 22, 1-14. [DOI] [PubMed] [Google Scholar]
- 23.Pellerin, L. (2003) Neurochem. Int. 43, 331-338. [DOI] [PubMed] [Google Scholar]
- 24.Kuhr, W. G., van den Berg, C. J. & Korf, J. (1988) J. Cereb. Blood Flow Metab. 8, 848-856. [DOI] [PubMed] [Google Scholar]
- 25.Leegsma-Vogt, G., van der Werf, S., Venema, K. & Korf, J. (2004) J. Cereb. Blood Flow Metab. 24, 1071-1080. [DOI] [PubMed] [Google Scholar]
- 26.Kasischke, K. A., Vishwasrao, H. D., Fisher, P. J., Zipfel, W. R. & Webb, W. W. (2004) Science 305, 99-103. [DOI] [PubMed] [Google Scholar]
- 27.Chesler, M. (2003) Physiol. Rev. 83, 1183-1221. [DOI] [PubMed] [Google Scholar]
- 28.Vicario, C., Arizmendi, C., Malloch, G., Clark, J. B. & Medina, J. M. (1991) J. Neurochem. 57, 1700-1707. [DOI] [PubMed] [Google Scholar]
- 29.Walz, W. & Mukerji, S. (1988) Neurosci. Lett. 86, 296-300. [DOI] [PubMed] [Google Scholar]
- 30.Bouzier-Sore, A.-K., Voisin, P., Canioni, P., Magistretti, P. J. & Pellerin, L. (2003) J. Cereb. Blood Flow Metab. 23, 1298-1306. [DOI] [PubMed] [Google Scholar]
- 31.Itoh, Y., Esaki, T., Shimoji, K., Cook, M., Law, M. J., Kaufman, E. & Sokoloff, L. (2003) Proc. Natl. Acad. Sci. USA 100, 4879-4884. [DOI] [PMC free article] [PubMed] [Google Scholar]
- 32.Pierre, K. & Pellerin, L. (2005) J. Neurochem. 94, 1-14. [DOI] [PubMed] [Google Scholar]
- 33.Dóra, E., Gyulai, L. & Kovách, A. G. B. (1984) Brain Res. 299, 61-72. [DOI] [PubMed] [Google Scholar]
- 34.Berg, J. M., Tymoczko, J. L. & Stryer, L. (2002) Biochemistry (Freeman, New York), 5th Ed.
- 35.Serres, S., Bezancon, E., Franconi, J.-M. & Merle, M. (2004) J. Biol. Chem. 279, 47881-47889. [DOI] [PubMed] [Google Scholar]
Associated Data
This section collects any data citations, data availability statements, or supplementary materials included in this article.