

Abstract
Background
Patients with schizophrenia show deficits in early-stage visual processing, potentially reflecting dysfunction of the magnocellular visual pathway. The magnocellular system operates normally in a nonlinear amplification mode mediated by glutamatergic (N-methyl-d-aspartate) receptors. Investigating magnocellular dysfunction in schizophrenia therefore permits evaluation of underlying etiologic hypotheses.
Objectives
To evaluate magnocellular dysfunction in schizophrenia, relative to known neurochemical and neuroanatomical substrates, and to examine relationships between electrophysiological and behavioral measures of visual pathway dysfunction and relationships with higher cognitive deficits.
Design, Setting, and Participants
Between-group study at an inpatient state psychiatric hospital and out-patient county psychiatric facilities. Thirty-three patients met DSM-IV criteria for schizophrenia or schizoaffective disorder, and 21 nonpsychiatric volunteers of similar ages composed the control group.
Main Outcome Measures
(1) Magnocellular and parvocellular evoked potentials, analyzed using nonlinear (Michaelis-Menten) and linear contrast gain approaches; (2) behavioral contrast sensitivity measures; (3) white matter integrity; (4) visual and nonvisual neuropsychological measures, and (5) clinical symptom and community functioning measures.
Results
Patients generated evoked potentials that were significantly reduced in response to magnocellular-biased, but not parvocellular-biased, stimuli (P=.001). Michaelis-Menten analyses demonstrated reduced contrast gain of the magnocellular system (P=.001). Patients showed decreased contrast sensitivity to magnocellular-biased stimuli (P<.001). Evoked potential deficits were significantly related to decreased white matter integrity in the optic radiations (P<.03). Evoked potential deficits predicted impaired contrast sensitivity (P=.002), which was in turn related to deficits in complex visual processing (P≤.04). Both evoked potential (P≤.04) and contrast sensitivity (P=.01) measures significantly predicted community functioning.
Conclusions
These findings confirm the existence of early-stage visual processing dysfunction in schizophrenia and provide the first evidence that such deficits are due to decreased nonlinear signal amplification, consistent with glutamatergic theories. Neuroimaging studies support the hypothesis of dysfunction within low-level visual pathways involving thalamocortical radiations. Deficits in early-stage visual processing significantly predict higher cognitive deficits.
Patients with schizophrenia show severe neurophysiological deficits in brain information processing not only at cognitive levels1–4 but also at perceptual levels.5–8 Perceptual deficits have been particularly well-documented in the visual system9–21 and have been shown to predict community outcome.22,23 Further, the human visual system has been exquisitely characterized both functionally and anatomically,24–26 permitting detailed examination of the brain mechanisms underlying dysfunction. This study uses steady-state visual evoked potentials (ssVEPs), together with psychophysics, neuropsychological evaluation, and magnetic resonance imaging, to evaluate the basis of early-stage visual processing deficits in schizophrenia.
The visual system is divided into magnocellular and parvocellular pathways. The magnocellular system in general conducts low-resolution visual information rapidly to cortex and is involved in attentional capture and processing of overall stimulus organization.27–29 The parvocellular system, in contrast, conducts high-resolution visual information to cortex and is involved in processing fine-grained stimulus configurations and object identification.27,30 A further focus of the study, therefore, is in the delineation of the differential functional roles of the magnocellular and parvocellular systems in visual processing dysfunction.
Both the magnocellular and parvocellular pathways begin in the retina and project, by means of lateral geniculate nucleus (LGN), to primary visual cortex (striate cortex, V1). From primary visual cortex, magnocellular information is conveyed preferentially to parietooccipital cortex and other dorsal-stream visual areas (the where pathway), and parvocellular information is conveyed preferentially to temporooccipital cortex and other ventral-stream visual areas (the what pathway), although crossover between pathways also occurs.27,31,32 Both the optic radiations from LGN to V1 and the projections from striate to extrastriate visual areas form white matter tracts that can be imaged using procedures such as diffusion tensor imaging (DTI), which provide an index of the integrity of critical neuronal projection systems.33,34
Processing of complex images, such as occur in nature, reflects the dynamic interplay between the magnocellular and parvocellular systems. However, the functioning of the 2 systems can be analyzed differentially using simple stimuli, such as isolated checks from a checkerboard pattern. Physical stimulus features, such as the brightness of the checks relative to the background (luminance contrast) can be manipulated to preferentially activate the magnocellular and parvocellular components of the system. Magnocellular neurons show greater sensitivity than parvocellular neurons to low luminance-contrast stimuli (approximately 1%–10% contrast) but reach a saturation-level response after luminance contrast reaches 16% to 32%.35 Parvocellular neurons, in contrast, do not start responding until stimuli reach higher contrast (approximately 10%) and show a nonsaturating increase in response amplitude across a wide range of luminance contrasts.36 Thus, low-contrast stimuli preferentially activate the magnocellular system, whereas high-contrast stimuli preferentially activate the parvocellular system.
Because of the response properties of the magnocellular neurons, the magnocellular system amplifies brain responses to low-contrast stimuli significantly more than it amplifies responses to higher-contrast stimuli, leading to a characteristic s-shaped, nonlinear contrast response curve.35 Properties of this amplification function are modeled using the Michaelis-Menten equation, which provides separate parameters of contrast gain, semisaturation point (s), and plateau response (Figure 1). Contrast gain is the initial segment of the contrast response curve, which rises rapidly at low contrast due to signal amplification. Because visual pathways within the brain use glutamate as their primary neurotransmitter, the relative role of specific glutamatergic receptors in generation of the nonlinear contrast response curve has been modeled in animals. In particular, administering N-methyl- d-aspartate (NMDA) antagonists into the visual system produces a specific reduction in contrast gain and plateau response, with no shift in semisaturation,37,38 which can thus be viewed as a signature of NMDA dysfunction. We hypothesize that patients with schizophrenia will have decreased contrast gain and plateau responses with no change in semisaturation point of the magnocellular response, reflecting decreased signal amplification.
Figure 1.
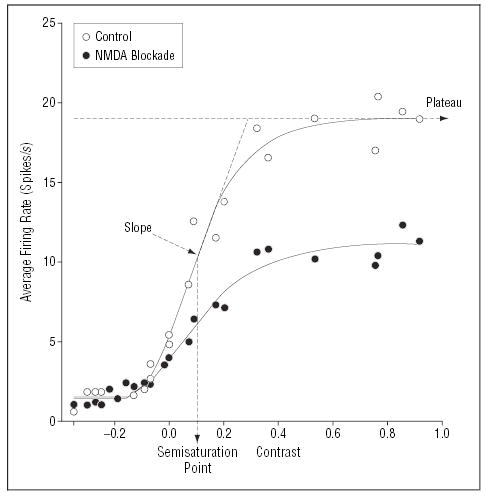
Characteristic, nonlinear contrast response function of cat lateral geniculate nucleus neuron (open circles) showing the effect of N-methyl-d-aspartate (NMDA) antagonism with D-2-amino-5-phosphonovaleric acid (D-APV) (closed circles). Nonlinear response properties of this system are modeled using the Michaelis-Menten equation, which provides separate estimates for sensitivity (semisaturation point, s) and plateau response (Rmax). Contrast gain is defined as the slope of the curve at the semisaturation point and calculated as Rmax/2s. The NMDA antagonist D-APV produces a characteristic reduction in Rmax and contrast gain, with no corresponding change in semisaturation response (closed circles). Data are from Kwon et al37 and are similar to those reported elsewhere.38 A decrease in slope and plateau with no change in semisaturation point indicates a decrease in amplification of the response.38 (Figure adapted with permission from Kwon et al.37)
A second distinguishing feature of the magnocellular and parvocellular systems is their differential sensitivity to object size within the visual field. Magnocellular neurons receive input from larger regions of the visual field than do parvocellular neurons.24 As a result, the magnocellular system is particularly sensitive to large objects (low spatial frequency), whereas the parvocellular system is more sensitive to small objects (high spatial frequency).39 Because larger stimuli are processed preferentially by the magnocellular system, such stimuli can typically be detected even when the contrast level is below 10%. In contrast, smaller stimuli are generally detected at contrast thresholds significantly above 10%, indicating reliance on parvocellular mechanisms. Contrast sensitivity to larger and smaller stimuli can therefore be used to determine the behavioral integrity of the magnocellular and parvocellular systems, respectively.20,21,40 An underlying hypothesis of this project is that disturbances in early-stage, low-level processing in the visual system will “upwardly generalize” to erode processing at higher stages of the visual system.
The present study evaluates visual processing dysfunction in schizophrenia using a combined ssVEP, behavioral, and structural approach. For ssVEP studies, stimuli were biased toward magnocellular vs parvocellular processing by manipulating luminance contrast. In the magnocellular-selective condition, stimuli appeared and disappeared, a manipulation that preferentially engages the magnocellular system. Conversely, in the parvocellular-selective condition, stimuli were modulated around a high 48% level of contrast (pedestal) that saturates the magnocellular response and so isolates the additional parvocellular activation.9,41
For behavioral studies, stimuli were biased toward the magnocellular vs parvocellular system by manipulating spatial frequency, and the contrast level needed for target detection was assessed. For both ssVEP and behavioral studies, brief (≤32 milliseconds) stimuli were used to limit cross talk between systems. For structural evaluation, DTI-based fractional anisotropy (FA) of white matter integrity was assessed in multiple visual areas, including both low-level optic radiations connecting LGN and V1 and higher-level projections involving dorsal- and ventral-steam structures. Finally, patients were assessed using a neuropsychological battery consisting of both visually related and visually unrelated measures known to be affected in schizophrenia, as well as standardized symptomatic and functional assessments, to assess the contribution of early-stage deficits to higher-level neurocognition and global outcome in schizophrenia.
METHOD
PARTICIPANTS
Informed consent was obtained from 33 patients (26 men, 7 women) meeting DSM-IV criteria for schizophrenia (n=27) or schizoaffective disorder (n=6) at inpatient and outpatient facilities associated with the Nathan Kline Institute for Psychiatric Research (Orangeburg, NY) and 21 healthy volunteers (13 men, 8 women) of similar age, following a full explanation of the procedures (Table 1). Diagnoses were obtained using the Structured Clinical Interview for DSM-IV44 and all available clinical information. All patients were receiving antipsychotic medications at the time of testing. We excluded healthy volunteers with a history of Axis I psychiatric disorder, as defined by the Structured Clinical Interview for DSM-IV.
Table 1.
Sample Characteristics of Patients With Schizophrenia
| Characteristic | Mean ± SEM Measurement |
|---|---|
| Chlorpromazine daily equivalent (n = 33), mg | 1194.0 ± 91.7 |
| Antipsychotics | |
| Atypical | 25 |
| Typical | 2 |
| Both | 6 |
| Illness duration (n = 29), y | 14.5 ± 1.7 |
| BPRS total score (n = 27) | 36.9 ± 2.1 |
| SANS total score (including global scores) (n = 27) | 42.8 ± 2.9 |
| GAF score (n = 21) | 39.7 ± 1.7 |
| WAIS-III Digit Symbol scaled score (n = 29) | 5.2 ± 0.4 |
| Continuous Performance Test–Identical Pairs42 scores (n = 16) | |
| Hit rate, 2 digits | 0.4 ± 0.1 |
| Hit rate, 3 digits | 0.3 ± 0.1 |
| Hit rate, 4 digits | 0.3 ± 0.1 |
| IQ (Quick Test)43 score (n = 25) | 93.4 ± 3.1 |
| Wisconsin Card Sorting (n = 27)* | |
| Categories achieved, No. | 0.9 ± 0.3 |
| Perserverative errors, No. | 19.8 ± 2.7 |
| WMS III Logical Memory recall (story A) score (n = 27) | 6.9 ± 0.9 |
| WAIS-R Digit Span (n = 27) | |
| Digits Forward raw score | 6.9 ± 0.5 |
| Digits Backward raw score | 5.2 ± 0.4 |
| WAIS-R Vocabulary scaled score (n = 26) | 6.7 ± 0.5 |
| WAIS-R Information scaled score (n = 27) | 7.4 ± 0.7 |
| ILS-PB scaled score (n = 31) | 30.7 ± 1.9 |
Abbreviations: BPRS, Brief Psychiatric Rating Scale; GAF, Global Assessment of Functioning; ILS-PB, Problem Solving Factor of the Independent Living Scales; SANS, Scale for the Assessment of Negative Symptoms; WAIS-III, Wechsler Adult Intelligence Scale, Third Edition; WAIS-R, Wechsler Adult Intelligence Scale, Revised Edition; WMS III, Wechsler Memory Scale, Third Edition.
The version of the Wisconsin Card Sorting Test used was the Wisconsin Card Sorting Test–64: Computer Version (Psychological Assessment Resources, Lutz, Fla).
Patients and controls were excluded if they had any neurological or ophthalmologic disorders that might affect performance or if they met criteria for alcohol or substance dependence within the last 6 months or abuse within the last month. All participants had 20/30 corrected visual acuity or better on the Logarithmic Visual Acuity Chart (Precision Vision, LaSalle, Ill).
The patient and control groups did not differ significantly in age (patients, mean ± SEM = 37.1 ± 1.7 years; controls, 36.2±2.2 years) or sex ratio (Fisher exact test; P=.22), although socioeconomic status, as measured by the 4-factor Hollingshead Scale, was significantly lower for patients (21.6±1.3; n=30) than for controls (56.2±3.2, n=21) (t=11.2, df=49, P<.001).
APPARATUS
Patterns for psychophysical and electrophysiological experiments were generated using a VENUS system (Neuroscientific Corporation, Farmingdale, NY) on a red-green-blue monitor with a frame rate of approximately 119 Hz (noninterlaced). Viewing distance was 114 cm for ssVEP and 160 cm for psychophysical experiments. The stimulus fields subtended 8 × 8° and 5.7 × 5.7° of visual angle, respectively. The space-average luminance was approximately 100 candela per square meter (cd/m2).
STEADY-STATE VISUAL EVOKED POTENTIALS
Steady-state visual evoked potentials were obtained as previously described.9 Steady-state visual evoked potentials were elicited by sinusoidal temporal modulation of an array of isolated checks (16 × 16 checks; each 15 minutes of arc of visual angle) on a steady background.45 The luminance of the checks was modulated below that of the static background, producing negative contrast (dark checks).
Steady-state visual evoked potentials were biased toward magnocellular vs parvocellular systems in separate runs through the use of different pedestals.9 In both conditions, luminance of the checks was sinusoidally modulated around the standing contrast level (pedestal) in 7 steps (0%, 1%, 2%, 4%, 8%, 16%, and 32%), leading to 7 levels of depth of modulation (DOM) per run. For the magnocellular condition, the pedestal equaled the DOM so that stimuli appeared and disappeared. For the parvocellular condition, the pedestal equaled 48% so that contrast never went below 16%.
Each of the 7 steps of DOM was presented for approximately 1 second so that each run lasted approximately 7 seconds. Stimuli were presented at a temporal frequency of 12 Hz. Ten magnocellular-biased runs followed by 10 parvocellular-biased runs were presented in a set for patients and controls.
Steady-state visual evoked potentials were recorded from an occipital midline site relative to the nose using gold-cup electrodes.46 A ground electrode was placed at the parietal site. Ten runs for each participant were averaged, and signal-to-noise ratios (SNRs) were obtained for each DOM.47,48 As previously described,9,41,48 the SNR is the amplitude of the response at the stimulus frequency divided by an estimate of noise at that frequency. Signal-to-noise ratio values greater than or equal to 1 indicate a significant ssVEP response at an α level of .05.
To derive quantitative parameters for the magnocellular and parvocellular contrast-response functions, regressions to nonlinear and linear equations were performed, respectively. The magnocellular curves, which are nonlinear, were fitted using the nonlinear Michaelis-Menten equation. Three interrelated parameters were extracted: Rmax, the plateau response; contrast gain, the slope of the curve at the semisaturation point; and s, the semisaturation contrast, which is the DOM required to produce half-maximal SNR. The parameters are related according to the formula contrast gain=Rmax/2s.
The parvocellular-biased contrast response functions, which are primarily linear, were fitted using a linear regression equation, yielding an estimate for slope.
CONTRAST SENSITIVITY FUNCTIONS
Contrast sensitivity functions were obtained by presenting 7 horizontal sine-wave gratings at the following spatial frequencies: 0.5, 1, 2, 4, 7, 10, and 21 cycles per degree. Spatial frequency is the number of pairs or cycles of light and dark bars in 1 degree of visual angle, expressed as cycles per degree.39 Each grating was presented for 32 milliseconds. An up-and-down transformed response method was used to obtain contrast thresholds with a criterion of 70.7% correct responses for each spatial frequency.49 The mean of 10 reversals was used to obtain thresholds.
Presentation of the different spatial frequency gratings was interleaved in a random order. A spatial 2-alternative forced-choice procedure was used. Gratings were presented on either the right or left side of the screen, and the participant was asked to say on which side the gratings appeared. To decrease the difficulty of the task and to minimize response errors, the experimenter rather than the participant pressed the buttons on the keypad to signify that the grating was seen on the left or the right side.
Results were plotted as contrast sensitivity, which is the reciprocal of threshold, vs spatial frequency. Increased contrast sensitivity indicates better performance.
GENERAL PROCEDURE FOR ELECTROPHYSIOLOGY AND PSYCHOPHYSICS
Participants were tested binocularly after being light-adapted to the background luminance of the display for several minutes. Participants received ssVEP testing after which contrast sensitivity functions were obtained.
MRI
Imaging was conducted on a 1.5-Tesla Siemens Vision system (Siemens, Erlangen, Germany) at the Nathan Kline Institute as previously described.33 Briefly, axial DTI scans were acquired with a pulsed gradient, double-spin echo, echo planar imaging sequence. The scans were performed with the following parameters: repetition time, 6000 milliseconds; echo time, 100 milliseconds; 128 × 128 matrix interpolated to 256 × 256; field of view, 240 mm; b, 900 seconds/mm2; number of excitations, 4; 20 slices; slice thickness, 5 mm; gap, 0 mm; 6 diffusion directions. Fractional anisotropy measures were calculated.34,50 Image analysis and quantification was performed using custom, Interactive Data Language–based software language (Research Systems, Boulder, Colo).
Regions of interest were placed bilaterally on 4 different loci: (1) optic radiations (LGN to primary visual cortex, slice corresponding to the anterior commissure/posterior commissure plane); (2) striate/extrastriate cortex (approximately 15 mm above the anterior commissure/posterior commissure plane in white matter in the most posterior regions of the occipital cortex); (3) inferior parietal lobule (dorsal stream region, approximately 25 mm above the anterior commissure/posterior commissure plane); and (4) fusiform gyrus (ventral stream region, approximately 10 mm below the anterior commissure/posterior commissure plane), yielding a total of 8 measurements. The regions of interest were placed on the T2-weighted (b =0) images.50 Within patients, there were no significant differences between the right and left hemisphere FA for any of the 4 brain regions examined. Thus, for all areas, the mean of right and left hemisphere FA was used for correlations.
NEUROPSYCHOLOGICAL TESTS AND INDEPENDENT LIVING SCALES
The neuropsychological tests listed in Table 1 were administered to patients. To assess global outcome, we used the Problem Solving Factor of the Independent Living Scales, which is a semistructured interview designed to assess the likelihood of successful independent living.51 Questions such as “Tell me 2 reasons why it is important to pay your bills” are used to elucidate effective strategies for negotiating life on a day-to-day basis. The Problem Solving Factor of the Independent Living Scales has recently been applied to schizophrenia.52
STATISTICAL ANALYSIS
Post-hoc t tests were applied when the analyses of variance revealed significant main effects or interactions. We also used t tests to analyze slopes, plateaus, and semisaturation points. Relationships between measures were analyzed by linear correlation. We used signal-to-noise ratio at 16% DOM for both magnocellular- and parvocellular-biased ssVEP conditions and contrast sensitivity at 0.5 and 21 cycles per degree for correlations. Data were missing for 1 patient and 1 control in the ssVEP condition and for 2 patients and 1 control in the contrast sensitivity condition. A subset of 14 patients with schizophrenia participated in the DTI study.
RESULTS
STEADY-STATE VISUAL EVOKED POTENTIALS
SNR Analyses
For the magnocellular-biased condition, SNRs of 1.0 or more (ie, exceeding background noise) were obtained at 1% DOM for both the patients with schizophrenia and controls (Figure 2A). Analysis of variance conducted across all levels of DOM showed a highly significant between-group effect for patients vs controls (F1,50=13.0, P=.001). There was also a significant interaction between group and DOM (F5,46 = 3.2, P =.02). Patient SNRs were reduced by 30% to 50% of comparison values.
Figure 2.
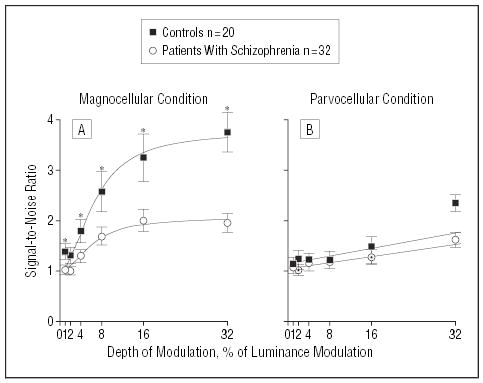
Steady-state visual evoked potential signal-to-noise ratios for patients with schizophrenia and healthy controls in test conditions using luminance contrast to emphasize magnocellular or parvocellular visual pathways. Nonlinear curve fits were obtained for the magnocellular-biased contrast response function using the Michaelis-Menten equation. Linear curve fits were obtained for the parvocellular-biased condition using linear regression. For the magnocellular condition, analysis of variance showed a significant between-group effect. For the parvocellular condition, while there was no significant between-group effect, a significant between-group difference was observed at 32% depth of modulation (t=3.0, df=50, P=.004). Asterisk indicates P<.05.
For the parvocellular-biased condition, SNRs exceeding background noise were also obtained at 1% for both groups (Figure 2B). However, in this condition analysis of variance did not show a significant overall between-group difference (F1,50 = 2.1, P = .15). Further, a repeated measures analysis of variance of within-group factors of condition (magnocellular vs parvocellular) and DOM and between-group factors of diagnostic group demonstrated a highly significant interaction of group and stimulus type (F1,50 = 9.0, P = .004), indicating greater severity of magnocellular, rather than parvocellular, dysfunction.
Contrast Gain Analyses
For both the schizophrenia and control groups, as expected, the magnocellular contrast response curves were markedly nonlinear, with initial steep slope followed by plateau at about 16% DOM. For both schizophrenia and control groups, highly reliable fits were obtained to group mean data using the nonlinear Michaelis-Menten equation (r>.99) (Figure 2B). The 2 groups differed significantly (P≤.001) in slope (representing contrast gain) (Figure 3A) and plateau (Figure 3B) but not semisaturation point (s, controls, 6.61±1.55; patients, 6.17±1.78; t=0.17, df=302, P=.9), indicating decreased amplification of the magnocellular contrast response function in patients with schizophrenia.
Figure 3.
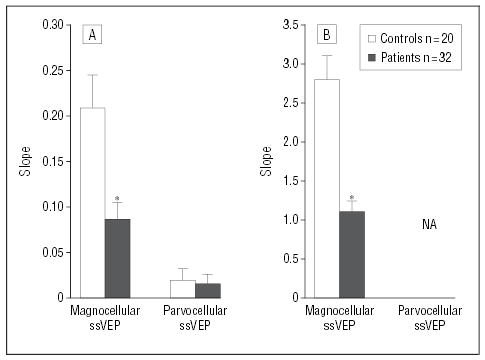
Slope and plateau levels obtained using steady-state visual evoked potentials (ssVEPs) for patients with schizophrenia and healthy controls in test conditions using luminance contrast to emphasize magnocellular or parvocellular pathways. No plateau is given for the parvocellular-biased condition because of the nonsaturating nature of the response. Slope was calculated for the magnocellular-biased condition using the Michaelis-Menten equation and for the parvocellular-biased condition using a linear regression equation. Asterisk indicates P≤.001; NA, not applicable.
For both groups, as expected, the parvocellular curves showed linear responses over the 1% to 16% range, although an apparent nonlinear increase was observed between 16% and 32% for controls only. Data were therefore fitted using a linear regression over the 1% to 16% DOM range (Figure 2B). For both groups, highly reliable estimates were obtained (r>0.9). Slopes for the 1% to 16% DOM range did not differ significantly between groups (Figure 3A).
CONTRAST SENSITIVITY
Analysis of variance conducted across all levels of spatial frequency revealed a significant between-group effect (F1,49 = 81.6, P<.001), as well as a significant group × spatial frequency interaction (F6,44 = 13.1, P<.001), indicating selective deficits in magnocellular-biased stimulus detection (Figure 4). Further, contrast sensitivity deficits correlated significantly with deficits in ssVEP performance (r=0.55, n=30, P=.002) (Figure 5), reflecting a significant intercorrelation between electrophysiological and behavioral measures.
Figure 4.
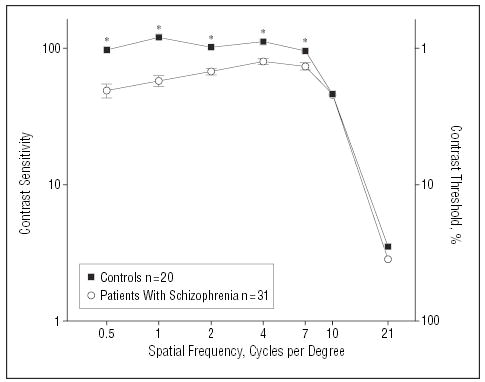
Psychophysical contrast sensitivity functions for patients with schizophrenia and healthy controls. Values are plotted as contrast sensitivity, defined as the reciprocal of contrast threshold percentage. Corresponding contrast thresholds are shown on the right side. Results at the lower spatial frequencies are indicative of performance of the magnocellular system, and results at the higher spatial frequencies are indicative of performance of the parvocellular system. Asterisk indicates P≤.002.
Figure 5.
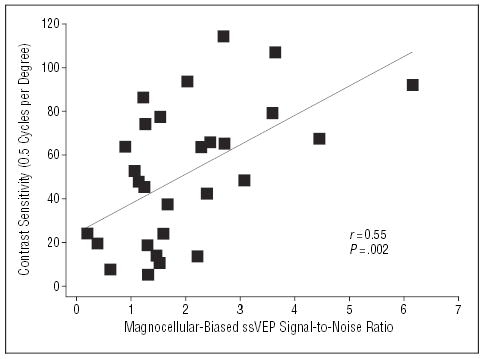
Scatterplot showing the relationship between magnocellular-biased steady-state visual evoked potential (ssVEP) responses and magnocellular-biased contrast sensitivity for patients with schizophrenia.
STRUCTURE-FUNCTION RELATIONS
Representative regions of interest for optic radiations for the FA map are shown in Figure 6A. There was a significant correlation between optic radiation FA and magnocellular-biased (r=0.59, n=14, P=.02), but not parvocellular-biased (r=0.46, n=14, P=.09), ssVEP responses (Figure 6B). No significant correlations between magnocellular- or parvocellular-biased ssVEP responses and FA were found for any other brain region.
Figure 6.
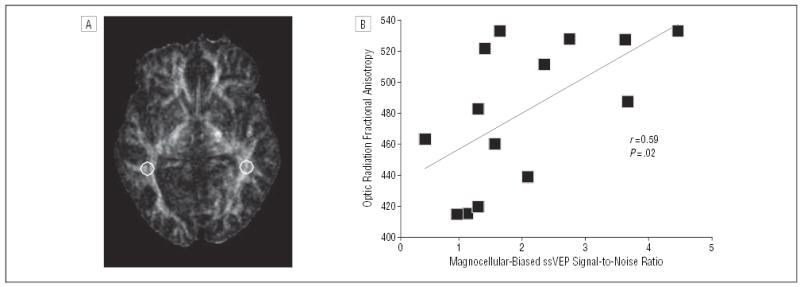
(A) Fractional anisotropy (FA) image with circles representing regions of interest based on their placement in the optic radiations on the b=0 image (not shown). (B) Scatter plot showing the relationship between magnocellular-biased steady-state visual evoked potential (ssVEP) responses and FA of optic radiation white matter tracts for patients with schizophrenia. Fractional anisotropy measures range from 0 to 1, with 0 representing complete isotropic diffusion (no directional selectivity) and 1 representing complete anisotropy.
RELATIONSHIPS BETWEEN VISUAL PROCESSING MEASURES, NEUROPSYCHOLOGICAL FUNCTIONING, AND OUTCOME
Patients are characterized with respect to neuropsychological performance in Table 1. Decreased contrast sensitivity at 0.5 cycles per degree was significantly correlated with poorer performance on the Digit Symbol task and with hit rate on the 4-digit Continuous Performance Task–Identical Pairs,42 measures of visual processing, as well as with digits backward and forward and IQ (Quick Test).43 In contrast, no significant correlations were found with the Wisconsin Card Sorting (WCS) or Logical Memory (Table 2).
Table 2.
Correlations Between Visual Processing and Neuropsychological Function for Patients With Schizophrenia
| Neuropsychological Function | Correlations with Magnocellular-Biased Contrast Sensitivity (0.5 Cycles per Degree) |
|---|---|
| Visual Measures | |
| WAIS-III Digit Symbol scaled score | r = 0.50, n = 28, P = .007* |
| Hit rate, 2-digit CPT-IP | r = 0.21, n = 16, P = .43 |
| Hit rate, 3-digit CPT-IP | r = 0.45, n = 16, P = .08 |
| Hit rate, 4-digit CPT-IP | r = 0.56, n = 16, P = .02* |
| Nonvisual Measures | |
| Digits Backward raw score | r = 0.58, n = 25, P = .003* |
| Digits Forward raw score | r = 0.41, n = 25, P = .02* |
| Wisconsin Card Sorting categories achieved, No. | r = 0.11, n = 25, P = .63 |
| Wisconsin Card Sorting perseverative errors, No. | r = –0.05, n = 25, P = .81 |
| WMS III Logical Memory recall | r = 0.11, n = 25, P = .59 |
| Intelligence | |
| IQ (Quick Test) score | r = 0.48, n = 23, P = .02* |
| WAIS-R Vocabulary scaled score | r = 0.36, n = 24, P = .09 |
| WAIS-R Information scaled score | r = 0.35, n = 25, P = 09 |
Abbreviations: CPT-IP, Continuous Performance Test–Identical Pairs; WAIS-III, Wechsler Adult Intelligence Scale, Third Edition; WAIS-R, Wechsler Adult Intelligence Scale, Revised Edition; WMS III, Wechsler Memory Scale, Third Edition.
P<.05.
No significant correlations were found between either contrast sensitivity at 21 cycles per degree or magnocellular- and parvocellular-biased ssVEP results and neuropsychological functioning. However, magnocellular-(r=0.37, n=30, P=.04) and parvocellular-biased (r=0.44, n=30, P=.01) ssVEP measures and contrast sensitivity at 0.5 cycles per degree (r=0.44, n=30, P=.01) all correlated significantly with the Problem Solving Factor of the Independent Living Scales, a surrogate measure of community functioning.
Magnocellular-biased ssVEP performance also correlated significantly with scores on the Global Assessment of Functioning (r=0.5, n=20, P=.02), but not with total scores on the Scale for the Assessment of Negative Symptoms or Brief Psychiatric Rating Scale. No significant correlations were found between parvocellular-biased ssVEP performance or contrast sensitivity measures and scores on the Scale for the Assessment of Negative Symptoms, Brief Psychiatric Rating Scale, or Global Assessment of Functioning.
MEDICATION EFFECTS
No significant correlation was found between magnocellular-biased ssVEP responses (r=−0.15, n=32, P=.4) or between contrast sensitivity at 0.5 cycles per degree (r=−0.16, n=31, P=.4) and chlorpromazine equivalents. Further, significant deficits in magnocellular ssVEP generation (F1,42 = 9.9, P = .003) and contrast sensitivity (F1,41 = 71.1, P<.001) compared with controls were observed even in the subgroup of patients receiving atypical antipsychotics alone.
A significant negative correlation was found between parvocellular-biased ssVEP responses and chlorpromazine equivalents (r = −0.46, n = 32, P = .008), although no correlation was observed with contrast sensitivity at 21 cycles per degree (r = −0.02, n = 31, P = .9). No differences were observed between subjects receiving atypical antipsychotics alone vs those receiving mixed typical and atypical medication on any measure.
COMMENT
Over the past decade, deficits in early visual processing in patients with schizophrenia have become increasingly well-documented, although underlying mechanisms remain obscure. Deficits are particularly prominent in processes, such as motion detection or backward masking, that depend mainly upon magnocellular input to the dorsal visual stream and in detection of low contrast and low spatial frequency stimuli.9,13,14,16–18,20,40,53 However, deficits have been observed as well even in processing of parvocellular-biased stimuli.20,54,55 The present study demonstrates that deficits in contrast gain, a form of neural amplification, may be critically involved in early cortical dysfunction in schizophrenia. Diffusion tensor imaging results support the hypothesis that deficits in the generation of magnocellular-biased ssVEPs are related to dysfunction at low levels of the visual system. In addition, deficits in behavioral detection of simple magnocellular-biased stimuli correlate with deficits in magnocellular-biased ssVEPs, confirming a critical role of early cortical dysfunction in visual behavioral deficits.
The present results support our previous report of a preferential magnocellular dysfunction using ssVEP.9 There was a significant statistical interaction between group and visual pathway, indicating greater involvement of the magnocellular system under the conditions studied. As in previous studies, however, this study does not preclude parvocellular involvement in schizophrenia as well, and in fact, an isolated deficit was observed in patients at the highest level of DOM. Thus, early-stage processing in general appears impaired, with the degree of impairment greater for the magnocellular visual system than it is for parvocellular visual system.
The preferential magnocellular dysfunction reported here seems to occur at low levels of the visual system. First, the ssVEP stimuli, which used luminance contrast, were chosen because they differentially activate magnocellular vs parvocellular neurons in LGN and primary visual cortex. Indeed, the magnocellular and parvocellular contrast response functions are very similar to what is seen from single-cell recordings in monkey LGN.35 Second, a significant relationship was found between decreased magnocellular-biased ssVEP responses and decreased white matter integrity in the optic radiations, which project from LGN to striate cortex. Significant relationships between ssVEP responses and white matter integrity at higher levels of the visual system were not found.
These DTI findings provide direct support for the hypothesis that magnocellular dysfunction occurs at the earliest stages of visual responsivity. Previous reports of decreased white matter integrity in occipital white matter adjacent to the splenium of the corpus callosum33,56 provide anatomical support for a relationship between white matter deficits in low-level visual areas and ssVEP deficits. Fractional anisotropy deficits can be produced by primary glial or neuronal pathology with patterns determined by radial and axial diffusivity.57 Our study is also consistent with previous findings of decreased functional magnetic resonance imaging activation in thalamus in response to visual and auditory stimuli, although decreased functional magnetic resonance imaging activation in the dorsal visual pathway was also found in patients with schizophrenia.11 Although we cannot rule out a role of higher brain areas in ssVEP deficits, our results indicate a selective role of lower visual areas in magnocellular-biased ssVEP dysfunction and a role of decreased white matter integrity in these deficits.
Although the etiology of visual processing dysfunction in schizophrenia has yet to be defined, results from the present study help constrain potential etiologies. Recent theories of schizophrenia propose that symptoms reflect impaired neurotransmission at NMDA-type glutamate receptors.58–60 This theory is supported by studies showing that NMDA antagonists such as phencyclidine or ketamine induce cognitive deficits closely resembling those of schizophrenia61–65 and that positive NMDA modulators such as glycine ameliorate specific signs and symptoms.66–68 The decreased contrast gain and plateau in the magnocellular-biased ssVEP contrast response curve for patients with schizophrenia in the present study (Figure 2A) closely resembles results seen following microinfusion of an NDMA antagonist into cat LGN (Figure 1). Further, the correlation between reduced optic radiation integrity and ssVEP deficits supports models in which impaired afferent information flow contributes to early-stage visual processing deficits in schizophrenia. In controls but not patients, a deviation from linear gain in the parvocellular response was seen at 32% DOM, indicating that the critical issue underlying the deficit in schizophrenia may not be pathway, but the characteristics of the processing involved. Thus, the capacity of neuronal systems for nonlinear gain (ie, amplification) may be reduced in general in schizophrenia, but in the visual system, nonlinear gain is more characteristic of the magnocellular system than it is of the parvocellular system. We predict that more pervasive deficits might be observed under other conditions that drive the parvocellular system into a nonlinear gain process.
With regard to behavioral findings, we report a differential deficit in the ability of patients with schizophrenia to detect low and medium (0.5–7 cycles per degree) vs high (10–21 cycles per degree) spatial frequency stationary gratings, as reflected in a significant group × spatial frequency interaction. In the low and middle spatial frequency range, contrast sensitivity values (which are the reciprocals of thresholds) for patients and controls were in the range of 50 to 100, corresponding to threshold levels of 1% to 2% contrast. Thus, when contrast detection thresholds were in the magnocellular-selective range, and especially when stimuli were biased toward the magnocellular system by spatial frequency (ie, lower spatial frequencies), patients showed deficits relative to controls. However, when stimuli were biased toward the parvocellular system at the highest spatial frequency, contrast sensitivity values for patients and controls were approximately 3, corresponding to thresholds of 33% contrast. This value is above the magnocellular-selective range and thus reflects parvocellular involvement. Taken together, these findings suggest that contrast sensitivity, like ssVEP, is relatively preserved for the parvocellular system but impaired for the magnocellular system in schizophrenia.
To date, literature regarding contrast sensitivity deficits in schizophrenia, to date, has been conflicting, with some groups finding deficits to low and middle spatial frequency gratings20,21,69 and others not.40,70 Differences may be due to methodological issues70 or to type of antipsychotic medication.71 However, the present results suggest that absolute contrast threshold levels may also be a factor. In particular, studies that have found behavioral deficits to high spatial frequency gratings have typically used long (400–500 milliseconds) presentation rates yielding thresholds of approximately 10% or less.20,21 At the shorter 32-millisecond duration used in the present study, absolute thresholds were in the parvocellular range, and no deficit was seen to high spatial frequency. Thus, the critical parameter across studies may be absolute contrast level rather than spatial frequency alone. A more recent study further confirms magnocellular dysfunction in schizophrenia through the use of different contrast levels.72
Recent studies have revealed a variety of visual processing deficits in schizophrenia, particularly in such tasks such as motion detection, trajectory, and spatial localization14,17,40,53,72–74 that reflect dysfunction of the dorsal visual stream. Because the dorsal stream receives primary input from the magnocellular visual pathway,32 deficits in magnocellular function may also underlie higher-order dorsal visual pathway dysfunction. For example, microinfusion of NMDA antagonists into V1 disrupts cortical processing of motion information,75 a process that is also impaired in schizophrenia.17,40,73,74
Deficits in higher-order stages of visual processing, as indexed by tasks used in the present study (Digit Symbol, Continuous Performance Task–Identical Pairs), have been shown consistently to contribute to poor functional outcomes in schizophrenia,22,76 although the neurophysiological basis for these deficits has yet to be determined. The present study demonstrates a chain of correlation from early-stage electrophysiological disturbance (ssVEP) through basic sensory processing (contrast sensitivity) to complex visual processing (Digit Symbol, Continuous Performance Task–Identical Pairs), mediated as well by structural alterations within basic visual pathways (optic radiation FA). In contrast to the chain of relationships within visually based behaviors, no correlations were observed between ssVEP or contrast sensitivity and Logical Memory or Wisconsin Card Sorting performance, a putative measure of prefrontal dysfunction in schizophrenia—suggesting specificity of relationships within the visual system. Thus, cognitive dysfunction in schizophrenia most likely involves dysfunction within broadly distributed neural networks, with dysfunction of early-stage visual areas contributing specifically to dysfunction of ecologically relevant complex visual behaviors.
A limitation of this study is that all the patients were receiving medications at the time of testing. Thus, the possibility of a medication effect must be considered. However, visual processing deficits have been observed in both medicated and unmedicated patients,10,55,77–80 as well as in first-degree relatives of patients with schizophrenia72,81–83 and people with schizotypal personality disorder84 who are not receiving medication.
Chen et al71 have suggested that contrast-sensitivity deficits are related to medication such that they are found only in patients taking typical, rather than atypical, antipsychotics. In the present study, deficits were observed even in patients receiving atypical antipsychotics alone, suggesting that patient characteristics rather than medication type might be the primary predictor of visual dysfunction. Finally, no significant correlations were found between chlorpromazine equivalents and magnocellular-biased ssVEP performance or contrast sensitivity, although a significant correlation was found between chlorpromazine equivalents and parvocellular-biased ssVEP performance, a task on which patients did not show a deficit in the analysis of variance. Thus, it is unlikely that the differential deficits shown in this study are due to a medication effect.
In summary, this study demonstrates deficits in early-stage visual processing involving especially the magnocellular visual system. The pattern of deficits is consistent with predictions of glutamatergic NMDA models. Across patients, deficits in early-stage neurophysiological function contribute significantly to lower-level visual deficits (eg, contrast sensitivity), which contribute in turn to higher-level deficits such as performance in Digit Symbol and Continuous Performance Task–Identical Pairs tasks. Neurophysiological deficits correlated as well with structural deficits of optic radiations documenting the importance of subcortical as well as cortical dysfunction in schizophrenia.
Footnotes
Funding/Support: This study was supported in part by a Lieber Young Investigator Award from the National Alliance for Research on Schizophrenia and Depression, Great Neck, NY (Dr Butler); grants RO1 MH66374 (Dr Butler), RO1 MH64783 (Dr Hoptman), RO1 MH60662 (Dr Lim), and R37 MH49334 and K02 MH01439 (Dr Javitt) from the US Public Health Service, Rockville, Md; and a Translational Scientist Award from the Burroughs Wellcome Fund, Research Triangle Park, NC (Dr Javitt).
Previous Presentation: This work was presented in part at the Annual Meeting of the Society of Biological Psychiatry; April 29, 2004; New York, NY; and is published after peer review and revision.
References
- 1.Goldman-Rakic PS. Working memory dysfunction in schizophrenia. . J Neuropsychiatry Clin Neurosci. 1994;6:348–357. doi: 10.1176/jnp.6.4.348. [DOI] [PubMed] [Google Scholar]
- 2.Goldberg TE, Gold JM. Neurocognitive functioning in patients with schizophrenia: an overview. In: Bloom FE, Kupfer DJ, eds. Psychopharmacology, the Fourth Generation of Progress New York, NY: Raven Press Ltd; 1995:1245–1257.
- 3.Weinberger DR, Gallhofer B. Cognitive function in schizophrenia. . Int Clin Psychopharmacol. 1997;12(suppl 4):S29–S36. doi: 10.1097/00004850-199709004-00006. [DOI] [PubMed] [Google Scholar]
- 4.Green MF. Schizophrenia From a Neurocognitive Perspective Boston, Mass: Al-lyn & Bacon; 1998.
- 5.Adler LE, Freedman R, Ross RG, Olincy A, Waldo MC. Elementary phenotypes in the neurobiological and genetic study of schizophrenia. . Biol Psychiatry. 1999;46:8–18. doi: 10.1016/s0006-3223(99)00085-2. [DOI] [PubMed] [Google Scholar]
- 6.Braff DL, Saccuzzo DP, Geyer MA. Information processing dysfunctions in schizophrenia: studies of visual backward masking, sensorimotor gating, and habituation. In: Steinhauer SR, Gruzelier JH, Zubin J, eds. Handbook of Schizophrenia Vol 5. New York, NY: Elsevier; 1991:303–334.
- 7.Javitt DC, Liederman E, Cienfuegos A, Shelley AM. Panmodal processing imprecision as a basis for dysfunction of transient memory storage systems in schizophrenia. . Schizophr Bull. 1999;25:763–775. doi: 10.1093/oxfordjournals.schbul.a033417. [DOI] [PubMed] [Google Scholar]
- 8.Turetsky BI, Moberg PJ, Owzar K, Johnson SC, Doty RL, Gur RE. Physiologic impairment of olfactory stimulus processing in schizophrenia. . Biol Psychiatry. 2003;53:403–411. doi: 10.1016/s0006-3223(02)01865-6. [DOI] [PubMed] [Google Scholar]
- 9.Butler PD, Schechter I, Zemon V, Schwartz SG, Greenstein VC, Gordon J, Schroeder CE, Javitt DC. Dysfunction of early stage visual processing in schizophrenia. . Am J Psychiatry. 2001;158:1126–1133. doi: 10.1176/appi.ajp.158.7.1126. [DOI] [PubMed] [Google Scholar]
- 10.Butler PD, DeSanti LA, Maddox J, Harkavy-Friedman JM, Amador XF, Goetz RR, Javitt DC, Gorman JM. Visual backward-masking deficits in schizophrenia: relationship to visual pathway function and symptomatology. . Schizophr Res. 2003;59:199–209. doi: 10.1016/s0920-9964(01)00341-3. [DOI] [PubMed] [Google Scholar]
- 11.Braus DF, Weber-Fahr W, Tost H, Ruf M, Henn FA. Sensory information processing in neuroleptic-naive first-episode schizophrenic patients: a functional magnetic resonance imaging study. . Arch Gen Psychiatry. 2002;59:696–701. doi: 10.1001/archpsyc.59.8.696. [DOI] [PubMed] [Google Scholar]
- 12.Brenner CA, Lysaker PH, Wilt MA, O’Donnell BF. Visual processing and neuropsychological function in schizophrenia and schizoaffective disorder. . Psychiatry Res. 2002;111:125–136. doi: 10.1016/s0165-1781(02)00139-7. [DOI] [PubMed] [Google Scholar]
- 13.Cadenhead KS, Serper Y, Braff DL. Transient versus sustained visual channels in the visual backward masking deficits of schizophrenia patients. . Biol Psychiatry. 1998;43:132–138. doi: 10.1016/S0006-3223(97)00316-8. [DOI] [PubMed] [Google Scholar]
- 14.Chen Y, Nakayama K, Levy D, Matthysse S, Holzman P. Processing of global, but not local, motion direction is deficient in schizophrenia. . Schizophr Res. 2003;61:215–227. doi: 10.1016/s0920-9964(02)00222-0. [DOI] [PubMed] [Google Scholar]
- 15.Doniger GM, Foxe JJ, Murrary MM, Higgins BA, Javitt DC. Impaired visual object recognition and dorsal/ventral stream interaction in schizophrenia. . Arch Gen Psychiatry. 2002;59:1011–1020. doi: 10.1001/archpsyc.59.11.1011. [DOI] [PubMed] [Google Scholar]
- 16.Green MF, Mintz J, Salveson D, Nuechterlein KH, Breitmeyer B, Light GA, Braff DL. Visual masking as a probe for abnormal gamma range activity in schizophrenia. . Biol Psychiatry. 2003;53:1113–1119. doi: 10.1016/s0006-3223(02)01813-9. [DOI] [PubMed] [Google Scholar]
- 17.Li CS. Impaired detection of visual motion in schizophrenia patients. . Prog Neuropsychopharmacol Biol Psychiatry. 2002;26:929–934. doi: 10.1016/s0278-5846(02)00207-5. [DOI] [PubMed] [Google Scholar]
- 18.Schechter I, Butler PD, Silipo G, Zemon V, Javitt DC. Magnocellular and parvocellular contributions to backward masking dysfunction in schizophrenia. . Schizophr Res. 2003;64:91–101. doi: 10.1016/s0920-9964(03)00008-2. [DOI] [PubMed] [Google Scholar]
- 19.Schwartz BD, Maron BA, Evans WJ, Winstead DK. High velocity transient visual processing deficits diminish ability of patients with schizophrenia to recognize objects. . Neuropsychiatry Neuropsychol Behav Neurol. 1999;12:170–177. [PubMed] [Google Scholar]
- 20.Slaghuis WL. Contrast sensitivity for stationary and drifting spatial frequency gratings in positive- and negative-symptom schizophrenia. . J Abnorm Psychol. 1998;107:49–62. doi: 10.1037//0021-843x.107.1.49. [DOI] [PubMed] [Google Scholar]
- 21.Keri S, Antal A, Szekeres G, Benedek G, Janka Z. Spatiotemporal visual processing in schizophrenia. . J Neuropsychiatry Clin Neurosci. 2002;14:190–196. doi: 10.1176/jnp.14.2.190. [DOI] [PubMed] [Google Scholar]
- 22.Gold JM, Goldberg RW, McNary SW, Dixon LB, Lehman AF. Cognitive correlates of job tenure among patients with severe mental illness. . Am J Psychiatry. 2002;159:1395–1402. doi: 10.1176/appi.ajp.159.8.1395. [DOI] [PubMed] [Google Scholar]
- 23.Sergi MJ, Green MF. Social perception and early visual processing in schizophrenia. . Schizophr Res. 2003;59:233–241. doi: 10.1016/s0920-9964(01)00405-4. [DOI] [PubMed] [Google Scholar]
- 24.Dacey DM, Petersen MR. Dendritic field size and morphology of midget and parasol ganglion cells of the human retina. . Proc Natl Acad Sci U S A. 1992;89:9666–9670. doi: 10.1073/pnas.89.20.9666. [DOI] [PMC free article] [PubMed] [Google Scholar]
- 25.Casagrande VA, Xu X. Parallel visual pathways: a comparative perspective. In: Chalupa LM, Werner JS, eds. The Visual Neurosciences Vol 1. Cambridge, Mass: MIT Press; 2003.
- 26.Orban GA, Van Essen D, Vanduffel W. Comparative mapping of higher visual areas in monkeys and humans. . Trends Cogn Sci. 2004;8:315–324. doi: 10.1016/j.tics.2004.05.009. [DOI] [PubMed] [Google Scholar]
- 27.Merigan WH, Maunsell JHR. How parallel are the primate visual pathways? In: Cowan WM, Shooter EM, Stevens CF, Thompson RF, eds. Annual Review of Neuroscience Palo Alto, Calif: Annual Reviews, Inc; 1993:369–402. [DOI] [PubMed]
- 28.Vidyasagar TR. A neuronal model of attentional spotlight: parietal guiding the temporal. . Brain Res Brain Res Rev. 1999;30:66–76. doi: 10.1016/s0165-0173(99)00005-3. [DOI] [PubMed] [Google Scholar]
- 29.Steinman B, Steinman S, Lehmkuhle S. Transient visual attention is dominated by the magnocellular stream. . Vision Res. 1997;37:17–23. doi: 10.1016/s0042-6989(96)00151-4. [DOI] [PubMed] [Google Scholar]
- 30.Norman J. Two visual systems and two theories of perception: an attempt to reconcile the constructivist and ecological approaches. . Behav Brain Sci. 2002;25:73–144. doi: 10.1017/s0140525x0200002x. [DOI] [PubMed] [Google Scholar]
- 31.Thiele A, Dobkins KR, Albright TD. Neural correlates of chromatic motion perception. . Neuron. 2001;32:351–358. doi: 10.1016/s0896-6273(01)00463-9. [DOI] [PubMed] [Google Scholar]
- 32.Maunsell JH, Nealey TA, DePriest DD. Magnocellular and parvocellular contributions to responses in the middle temporal visual area (MT) of the macaque monkey. . J Neurosci. 1990;10:3323–3334. doi: 10.1523/JNEUROSCI.10-10-03323.1990. [DOI] [PMC free article] [PubMed] [Google Scholar]
- 33.Ardekani BA, Nierenberg J, Hoptman MJ, Javitt DC, Lim KO. MRI study of white matter diffusion anisotropy in schizophrenia. . Neuroreport. 2003;14:2025–2029. doi: 10.1097/00001756-200311140-00004. [DOI] [PubMed] [Google Scholar]
- 34.Basser PJ, Mattiello J, LeBihan D. MR diffusion tensor spectroscopy and imaging. . Biophys J. 1994;66:259–267. doi: 10.1016/S0006-3495(94)80775-1. [DOI] [PMC free article] [PubMed] [Google Scholar]
- 35.Kaplan E. The receptive field structure of retinal ganglion cells in cat and monkey. In: Leventhal AG, ed. Vision and Visual Dysfunction Boston, Mass: CRC Press; 1991:10–40.
- 36.Tootell RB, Hamilton SL, Switkes E. Functional anatomy of macaque striate cortex. IV. Contrast and magnoparvo streams. . J Neurosci. 1988;8:1594–1609. doi: 10.1523/JNEUROSCI.08-05-01594.1988. [DOI] [PMC free article] [PubMed] [Google Scholar]
- 37.Kwon YH, Nelson SB, Toth LJ, Sur M. Effect of stimulus contrast and size on NMDA receptor activity in cat lateral geniculate nucleus. . J Neurophysiol. 1992;68:182–196. doi: 10.1152/jn.1992.68.1.182. [DOI] [PubMed] [Google Scholar]
- 38.Fox K, Sato H, Daw N. The effect of varying stimulus intensity on NMDA-receptor activity in cat visual cortex. . J Neurophysiol. 1990;64:1413–1428. doi: 10.1152/jn.1990.64.5.1413. [DOI] [PubMed] [Google Scholar]
- 39.Jindra LF, Zemon V. Contrast sensitivity testing: a more complete assessment of vision. . J Cataract Refract Surg. 1989;15:141–148. doi: 10.1016/s0886-3350(89)80002-1. [DOI] [PubMed] [Google Scholar]
- 40.Chen Y, Palafox GP, Nakayama K, Levy DL, Matthysse S, Holzman PS. Motion perception in schizophrenia. . Arch Gen Psychiatry. 1999;56:149–154. doi: 10.1001/archpsyc.56.2.149. [DOI] [PubMed] [Google Scholar]
- 41.Greenstein VC, Seliger S, Zemon V, Ritch R. Visual evoked potential assessment of the effects of glaucoma on visual subsystems. . Vision Res. 1998;38:1901–1911. doi: 10.1016/s0042-6989(97)00348-9. [DOI] [PubMed] [Google Scholar]
- 42.Cornblatt BA, Malhotra AK. Impaired attention as an endophenotype for molecular genetic studies of schizophrenia. . Am J Med Genet. 2001;105:11–15. [PubMed] [Google Scholar]
- 43.Ammons R, Ammons C. The Quick Test (QT): provisional manual. . Psychol Rep. 1962;11:111–162. [Google Scholar]
- 44.First MB, Spitzer RL, Gibbon M, Williams JBW. Structured Clinical Interview for DSM-IV Axis I Disorders–Patient Edition New York: New York State Psychiatric Institute; 1997.
- 45.Zemon V, Gordon J, Welch J. Asymmetries in ON and OFF visual pathways of humans revealed using contrast-evoked cortical potentials. . Vis Neurosci. 1988;1:145–150. doi: 10.1017/s0952523800001085. [DOI] [PubMed] [Google Scholar]
- 46.Jasper HH. Appendix to report to Committee on Clinical Examination in EEG: the ten-twenty electrode system of the International Federation. . Electroencephalogr Clin Neurophysiol. 1958;10:371–375. [Google Scholar]
- 47.Victor JD, Mast J. A new statistic for steady-state evoked potentials. . Electroencephalogr Clin Neurophysiol. 1991;78:378–388. doi: 10.1016/0013-4694(91)90099-p. [DOI] [PubMed] [Google Scholar]
- 48.Zemon V, Hartmann EE, Gordon J, Prunte-Glowazki A. An electrophysiological technique for assessment of the development of spatial vision. . Optom Vis Sci. 1997;74:708–716. doi: 10.1097/00006324-199709000-00018. [DOI] [PubMed] [Google Scholar]
- 49.Wetherill GB, Levitt H. Sequential estimation of points on a psychometric function. . Br J Math Stat Psychol. 1965;18:1–10. doi: 10.1111/j.2044-8317.1965.tb00689.x. [DOI] [PubMed] [Google Scholar]
- 50.Hoptman MJ, Volavka J, Johnson G, Weiss E, Bilder RM, Lim KO. Frontal white matter microstructure, aggression, and impulsivity in men with schizophrenia: a preliminary study. . Biol Psychiatry. 2002;52:9–14. doi: 10.1016/s0006-3223(02)01311-2. [DOI] [PubMed] [Google Scholar]
- 51.Loeb PA. ILS: Independent Living Scales Manual San Antonio, Tex: The Psychological Corp, Harcourt Race Jovanovich, Inc; 1996.
- 52.Revheim N, Medalia A. Verbal memory, problem-solving skills and community status in schizophrenia. . Schizophr Res. 2004;68:149–158. doi: 10.1016/j.schres.2003.07.004. [DOI] [PubMed] [Google Scholar]
- 53.Brenner CA, Wilt MA, Lysaker PH, Koyfman A, O’Donnell BF. Psychometrically matched visual-processing tasks in schizophrenia spectrum disorders. . J Abnorm Psychol. 2003;112:28–37. [PubMed] [Google Scholar]
- 54.Saccuzzo DP, Braff DL. Information-processing abnormalities: trait- and state-dependent components. . Schizophr Bull. 1986;12:447–459. doi: 10.1093/schbul/12.3.447. [DOI] [PubMed] [Google Scholar]
- 55.Butler PD, Harkavy-Friedman JM, Amador XF, Gorman JM. Backward masking in schizophrenia: relationship to medication status, neuropsychological functioning, and dopamine metabolism. . Biol Psychiatry. 1996;40:295–298. doi: 10.1016/0006-3223(96)00007-8. [DOI] [PubMed] [Google Scholar]
- 56.Agartz I, Andersson JL, Skare S. Abnormal brain white matter in schizophrenia: a diffusion tensor imaging study. . Neuroreport. 2001;12:2251–2254. doi: 10.1097/00001756-200107200-00041. [DOI] [PubMed] [Google Scholar]
- 57.Song SK, Sun SW, Ju WK, Lin SJ, Cross AH, Neufeld AH. Diffusion tensor imaging detects and differentiates axon and myelin degeneration in mouse optic nerve after retinal ischemia. . Neuroimage. 2003;20:1714–1722. doi: 10.1016/j.neuroimage.2003.07.005. [DOI] [PubMed] [Google Scholar]
- 58.Javitt DC, Zukin SR. Recent advances in the phencyclidine model of schizophrenia. . Am J Psychiatry. 1991;148:1301–1308. doi: 10.1176/ajp.148.10.1301. [DOI] [PubMed] [Google Scholar]
- 59.Olney JW, Farber NB. Glutamate receptor dysfunction and schizophrenia. . Arch Gen Psychiatry. 1995;52:998–1007. doi: 10.1001/archpsyc.1995.03950240016004. [DOI] [PubMed] [Google Scholar]
- 60.Tsai G, Coyle JT. Glutamatergic mechanisms in schizophrenia. . Annu Rev Pharmacol Toxicol. 2002;42:165–179. doi: 10.1146/annurev.pharmtox.42.082701.160735. [DOI] [PubMed] [Google Scholar]
- 61.Javitt DC, Steinschneider M, Schroeder CE, Arezzo JC. Role of cortical N-methyl-D-aspartate receptors in auditory sensory memory and mismatch negativity generation: implications for schizophrenia. . Proc Natl Acad Sci U S A. 1996;93:11962–11967. doi: 10.1073/pnas.93.21.11962. [DOI] [PMC free article] [PubMed] [Google Scholar]
- 62.Javitt DC, Jayachandra M, Lindsley RW, Specht CM, Schroeder CE. Schizophrenia-like deficits in auditory P1 and N1 refractoriness induced by the psychomimetic agent phencyclidine (PCP). . Clin Neurophysiol. 2000;111:833–836. doi: 10.1016/s1388-2457(99)00313-2. [DOI] [PubMed] [Google Scholar]
- 63.Umbricht D, Schmid L, Koller R, Vollenweider FX, Hell D, Javitt DC. Ketamine-induced deficits in auditory and visual context-dependent processing in healthy volunteers: implications for models of cognitive deficits in schizophrenia. . Arch Gen Psychiatry. 2000;57:1139–1147. doi: 10.1001/archpsyc.57.12.1139. [DOI] [PubMed] [Google Scholar]
- 64.Krystal JH, Karper LP, Seibyl JP, Freeman GK, Delaney R, Bremner JD, Heninger GR, Bowers MB, Jr, Charney DS. Subanesthetic effects of the noncompetitive NMDA antagonist, ketamine, in humans: psychotomimetic, perceptual, cognitive, and neuroendocrine responses. . Arch Gen Psychiatry. 1994;51:199–214. doi: 10.1001/archpsyc.1994.03950030035004. [DOI] [PubMed] [Google Scholar]
- 65.Krystal JH, Bennett A, Abi-Saab D, Belger A, Karper LP, D’Souza DC, Lipschitz D, Abi-Dargham A, Charney DS. Dissociation of ketamine effects on rule acquisition and rule implementation: possible relevance to NMDA receptor contributions to executive cognitive functions. . Biol Psychiatry. 2000;47:137–143. doi: 10.1016/s0006-3223(99)00097-9. [DOI] [PMC free article] [PubMed] [Google Scholar]
- 66.Heresco-Levy U, Javitt DC, Ermilov M, Mordel C, Silipo G, Lichtenstein M. Efficacy of high-dose glycine in the treatment of enduring negative symptoms of schizophrenia. . Arch Gen Psychiatry. 1999;56:29–36. doi: 10.1001/archpsyc.56.1.29. [DOI] [PubMed] [Google Scholar]
- 67.Javitt DC, Zylberman I, Zukin SR, Heresco-Levy U, Lindenmayer JP. Amelioration of negative symptoms in schizophrenia by glycine. . Am J Psychiatry. 1994;151:1234–1236. doi: 10.1176/ajp.151.8.1234. [DOI] [PubMed] [Google Scholar]
- 68.Tsai G, Yang P, Chung LC, Lange N, Coyle JT. D-serine added to antipsychotics for the treatment of schizophrenia. . Biol Psychiatry. 1998;44:1081–1089. doi: 10.1016/s0006-3223(98)00279-0. [DOI] [PubMed] [Google Scholar]
- 69.Slaghuis WL, Thompson AK. The effect of peripheral visual motion on focal contrast sensitivity in positive- and negative-symptom schizophrenia. . Neuropsychologia. 2003;41:968–980. doi: 10.1016/s0028-3932(02)00321-4. [DOI] [PubMed] [Google Scholar]
- 70.Schwartz BD, McGinn T, Winstead DK. Disordered spatiotemporal processing in schizophrenics. . Biol Psychiatry. 1987;22:688–698. doi: 10.1016/0006-3223(87)90200-9. [DOI] [PubMed] [Google Scholar]
- 71.Chen Y, Levy DL, Sheremata S, Nakayama K, Matthysse S, Holzman PS. Effects of typical, atypical, and no antipsychotic drugs on visual contrast detection in schizophrenia. . Am J Psychiatry. 2003;160:1795–1801. doi: 10.1176/appi.ajp.160.10.1795. [DOI] [PubMed] [Google Scholar]
- 72.Keri S, Kelemen O, Benedek G, Janka Z. Vernier threshold in patients with schizophrenia and in their unaffected siblings. . Neuropsychology. 2004;18:537–542. doi: 10.1037/0894-4105.18.3.537. [DOI] [PubMed] [Google Scholar]
- 73.Stuve TA, Friedman L, Jesberger JA, Gilmore GC, Strauss ME, Meltzer HY. The relationship between smooth pursuit performance, motion perception and sustained visual attention in patients with schizophrenia and normal controls. . Psychol Med. 1997;27:143–152. doi: 10.1017/s0033291796004230. [DOI] [PubMed] [Google Scholar]
- 74.O’Donnell BF, Swearer JM, Smith LT, Nestor PG, Shenton ME, McCarley RW. Selective deficits in visual perception and recognition in schizophrenia. . Am J Psychiatry. 1996;153:687–692. doi: 10.1176/ajp.153.5.687. [DOI] [PubMed] [Google Scholar]
- 75.Rivadulla C, Sharma J, Sur M. Specific roles of NMDA and AMPA receptors in direction-selective and spatial phase-selective responses in visual cortex. . J Neurosci. 2001;21:1710–1719. doi: 10.1523/JNEUROSCI.21-05-01710.2001. [DOI] [PMC free article] [PubMed] [Google Scholar]
- 76.Bowen L, Wallace CJ, Glynn SM, Nuechterlein KH, Lutzker JR, Kuehnel TG. Schizophrenic individuals’ cognitive functioning and performance in interpersonal interactions and skills training procedures. . J Psychiatr Res. 1994;28:289–301. doi: 10.1016/0022-3956(94)90012-4. [DOI] [PubMed] [Google Scholar]
- 77.Braff DL, Saccuzzo DP. Effect of antipsychotic medication on speed of information processing in schizophrenic patients. . Am J Psychiatry. 1982;139:1127–1130. doi: 10.1176/ajp.139.9.1127. [DOI] [PubMed] [Google Scholar]
- 78.Cadenhead KS, Geyer MA, Butler RW, Perry W, Sprock J, Braff DL. Information processing deficits of schizophrenia patients: relationship to clinical ratings, gender and medication status. . Schizophr Res. 1997;28:51–62. doi: 10.1016/s0920-9964(97)00085-6. [DOI] [PubMed] [Google Scholar]
- 79.Harvey PD, Keefe RS, Moskowitz J, Putnam KM, Mohs RC, Davis KL. Attentional markers of vulnerability to schizophrenia: performance of medicated and unmedicated patients and normals. . Psychiatry Res. 1990;33:179–188. doi: 10.1016/0165-1781(90)90072-d. [DOI] [PubMed] [Google Scholar]
- 80.Brody D, Saccuzzo DP, Braff DL. Information processing for masked and unmasked stimuli in schizophrenia and old age. . J Abnorm Psychol. 1980;89:617–622. doi: 10.1037//0021-843x.89.5.617. [DOI] [PubMed] [Google Scholar]
- 81.Chen Y, Nakayama K, Levy DL, Matthysse S, Holzman PS. Psychophysical isolation of a motion-processing deficit in schizophrenics and their relatives and its association with impaired smooth pursuit. . Proc Natl Acad Sci U S A. 1999;96:4724–4729. doi: 10.1073/pnas.96.8.4724. [DOI] [PMC free article] [PubMed] [Google Scholar]
- 82.Keri S, Kelemen O, Benedek G, Janka Z. Different trait markers for schizophrenia and bipolar disorder: a neurocognitive approach. . Psychol Med. 2001;31:915–922. doi: 10.1017/s0033291701004068. [DOI] [PubMed] [Google Scholar]
- 83.Green MF, Nuechterlein KH, Breitmeyer B. Backward masking performance in unaffected siblings of schizophrenic patients: evidence for a vulnerability indicator [published erratum appears in Arch Gen Psychiatry 1997 Sep;54(9):846]. . Arch Gen Psychiatry. 1997;54:465–472. doi: 10.1001/archpsyc.1997.01830170091012. [DOI] [PubMed] [Google Scholar]
- 84.Braff DL. Impaired speed of information processing in nonmedicated schizotypal patients. . Schizophr Bull. 1981;7:499–508. doi: 10.1093/schbul/7.3.499. [DOI] [PubMed] [Google Scholar]