Abstract
Background
Myc-induced lymphoblastic B-cell lymphoma (LBL) in iMycEμ mice may provide a model system for the study of the mechanism by which human MYC facilitates the initiation and progression of B cell and plasma cell neoplasms in human beings. We have recently shown that gene-targeted iMycEμ mice that carry a His6-tagged mouse Myc cDNA, MycHis, just 5' of the immunoglobulin heavy-chain enhancer, Eμ, are prone to B cell and plasma cell tumors. The predominant tumor (~50%) that arose in the iMycEμ mice on the mixed genetic background of segregating C57BL/6 and 129/SvJ alleles was LBL. The purpose of this study was to establish and characterize a cell line, designated iMycEμ-1, for the in-depth evaluation of LBL in vitro.
Methods
The morphological features and the surface marker expression profile of the iMycEμ-1 cells were evaluated using cytological methods and FACS, respectively. The cytogenetic make-up of the iMycEμ-1 cells was assessed by spectral karyotyping (SKY). The expression of the inserted MycHis gene was determined using RT-PCR and qPCR. Clonotypic immunoglobulin gene arrangements were detected by Southern blotting. The global gene expression program of the iMycEμ-1 cells and the expression of 768 "pathway" genes were determined with the help of the Mouse Lymphochip© and Superarray© cDNA micro- and macroarrays, respectively. Array results were verified, in part, by RT-PCR and qPCR.
Results
Consistent with their derivation from LBL, the iMycEμ-1 cells were found to be neoplastic IgMhighIgDlow lymphoblasts that expressed typical B-cell surface markers including CD40, CD54 (ICAM-1), CD80 (B7-1) and CD86 (B7-2). The iMycEμ-1 cells harbored a reciprocal T(9;11) and three non-reciprocal chromosomal translocations, over-expressed MycHis at the expense of normal Myc, and exhibited gene expression changes on Mouse Lymphochip© microarrays that were consistent with MycHis-driven B-cell neoplasia. Upon comparison to normal B cells using eight different Superarray© cDNA macroarrays, the iMycEμ-1 cells showed the highest number of changes on the NFκB array.
Conclusion
The iMycEμ-1 cells may provide a uniquely useful model system to study the growth and survival requirements of Myc-driven mouse LBL in vitro.
Background
Gene-targeted iMycEμ mice contain a single-copy mouse MycHis (c-myc) cDNA that has been inserted in opposite transcriptional orientation in the mouse immunoglobulin heavy-chain gene cluster, Igh. The specific insertion site of the MycHis transgene is in the intervening region of the Igh joining gene locus, JH, and the intronic heavy-chain enhancer, Eμ. The inserted transgene encodes a C-terminal His6 tag that is useful to distinguish message and protein encoded by MycHis and normal Myc [1]. The iMycEμ mice provide a model system for the study of the molecular and oncogenic consequences of the human MYC- and mouse Myc-deregulating chromosomal t(8;14)(q24;q32) and T(12;15) translocations that are widely accepted as the crucial initiating oncogenic events in the great majority of human Burkitt lymphomas (BL) and mouse plasmacytomas, respectively [2]. Specifically, the iMycEμ mice mimic the type of t(8;14)(q24;q32) and T(12;15) translocation that is found in the endemic form of BL [3] and a subset (~20%) of IL-6 transgenic mouse plasmacytomas [4], respectively. We have recently shown that heterozygous transgenic iMycEμ mice on the mixed genetic background of segregating C57BL/6 and 129/SvJ alleles are genetically prone to mature B cell and plasma cell neoplasms, ~50% of which are IgM+ lymphoblastic B-cell lymphomas (LBL) [1]. We now report on a newly established LBL-derived cell line, iMycEμ-1, which was developed to study the growth and survival requirements of LBL in vitro.
Results and Discussion
Features of iMycEμ-1 cells
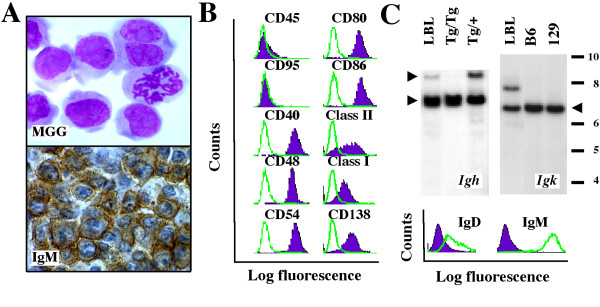
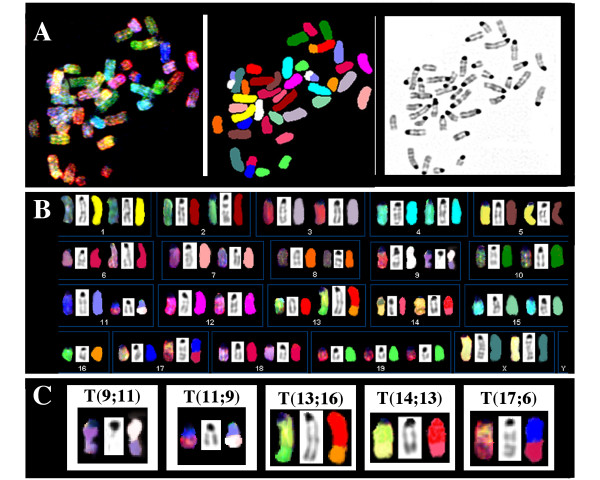
The iMycEμ-1 cell line, which demonstrated the typical cytological features of mouse LBL (Fig. 1A top), was derived from a primary IgM+LBL (Fig. 1A bottom) that exhibited moderate plasmacytic differentiation potential in situ (not shown). FACS analysis using a panel of antibodies to B cell surface markers (Fig. 1B) showed that iMycEμ-1 cells were positive for CD40, CD48, CD54, CD80/86 (B7-1/2) and CD138 (syndecan 1). Expression of class I and II MHC antigens and CD45 (B220) was detectable at low or very low levels, respectively, but CD95 (Fas) was absent. Treatment of iMycEμ-1 cells with antibody to CD40 led to the induction of Fas and upregulation of CD45 and CD54, activation markers CD80/86, and CD138, indicating that CD40 signaling was functional (Additional File 1). Southern blotting of genomic DNA from the LBL from which the cell line was derived demonstrated V(D)J rearrangement at the Ig heavy-chain and κ light chain loci (Fig. 1C top). The expression of surface IgMhighIgDlow by the derivative cell line was consistent with this and indicated that the rearrangement was productive (Fig. 1C bottom). SKY analysis of metaphase chromosomes from iMycEμ-1 cells (Fig. 2) uncovered four chromosomal translocations that took the form of a reciprocal T(9;11) exchange and three non-reciprocal exchanges: T(13;16), T(14;13) and T(17;6). Although it is unclear whether these translocations occurred during tumor development or establishment of the cell line [5], repeat karyotyping showed that the present iMycEμ-1 line is cytogenetically stable.
Figure 1.
Features of iMycEμ-1 cells. A, cytofuge specimen of cultured cells stained according to May-Grünwald-Giemsa (top). Tissue section of the LBL from which the cell line was derived after immunostaining for μ H-chain (bottom). B, B-cell surface marker expression evaluated by FACS in cells treated with specific antibodies (purple histograms) or isotype controls (green lines). C, H/L rearrangements and surface Ig expression. Southern blots of Igh (top left) and Igk (top right) rearrangements of the LBL from which the cell line was derived. Included as control is liver DNA from homozygous (Tg/Tg) or heterozygous (Tg/+) transgenic iMycEμ mice (left panel) or inbred C57BL/6 and 129SvJ mice (right panel). Recombination at the Igh locus was detected by the reduction of the normal, H chain-encoding upper fragment (upper arrowhead) in the face of comparable amounts of the mutated, MycHis-harboring lower fragment (lower arrowhead). Thus, the 6.2 kb long upper fragment was diminished in the LBL compared to the Tg/+ sample (and absent, as expected, in the Tg/Tg sample), whereas the MycHis-harboring lower fragment was comparable. The MycHis-bearing Igh locus cannot encode H chain because of the gene insertion. Recombination at the Igκ locus resulted in an enlarged fragment (~7.8 kb) compared to the germ line fragment that is indicated by the arrowhead pointing left. Detection of surface IgMhiIgDlow using FACS analysis (bottom).
Figure 2.
Spectral karyotype of iMycEμ-1 cells. A, representative metaphase chromosome spread in SKY display (left) and classification colors (center) and as an inverted DAPI image (right). B, complete, near-diploid tumor karyotype depicting each chromosome in SKY display (left) and classification (right) colors and after staining with DAPI (center): 38–40, XX, Del(4)(C4)[2], Del(6)(D2)[6], Der(9)T(9A4;11E2)[4], Der(11)T(11A4;9E4)[4], Del(12)[3], Der(13)T(13D11;16B5)[5], Der(14)T(14;13)[3], Der(17) T(17D;6D3)[5], +19[6]. The chromosomes are arranged in numerical order from left to right and top to bottom. C, chromosomal translocations that took the form of a reciprocal T(9;11) exchange (left) and three different non-reciprocal exchanges (right).
Gene expression profile of iMycEμ-1 cells on cDNA microarray
The Mouse Lymphochip, a microarray of hematopoietic mouse cDNA clones, provides a powerful tool to evaluate the similarity of primary mouse B cells, B-cell tumors, and tumor-derived cell lines at the level of global gene expression [6]. To compare the gene expression profile of LBL and iMycEμ-1 cells, RNA was obtained from primary B cells, fresh-frozen tumors and iMycEμ-1 cells. The RNA was labeled with Cy5-dUTP, and hybridized to the cDNA microarray spotted on a glass slide. An RNA control pool labeled with Cy3-dUTP was co-hybridized to the same array and used as a common denominator by which all samples were compared to one another. Further information on microarray make-up, analysis and data interpretation is available at: http://lymphochip.nih.gov/ShafferPCfactors/.
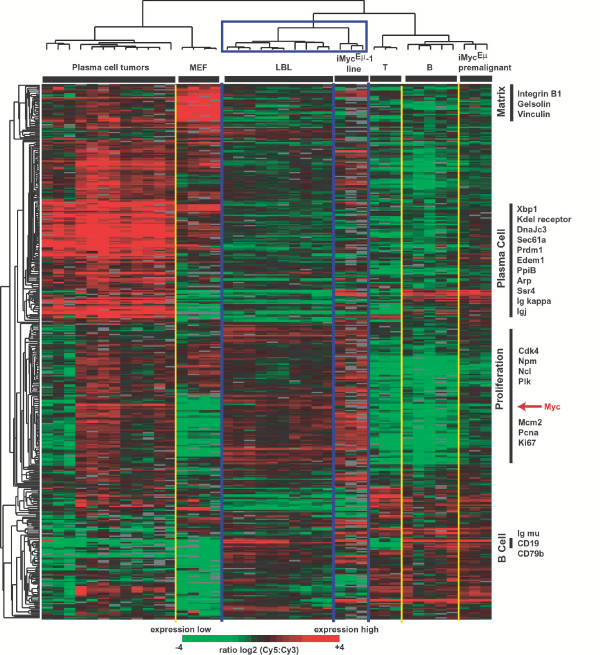
Three independent RNA samples of iMycEμ-1 cells and ten primary LBL were analyzed together with a collection of normal, resting mouse B cells and T cells, mouse embryonic fibroblasts (MEF), and peritoneal plasmacytomas that arose in pristane-treated BALB/c mice. A total of 414 well-characterized array elements that clustered across these samples based on gene expression patterns (Fig. 3) demonstrated a clear distinction of lymphoid and non-lymphoid cell types (B and T cells versus MEF), lymphocyte lineages (B versus T cells), and transformation- and development-associated differences within the B-cell lineage (normal B cells versus LBL and PCT). The gene expression profiles of LBL and iMycEμ-1 cells, which clustered in one tight group (Fig. 3 top, blue rectangle), exhibited a remarkable homogeneity. Compared to the plasmacytomas, LBL and iMycEμ-1 cells maintained many hallmark genes in the B cell signature (e.g., those encoding CD19, CD79 and μ heavy-chain) but under-expressed numerous genes in the plasma cell signature (e.g., Sec61, Ssr4 and DNAjc3) and matrix signature (e.g., those encoding vinculin, gelsolin and integrin B1) [7,8]. A more detailed analysis of the plasma cell signature revealed that in contrast to Xbp1 and its target genes, the iMycEμ-1 cells expressed Prdm1 (Blimp1). This suggested that the cells underwent neoplastic transformation at the early stage of plasmacytic differentiation (Additional File 2).
Figure 3.
Similar gene expression profile of iMycEμ-1 cells and LBL using comparative cDNA microarray measurements. Relative gene expression levels are depicted according to the color scale shown below the cluster.
Myc expression in LBL and iMycEμ-1 cells
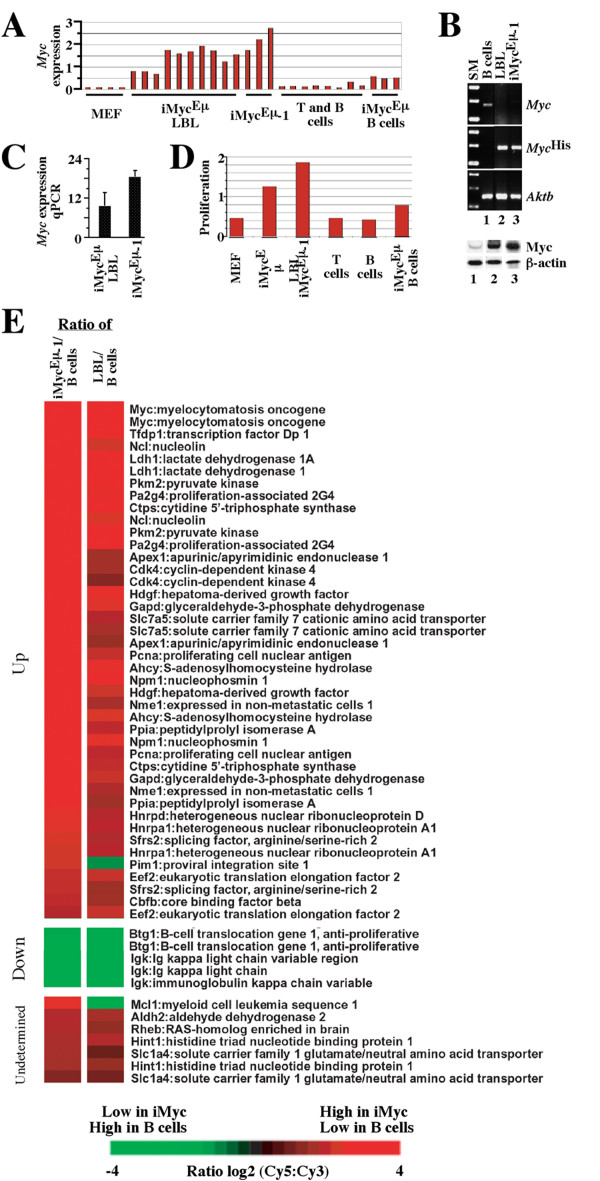
The expression levels of Myc, as measured by the arrays, was clearly elevated in LBL and iMycEμ-1, intermediate in "premalignant" B cells from tumor-free iMycEμ mice, and absent, as expected, in resting lymphocytes from normal mice (Fig. 4A). Because the inserted Myc cDNA in iMycEμ mice also encodes a C-terminal His6 tag, it is possible to distinguish message and protein encoded by MycHis and normal Myc. Allele-specific RT-PCR analysis of MycHis and Myc mRNA demonstrated that, in common with LBL, iMycEμ-1 cells expressed predominantly the transgene (Fig. 4B top, lanes 2–3). This pattern of suppression of the normal Myc gene [9] is also a feature of human B-cell lymphomas containing constitutively deregulated MYC [10]. Western blotting with an anti-Myc antibody detecting both MycHis and normal Myc proteins (Fig. 4B bottom) showed that LBL and iMycEμ-1 cells over-expressed Myc at comparable levels (lanes 2–3) relative to B splenocytes from non-transgenic littermates (lane 1). To compare the levels of Myc in LBL and iMycEμ-1 cells more precisely, we performed qPCR using Aktb mRNA levels as internal standard. The iMycEμ-1 cells expressed nearly twice as much Myc as the LBL (Fig. 4C). The levels of Myc also correlated with the expression of genes from the proliferation cluster when the gene expression from the proliferation signature, as defined in Figure 3, was averaged for each cell type. Proliferation gene expression was low in unstimulated cells (MEF and B/T cell samples), intermediate in pre-malignant B cells from iMycEμ mice, and upregulated in LBL and iMycEμ-1 (Fig. 4D).
Figure 4.
Myc expression and Myc-driven gene expression changes in iMycEμ-1 cells. A, expression of Myc in iMycEμ-1 cells, LBL, and normal controls. The average gene expression was calculated and plotted according to the microarray measurements shown in Figure 3. B, RT-PCR of Myc, MycHis and Aktb mRNA levels (top) and Western blotting of Myc protein (bottom) in normal B cells (lane 1), LBL from an iMycEμ mouse (lane 2), and the iMycEμ-1 cell line (lane 3; SM, size marker). C, real-time qPCR analysis of Myc mRNA levels in iMycEμ-1 and LBL cells. Mean values and standard deviations based on three independent iMycEμ-1 and five LBL samples are shown. D, expression of proliferation signature genes in iMycEμ samples and normal controls. The expression of genes that fall in the proliferation signature defined in Figure 3 was averaged for each cell population and plotted. E, differentially expressed Myc targets in iMycEμ-1 cells (left column) and LBL (right column) compared to normal resting B cells. Relative gene expression levels are depicted according to the color scale at the bottom. Gene designations and names are listed to the right.
Myc target genes in LBL and iMycEμ-1 cells
To further examine the contribution of the MycHis transgene to the gene expression profile of LBL and iMycEμ-1, we performed a statistical analysis (Student's T test) of genes differentially expressed between normal B cells versus LBL and iMycEμ-1 cells. A total of 122 array elements from Figure 3 were significantly differential in their expression when B cells were compared to iMycEμ-1 cells and LBL (p < 0.015, 1.5-fold minimal difference in average expression). The vast majority (97%) of these elements, many of them previously identified as proliferation-associated Myc targets http://www.myc-cancer-gene.org, behaved similarly in both the cell line and LBL (Fig. 4E). Twenty-four known Myc targets were up-regulated in the LBL and iMycEμ-1 cells (Ahcy, Apex1, Cbfb, Cdk4, Ctps, Eef2, Gapd, Hdgf, Hnrpa1, Hnrpd, Idh1, Myc, Ncl, Nme1, Npm1, Pa2g4, Pcna, Pim1, Pkm2, Ppia, Sfrs2Slc7a5, Tfdp1), two were down-regulated (Btg1, Igk), and five were undetermined as to the effect of Myc on their expression (Aldh2, Hint1, Mcl1, Rheb, Slc1a4). These findings were in accordance with the nature of LBL and iMycEμ-1 as Myc-driven B-cell tumors and firmly established the similarity of LBL and iMycEμ-1at the level of a single gene (Fig. 4A), a gene expression signature (Fig. 4D), and globally (Fig. 3).
Validation of gene expression changes in iMycEμ-1 cells
To further compare the gene expression profiles of LBL and iMycEμ-1, and validate the cDNA microarray results with an independent method, we used cDNA macroarrays on nylon membranes to assess the expression of selected "pathway" genes in LBL, iMycEμ-1 and normal B cells. Included in the analysis were RNA samples of iMycEμ-1 and LBL previously analyzed on the microarray. Freshly prepared RNA from normal, MACS purified, B220+ splenocytes were used as control. RNA samples were labeled with 32P-dUTP and individually hybridized to the macroarrays. Individual expression profiles were determined and compared with each other. Reproducible two-fold or higher changes in hybridization signal intensity were used as threshold for gene expression changes. Eight different macroarrays, each containing 96 genes involved in cell cycle regulation, apoptosis, cancer, signal transduction, stress and toxicity responses, and the NFκB and MAPK pathways, were used. The primary data set is depicted in Additional File 3.
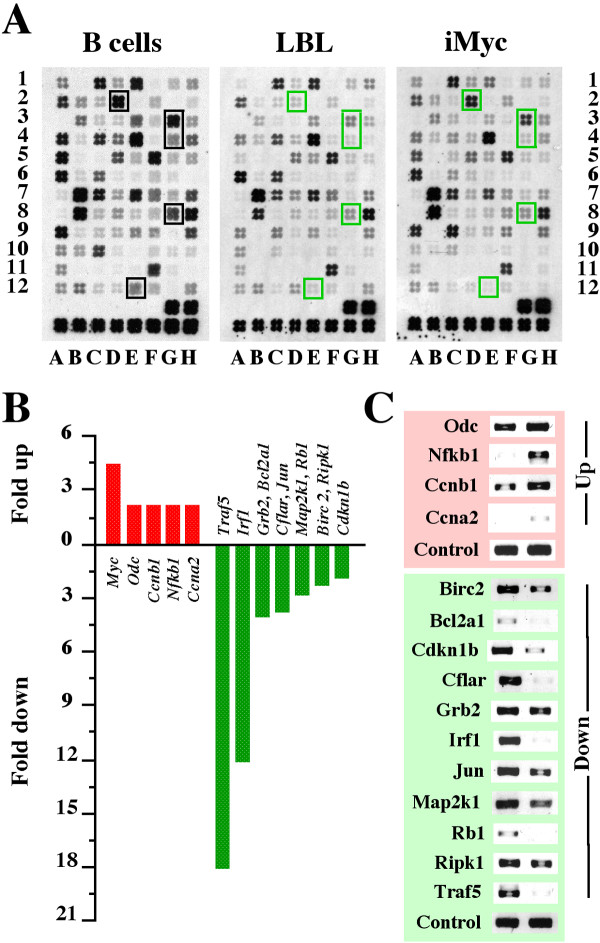
The changes on the macroarrays were remarkably consistent in LBL and iMycEμ-1 cells compared to B cells. This is illustrated in Figure 5A, using the apoptosis array as the example. Among a total of 768 genes present on eight different macroarrays, 121 (16%) genes were concordantly up- or down-regulated in LBL and iMycEμ-1 cells relative to B cells. The NFκB array showed the highest number of changes (n = 22) among the eight different macroarrays, followed by the MAPK (n = 19), cell cycle (n = 18) and apoptosis arrays (n = 17). The stress and toxicity array contained the lowest number of changes (n = 9). Altogether, down-regulated genes (83/121, 69%) outnumbered up-regulated genes (38/121, 31%) by a factor of 2.2. The presence of some genes on two or more arrays afforded an opportunity for additional quality control. Genes of that sort exhibited the same trend on different arrays, either up or down relative to normal B cells, thus adding confidence in the results. This is illustrated in Additional File 4 using one representative array each of iMycEμ-1 and normal B cells.
Figure 5.
Concordant gene expression changes in iMycEμ-1 cells and LBL compared to normal B cells. A, gene expression changes were assessed by comparative filter cDNA macroarray measurements using a representative apoptosis array of normal B cells (left), LBL (center) and iMycEμ-1 cells (right) as the example. Compared to B cells, LBL and iMycEμ-1 cells under-expressed Bcl2a1d (array position D2), Birc2 (G3), Cflar (G4), Ripk1 (G8) and Traf5 (E12; indicated by green squares). Additional File 3 shows four additional LBL arrays that exhibit the same changes. B, expression changes of 5 up-regulated and 11 down-regulated genes in iMycEμ-1 cells compared to normal B cells (see Additional File 6 for names, functions and groupings of these genes). Similar changes were seen when LBL and B cells were compared using cDNA macroarrays (not shown) or when iMycEμ-1 cells and/or LBL were compared to B cells using cDNA microarrays (Fig. 3; results not shown). C, verification of gene array results using RT-PCR. Shown are ethidium bromide-stained PCR fragments of the differentially regulated genes plotted in panel B except Myc, which was verified in the experiments presented in Figure 4A-C. The iMycEμ-1 and B-cell samples are shown in the right and left lane, respectively. Up and down regulated genes are depicted on the pink and green background, respectively.
Among the differentially regulated genes that exhibited concordant changes in LBL and iMycEμ-1 cells relative to normal B cells on both the gene micro- and macroarrays were 16 genes that were selected for further confirmation using semi-quantitative RT-PCR (Additional File 5). These genes were of particular interest to us because of possible follow-up studies on signaling pathways in iMycEμ-1 cells. Eleven of the 16 genes were down regulated (Bcl2a1, Birc2, Cflar, Cdkn1b, Grb2, Irf1, Jun, Map2k1, Rb1, Ripk1, Traf5) and five genes were up regulated (Ccna2, Ccnb, Myc, Nfkb1, Odc). Figure 5B presents average quantitative changes on the macroarrays when iMycEμ-1 cells were compared with normal B cells. These changes were readily confirmed by RT-PCR in all cases (Fig. 5C) except Myc, which was not included because it was confirmed in previous work (Fig. 4).
Conclusion
This study reports the molecular, cytogenetic and morphological features of a stable cell line, designated iMycEμ-1. The iMycEμ-1 cells are surface IgMhighIgDlow and cytogenetically stable using SKY. The cells express high levels of the inserted MycHis transgene and exhibit a global gene expression profile consistent with that of MycHis-driven B-cell neoplasia. The iMycEμ-1 cells may be useful for in-depth studies on the growth and survival requirements of MycHis-driven mouse B-cell tumors in vitro. Specifically, the cells may facilitate the elucidation of the signal transduction pathways that appear to maintain high Myc protein levels in mouse LBL [1]. These studies may results in new approaches to treat and prevent MYC-induced B cell and plasma cell neoplasms in human beings.
Methods
Mouse lymphomas and derivation of iMycEμ-1 cells
Transgenic iMycEμ mice develop a high incidence of B cell and plasma cell tumors with LBL being the predominant phenotype (8). Tumor samples obtained at autopsy were fixed in formalin for later histopathology or frozen for later preparation of protein, DNA and RNA. Histological criteria used for diagnosing mouse LBL are detailed elsewhere [11]. Highly enriched splenic B cells were prepared from C57BL/6 mice using CD45R (B220) microbeads and MACS separation columns (Miltenyi Biotec, Auburn, CA). All mice were maintained under Animal Study Protocol LG-028. The iMycEμ-1 cell line was derived from a LBL and maintained at 37°C and 5% carbon dioxide in RPMI 1640 medium supplemented with 10% fetal calf serum, 200 mM L-glutamine, 50 μM 2-mercaptoethanol and penicillin/streptomycin (Gibco-BRL, Rockville, MD).
Characterization of iMycEμ-1 cells
For cytological analysis, cytofuge specimens were stained according to May-Grünwald-Giemsa and inspected by microscopy. For detection of chromosomal aberrations, cells were analyzed by spectral karyotyping (SKY) as previously described [12]. For flow cytometry, single-cell suspensions were stained and analyzed on a FACSort® using the CELLQuest™ software (BD Pharmingen, San Diego, CA). Rat anti-mouse CD16/CD32 was used to block FcγII and FcγIII receptors. Antibodies to mouse CD45 (catalog number 553076), CD80 (553766), Fas (CD90, 554255), CD86 (553689), CD40 (553787), I-Ab (MHC class II, 553551), H-2Kb (MHC class I, 553569), CD48 (557483), CD54 (553250), CD138 (553712), IgD (553438) and IgM (53519) were purchased from BD Biosciences. For the evaluation of surface marker changes upon ligation of CD40, cells were incubated with rat anti-mouse CD40 (553787) using 3.5 μg antiboy per 5 × 10⁵ cells. For Southern blot hybridization of clonotypic V(D)J rearrangements, genomic DNA (20 μg) was digested with BamHI and EcoRI, fractionated on a 0.7 % agarose gel, transferred to a nylon membrane, and crosslinked under UV light. Following pre-hybridization (Hybrisol I, Intergen) at 42°C, the membrane was hybridized to a 1.5-kb HindIII/EcoRI fragment of Igh spanning JH2 and Eμ or to a 1.1-kb Cκ probe, which was generated by PCR using a primer pair obtained from Dr. Michael Kuehl (NCI): 5'-GAT GCT GCA CCA ACT GTA TCC A-3' and 5'-GGG GTG ATC AGC TCT CAG CTT-3'. Probes were labeled with [32P]-CTP using a random priming kit.
Allele-specific RT-PCR of Myc and MycHis mRNA
For semi-quantitative determination of Myc and MycHis mRNA, total RNA was isolated using TRIzol (Sigma, St. Louis, MO, USA). Double stranded cDNA was synthesized from 1 μg of total RNA, using the AMV Reverse Transcriptase kit (Roche, Indianapolis, IN). A common 5' primer for both MycHis and Myc (5'-TCT CCA CTC ACC AGC ACA AC-3') was combined with a specific 3' primer for MycHis (5'-CCT CGA GTT AGG TCA GTT TA-3') and Myc (5'-ATG GTG ATG GTG ATG ATG AC-3') to distinguish the two messages. Thermal cycling conditions were as follows: 95°C for 5 min followed by 20 cycles of amplification at 57°C, 72°C and 95°C, each for 1 min. PCR amplification of Aktb cDNA was performed as control using the following primer pair: 5'-GCA TTG TTA CCA ACT GGG AC-3' and 5'-AGG CAG CTC ATA GCT CTT CT-3'. PCR products were analyzed by electrophoresis in 1% agarose gel and visualized by staining with ethidium bromide.
Real-time qPCR of Myc mRNA
For quantitative Taqman RT-PCR of Myc (Myc plus MycHis), total RNA was isolated from cells using TRIzol Reagent (Invitrogen). Serial dilutions of input RNA (100 ng - 1.56 ng) were analyzed in triplicates using the ABI PRISM 7900HT sequence detector system, primers, probes, and the Taqman One-Step RT-PCR Master Mix Reagents kit, all purchased from Applied Biosystems. The reaction mixture was held at 48°C for 30 min for reverse transcription of RNA into cDNA. This was followed by incubation at 95°C for 10 min to activate the Taq polymerase. PCR amplification of cDNA was performed for 40 cycles using the following cycling conditions: denaturing for 15 s at 95°C and annealing and extending for 1 min at 60°C. All samples were tested in triplicates, and average values were used for quantification. Analysis was performed using SDS v2.1 software (Applied Biosystems) according to the manufacturer's instruction. Aktb was used as internal reference gene. The comparative CT method (ΔΔCT) was used for quantification of gene expression.
Gene microarray hybridization and analysis
cDNA made from total RNA (50 μg) from each tumor, primary cell sample, or iMycEμ-1 cells was labeled with cyanine 5-conjugated dUTP (Cy5). cDNA made from pooled mouse cell line RNA (50 μg) was labeled with cyanine 3-conjugated dUTP (Cy3) and used as reference. Microarray hybridizations were performed on Mouse Lymphochip microarrays [7]. After washing, the slides were scanned using an Axon GenePix 4.0 scanner (Axon Instruments Inc., Union City, CA). After normalization, those elements that failed to meet confidence criteria based on signal intensity and spot quality were excluded from analysis. In addition, data were discarded for any gene for which measurements were missing on >30% of the arrays or were not sequence-verified. The Cy5:Cy3 intensity ratios of the remaining spots were log2 transformed. To compare normal samples, hierarchical cluster analysis was performed using the Gene Cluster and Treeview programs [8].
Gene macroarray hybridization and analysis
The relative mRNA expression of genes involved in regulation of apoptosis, cell cycle progression, NFkB signaling, and cellular stress and toxicity responses was analyzed with GEArray (SuperArray Inc., Bethesda, MD) according to the manufacturer's protocol. Cells were treated for 24 hrs with 0.4 mM and 1 mM CDDO-Im, respectively, followed by preparation of total RNA using TriReagent (Sigma). Five μg from each sample were reverse transcribed into 32P-labeled cDNA using MMLV reverse transcriptase (Promega, Madison, WI) and 32P-dCTP (NEN, Boston, MA). The resulting cDNA probes were hybridized to gene-specific cDNA fragments spotted in quadruplicates on the GEArray membranes. After stringent washing of the arrays, the signal of the hybridized spots was measured with a STORM PhosphorImager (Molecular Dynamics, Sunnyvale, CA) and normalized to the signal of the housekeeping gene Gapd. Array results on six CDDO-Im inducible genes were validated using semi-quantitative RT-PCR.
Gene array validation using RT-PCR
For semi-quantitative determination of mRNA levels, total RNA was isolated and double stranded cDNA was synthesized as described above for Myc. Information on PCR primers and thermal cycling conditions is available in Additional File 6. PCR products were analyzed by electrophoresis in 1% agarose gel and visualized by staining with ethidium bromide.
Competing interests
The author(s) declare that they have no competing interests.
Authors' contributions
Seong-Su Han determined gene expression using Superarray© cDNA macroarrays. Arthur L. Shaffer and Louis M. Staudt evaluated global gene expression profiles using Mouse Lymphochip© microarrays. Liangping Peng performed FACS studies. Seung-Tae Chung harvested and transplanted tumors, cultured cells, and prepared histo- and cytological specimens. Sungho Maeng and Jae-Hwan Lim validated gene array results using RT-PCR and qPCR. Joong-Su Kim performed Southern analysis and Nicole McNeil and Thomas Ried performed SKY analysis. Siegfried Janz designed the study and wrote and approved the article.
Supplementary Material
FACS histograms.
Heat map (panel A) and bar graph (panel B).
Images of cDNA gene arrays.
Images of cDNA gene arrays (panel A) and gene table (panel B).
Gene list.
PCR primers and conditions.
Acknowledgments
Acknowledgements
We thank Wendy duBois, Nicole Wrice and Vaishali Jarral, NCI, for assistance with the in vivo studies; Michael Kuehl, NCI, for the Cκ probe; R. Eric Davis, NCI, for helpful scientific discussions; and Beverly A. Mock, NCI, for support. This research was supported by the Intramural Research Program of the NIH, NCI, CCR.
Contributor Information
Seong Su Han, Email: hanse@mail.nih.gov.
Arthur L Shaffer, Email: as275s@nih.gov.
Liangping Peng, Email: lp242e@NIH.GOV.
Seung Tae Chung, Email: chungs@mail.nih.gov.
Jae Hwan Lim, Email: jhlim@andong.ac.kr.
Sungho Maeng, Email: sm446f@NIH.GOV.
Joong Su Kim, Email: joongsu@kribb.re.kr.
Nicole McNeil, Email: mcneiln@mail.nih.gov.
Thomas Ried, Email: tr92o@NIH.GOV.
Louis M Staudt, Email: lstaudt@mail.nih.gov.
Siegfried Janz, Email: sj4s@nih.gov.
References
- Park SS, Kim JS, Tessarollo L, Owens JD, Peng L, Han SS, Tae Chung S, Torrey TA, Cheung WC, Polakiewicz RD, McNeil N, Ried T, Mushinski JF, Morse HC, Janz S. Insertion of c-Myc into Igh induces B-cell and plasma-cell neoplasms in mice. Cancer Res. 2005;65:1306–1315. doi: 10.1158/0008-5472.CAN-04-0268. [DOI] [PubMed] [Google Scholar]
- Boxer LM, Dang CV. Translocations involving c-myc and c-myc function. Oncogene. 2001;20:5595–5610. doi: 10.1038/sj.onc.1204595. [DOI] [PubMed] [Google Scholar]
- Joos S, Falk MH, Lichter P, Haluska FG, Henglein B, Lenoir GM, Bornkamm GW. Variable breakpoints in Burkitt lymphoma cells with chromosomal t(8;14) translocation separate c-myc and the IgH locus up to several hundred kb. HumMolGenet. 1992;1:625–632. doi: 10.1093/hmg/1.8.625. [DOI] [PubMed] [Google Scholar]
- Kovalchuk AL, Kim JS, Park SS, Coleman AE, Ward JM, Morse HC, Kishimoto T, Potter M, Janz S. IL-6 transgenic mouse model for extraosseous plasmacytoma. Proc Natl Acad Sci USA. 2002;99:1509–1514. doi: 10.1073/pnas.022643999. [DOI] [PMC free article] [PubMed] [Google Scholar]
- Coleman AE, Schröck E, Weaver Z, du Manoir S, Yang F, Ferguson-Smith MA, Ried T, Janz S. Previously hidden chromosome aberrations in T(12;15)-positive BALB/c plasmacytomas uncovered by multicolor spectral karyotyping. Cancer Res. 1997;57:4585–4592. [PubMed] [Google Scholar]
- Alizadeh A, Eisen M, Davis RE, Ma C, Sabet H, Tran T, Powell JI, Yang L, Marti GE, Moore DT, Hudson JRJ, Chan WC, Greiner T, Weisenburger D, Armitage JO, Lossos I, Levy R, Botstein D, Brown PO, Staudt LM. The lymphochip: a specialized cDNA microarray for the genomic-scale analysis of gene expression in normal and malignant lymphocytes. Cold Spring Harb Symp Quant Biol. 1999;64:71–78. doi: 10.1101/sqb.1999.64.71. [DOI] [PubMed] [Google Scholar]
- Shaffer AL, Yu X, He Y, Boldrick J, Chan EP, Staudt LM. BCL-6 represses genes that function in lymphocyte differentiation, inflammation, and cell cycle control. Immunity. 2000;13:199–212. doi: 10.1016/S1074-7613(00)00020-0. [DOI] [PubMed] [Google Scholar]
- Shaffer AL, Shapiro-Shelef M, Iwakoshi NN, Lee AH, Qian SB, Zhao H, Yu X, Yang L, Tan BK, Rosenwald A, Hurt EM, Petroulakis E, Sonenberg N, Yewdell JW, Calame K, Glimcher LH, Staudt LM. XBP1, downstream of Blimp-1, expands the secretory apparatus and other organelles, and increases protein synthesis in plasma cell differentiation. Immunity. 2004;21:81–93. doi: 10.1016/j.immuni.2004.06.010. [DOI] [PubMed] [Google Scholar]
- Penn LJ, Brooks MW, Laufer EM, Land H. Negative autoregulation of c-myc transcription. EMBO J. 1990;9:1113–1121. doi: 10.1002/j.1460-2075.1990.tb08217.x. [DOI] [PMC free article] [PubMed] [Google Scholar]
- Eick D, Polack A, Kofler E, Lenoir GM, Rickinson AB, Bornkamm GW. Expression of P0- and P3-RNA from the normal and translocated c-myc allele in Burkitt's lymphoma cells. Oncogene. 1990;5:1397–1402. [PubMed] [Google Scholar]
- Morse HC, Anver MR, Fredrickson TN, Haines DC, Harris AW, Harris NL, Jaffe ES, Kogan SC, MacLennan IC, Pattengale PK, Ward JM. Bethesda proposals for classification of lymphoid neoplasms in mice. Blood. 2002;100:246–258. doi: 10.1182/blood.V100.1.246. [DOI] [PubMed] [Google Scholar]
- Liyanage M, Coleman A, du Manoir S, Veldman T, McCormack S, Dickson RB, Barlow C, Wynshaw-Boris A, Janz S, Wienberg J, Ferguson-Smith MA, Schröck E, Ried T. Multicolour spectral karyotyping of mouse chromosomes. NatGenet. 1996;14:312–315. doi: 10.1038/ng1196-312. [DOI] [PubMed] [Google Scholar]
Associated Data
This section collects any data citations, data availability statements, or supplementary materials included in this article.
Supplementary Materials
FACS histograms.
Heat map (panel A) and bar graph (panel B).
Images of cDNA gene arrays.
Images of cDNA gene arrays (panel A) and gene table (panel B).
Gene list.
PCR primers and conditions.


