Abstract
Bacteria, γ-subclass of Proteobacteria, Vibrio-Photobacterium, Vibrio vulnificus, Vibrio cholerae-Vibrio mimicus, and Vibrio cincinnatiensis in water samples collected from the Choptank River in Chesapeake Bay from 15 April to 16 December 1996 were enumerated using a fluorescent oligonucleotide direct-counting (FODC) procedure. FODC results obtained using a Bacteria taxon-specific probe ranged from one-third the number of to the same number as that obtained by the acridine orange direct count (AODC) procedure. The abundance of individual taxa (per liter) ranged from 0.25 × 10¹⁰ to 2.6 × 10¹⁰ Bacteria, 0.32 × 10⁸ to 3.1 × 10⁸ γ-Proteobacteria, 0.2 × 10⁸ to 2.1 × 10⁸ Vibrio-Photobacterium, 0.5 × 10⁷ to 10 × 107 V. vulnificus, 0.2 × 10⁶ to 6 × 10⁶ V. cholerae-V. mimicus, and 0.5 × 10⁵ to 8 × 10⁵ V. cincinnatiensis. The occurrence of all taxa monitored in this study was higher in summer; however, these taxa made up a larger proportion of the Bacteria when the water temperature was low. Large fluctuations in species abundance as well as in percent composition of Vibrio-Photobacterium occurred from week to week, indicating that localized blooms of these taxa occur. The cross-Choptank River transect sample profile of V. vulnificus and V. cholerae-V. mimicus varied significantly in abundance, and trans-Choptank River transect samples revealed a patchy distribution.
The Bacteria represent a functionally diverse group of organisms known to mediate important ecosystem processes, e.g., N2 fixation, nitrification, and pathogenesis (4, 17, 21, 31). However, the structure and dynamics of aquatic microbial communities are relatively poorly understood, in part due to difficulties in identifying the taxonomic and/or functional composition of microorganisms in situ (1, 11, 13, 28). Historically, microbial ecologists have relied on direct microscopic observation of stained cells, i.e., direct counting (18, 26). However, the abundance of the total bacterioplankton in an ecosystem, measured by direct staining, imparts no information concerning the frequency of occurrence and/or activity of any given taxon. This shortcoming has essentially relegated bacterial processes to a “black box” in ecosystem models until recently, when the application of molecular genetic methods to microbial ecology became possible.
Because of the as yet unsolved problems associated with culturing all bacteria present in a given sample, the contribution of a single bacterial species or taxonomic group to the microbial ecology of the aquatic environment has not been determined. Therefore, culture-based methods impart a bias toward increasing the importance of microorganisms that are easily cultured (1, 8, 11, 12, 33, 37). Molecular techniques that do not require culture for enumeration and/or detection, i.e., fluorescent oligonucleotide direct counting (FODC) (2, 3, 14), identification by gene probe and/or PCR (6, 7, 25), or estimation of total microbial diversity using denaturing gradient gel electrophoresis (10, 32) or low-molecular-weight RNA gels (5, 19), have opened new avenues of research.
The main mechanisms for regulation of bacterial populations in the aquatic environment include availability of substrates (nutrients), temperature, bacterivory, and lysis by viruses (36, 38, 39, 40). A strongly positive correlation has been reported between bacterial abundance and phytoplankton abundance in the open ocean (a habitat where pelagic phytoplankton may provide the principal source of nutrient for bacteria). Such correlations have been interpreted to indicate that substrate availability is the most important factor in limiting the size and abundance of bacterial populations. However, in coastal ocean, estuary, and freshwater ecosystems, a correlation between phytoplankton and bacterial abundance has not been observed (34), suggesting that in eutrophic habitats, bacterial abundance, production, and growth rates are regulated by physical and chemical factors in addition to nutrient availability.
The focus of this study was on the ecology of selected bacterial species in the Choptank River to determine whether any fluctuation in abundance could be related to seasonality, as well as variation in bacterial species composition of the bacterioplankton. Fluorescent in situ hybridization with specific probes was used to identify and enumerate total Bacteria, γ-Proteobacteria, Vibrio-Photobacterium, Vibrio cholerae-V. mimicus, V. vulnificus, and V. cincinnatiensis, thereby providing taxonomic data and bypassing the shortcomings of culture methods.
MATERIALS AND METHODS
Bacterial concentration by filtration and centrifugation.
V. vulnificus ATCC 27562 was grown to mid-log phase in tryptic Soy Broth (TSB) (Difco, Detroit, Mich.) amended with 1% NaCl and incubated at 35°C with gentle shaking. Triplicate 0.1-ml samples were inoculated into 10 ml of 0.22-μm-pore-size filter-sterilized (FS) 0.9% NaCl solution. From each sample, a 0.5-ml subsample was collected to estimate the total number of bacteria before concentration. A 4.5-ml subsample for concentration by filtration (filtration through 0.2-μm-pore-size 25-mm-diameter cellulose nitrate filters followed by resuspension in 450 μl of FS 0.9% NaCl) and a 4.5-ml sample for centrifugation concentration (centrifugation at 16,000 × g for 15 min followed by resuspension in 450 μl of FS 0.9% NaCl) were also used for acridine orange direct counting (AODC) (18, 26). The 0.5-ml unconcentrated samples and 4.5-μl subsamples of each concentrate were brought to 1 ml with FS phosphate-buffered saline (PBS) and stained with acridine orange (final concentration, 0.01%) for at least 3 min in the dark at room temperature. The sample was brought to a final volume of 2 ml with FS PBS and filtered through 0.22-μm-pore-size black polycarbonate filters (Nuclepore, Pleasanton, Calif.). Filters were washed twice with 3 to 5 ml of FS PBS to remove excess dye and mounted with low-fluorescence immersion oil, and then cells were counted using a Zeiss microscope equipped with filter set 10 (Carl Zeiss, Jena, Germany). At least 10 fields and 300 cells were counted per filter (22). Mean numbers of cells per milliliter were compared by a one-way analysis of variance (ANOVA) to determine significant differences.
The experiment was repeated using Choptank River water, to ensure that the natural-water samples yielded results similar to those obtained for laboratory cultures. A 200-ml water sample, collected on 26 June 1996, was divided into two 100-ml subsamples. One subsample was concentrated by centrifugation, and the other was concentrated by filtration. Following concentration, both were resuspended in 1 ml of FS PBS. The total numbers of bacteria in each sample and in an unconcentrated water sample were determined by AODC, with 100-μl subsamples examined in triplicate. ANOVA, with least-significant-difference mean comparisons, was used to determine differences between the mean number of cells per milliliter of unconcentrated Choptank River water and the mean number of cells in each concentrated sample (35).
Field collection.
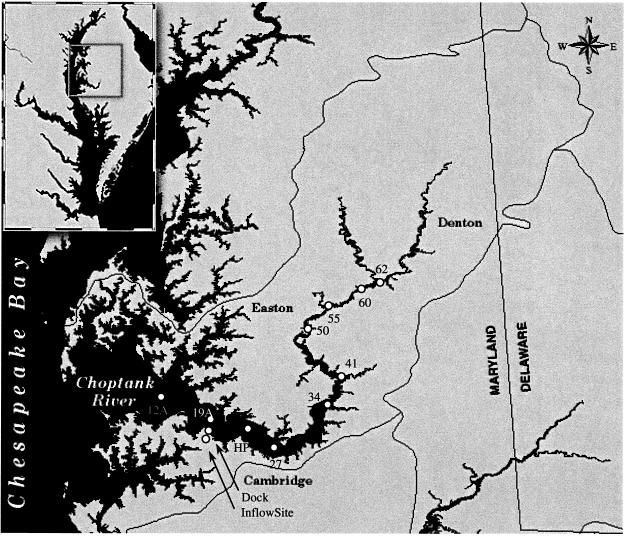
Field sampling was conducted on the Choptank River at the dock at the Horn Point Laboratory, Cambridge, Md., from 15 April to 16 December 1996 (Fig. 1). Samples were collected weekly between 15 April and 20 October 1996 and biweekly thereafter. Prior to 1 June 1996, samples were collected at sunrise. After 1 June, samples were collected within 1 h of high tide on the rising tide, so that samples were collected when tidal mixing was greatest, reducing the chance of bacteria entering the collection site by flowing in from the tidal marsh. Water samples were collected from approximately 15 cm below the surface in a sterile 1-liter sidearm flask. Sterile Tygon tubing was attached both to a sidearm flask and inside a wire enclosure (15 by 15 by 15 cm, 1-cm2 mesh) to exclude gelatinous zooplankton. A vacuum was applied to the sidearm flask by using a hand pump, and 1 liter of water was collected and transferred to a sterile glass bottle for transport to the laboratory and immediate processing.
FIG. 1.
Collection stations, including cross- and trans-Choptank River transect stations.
Cross-river transect sampling was also carried out on 20 June and 12 August 1996 at three collection sites: (i) at an inflow site, where water entered and left a tidal marsh area; (ii) off the dock; and (iii) at navigational buoy 19A, in the main channel of the Choptank River (Fig. 1). At the inflow and navigation buoy 19A sites, salinity, dissolved-O2 concentration, air and water temperature, and turbidity were measured. Physical and chemical parameters were also measured at the dock site.
Samples were collected at 10 locations along the main salinity axis of the Choptank River (trans-Choptank River transect), between navigational buoys 12A and 62 (Fig. 1). Water samples were collected in 250-ml sterile polypropylene bottles at a depth of approximately 15 cm and stored on ice until processed.
Physical parameters.
Air and water temperature, dissolved-O2 concentration, tidal height (relative to the top of the pier), salinity, turbidity, and NO3−, NH4+, and PO43− concentrations were recorded. The dissolved-O2 concentration was measured using a YSI model 51B meter (Yellow Springs Instruments, Yellow Springs, Ohio), and salinity was measured using an S-10 refractometer (Atago). All other parameters were measured using a DR/2000 direct-reading spectrophotometer kit (Hach Co., Loveland, Colo.). Nitrate concentration (by cadmium reduction), ammonium concentration (by salicylate method), orthophosphate concentration, and turbidity were measured using the DR/2000 direct-reading spectrophotometer kit as specified by the manufacturer.
Concentration of bacteria in environmental samples.
For FODC determination, a 100-ml water sample was filtered through a 64-μm Nytex screen to remove large particles and concentrated to 2 ml by centrifugation at ×16,000 and resuspended in 2 ml of FS Choptank River water. After centrifugation, Tween 80 (10 μg ml−1) and 6 ml of freshly filtered 4% (wt/vol in PBS) paraformaldehyde were added. Samples were incubated on ice for 4 h with gentle shaking and sonicated (10 W) for 30 to break up large aggregates and to release bacterial cells (41). Samples were filtered through a 25-μm-pore-size Nytex screen. The screen was washed twice, using 10 ml of FS Choptank River water. Paraformaldehyde and Tween 80 were removed by centrifugation (16,000 × g for 15 min), and the samples were resuspended in 1 ml of 1:1 2X FODC hybridization buffer (0.9 M NaCl, 0.1% sodium dodecyl sulfate) and 100% ethanol. All samples were stored (<1 month) at −20°C until used for enumeration by an Epics II flow cytometer (Coulter Corp., Miami, Fla.).
Total bacterial counts for each of the concentrated water samples and the unconcentrated water samples collected at the first sampling of each month were made using AODC.
Concentration of bacteria.
Because there were no significant differences in the mean number of individual species and their respective AODC values in filtration concentrated or centrifugation concentrated samples, it was concluded that filtration and centrifugation were equally effective in concentrating the bacteria from the samples. The samples used in this study were concentrated by centrifugation.
Preparation of probes.
The 16S rRNA sequences of all Vibrio spp. included in the Ribosomal Database Project (RDP) (version 4.0), (27, 29) were used to determine nucleotide sequences appropriate for genus-specific probes for Vibrio-Photobacterium and for species-specific probes targeting V. cholerae-V. mimicus and V. cincinnatiensis. Vibrio 16S rRNA sequences were downloaded from the RDP to Phyloprobe software (supplier available through RDP), and the software was used to search for nucleotide sequences approximately 20 to 25 bases in length that were unique to each of the Vibrio spp. Species- and genus-level probe sequences were further compared to the entire RDP (version 5.0; both aligned and unaligned) (29) to ensure that each probe sequence was not shared by any other bacterial species in the database. Potential stable hairpin loop and 5′-5′ dimer formation by the probes were evaluated (15, 16).
Probe specificity.
Probe specificity, i.e., hybridization only to the target species, was determined using dot blot hybridization. American Type Culture Collection (ATCC) type strains and, where possible, multiple environmental isolates of Vibrio spp. and Aeromonas caviae 15468, A. hydrophila 7966, A. hydrophila 15467, A. media 33907, A. punctara 15468, A. salmonicida 14174, A. salmonicida 27013, Photobacterium angustum 25915, P. leignathi 25521, Comamonas acidovorans 15668, and Escherichia coli were immobilized onto nitrocellulose. Bacteria were grown on marine agar or triptic-soy agar (TSA) at the ATCC-recommended incubation temperature, starting with cultures maintained in liquid nitrogen. Dot blots were prepared. Isolated colonies of cells were removed from the surface of the medium and suspended in 2× SSC (1× SSC is 0.15 NaCl plus 0.0 M sodium citrate) (approximately 109 cells ml−1), and 100-μl volumes were filtered through a 0.45-μm-pore-size nitrocellulose filter in one of the 96 wells of the bio-blotter. Dot blots were hybridized with Vib/Pho, Vcho/mim, Vcinc, Vhol, Vvul, Vmar, and Vang and detected with the colorimetric reagents in the Genius system, as described for determining the melting point.
Enumeration of bacterial taxa.
Total Bacteria (EUB338), γ-Proteobacteria (GAM), Vibrio and Photobacterium (Vib/Pho), V. cholerae-V. mimicus (Vcho/mim), V. cincinnatiensis (Vcinc), and V. vulnificus (Vvul3) were enumerated by FODC. For each probe, triplicate 5-μl (EUB338 and GAM), 25-μl (Vib/Pho), or 50-μl (species probes) samples of concentrated Choptank River water were separately added to 45 μl of hybridization buffer amended with formamide. For the Vib/Pho and species probes, 25- or 50-μl samples were concentrated to 5 μl by centrifugation (16,000 × g for 15 min). Each sample was prehybridized for 1 h at 46°C with shaking. Following prehybridization, 200 ng of fluorescein-labeled probe was added, and the mixture was hybridized overnight at 46°C with gentle shaking. Hybridization was stopped by addition of 950 μl of ice-cold FS PBS. The number of probe-positive cells was measured using a Epics II flow cytometer.
Data analysis.
ANOVA and regression analysis (linear and stepwise forward regression, model II) were used to determine relationships among bacterial abundance and physical and chemical parameters. Statistical analysis was done using SigmaStat software (version 3.0; Jandel Scientific, Corte Madera, Calif.). To equalize variance, bacterial abundance was natural-log transformed. The normality of transformed data was tested by the Komogorov-Smirnov test.
RESULTS
AODC of Choptank River water samples.
The total number of bacteria, measured by AODC, collected at the dock site between 15 April and 16 December 1996 ranged from 2.0 × 10⁹ to 24 × 109 cells liter−1. The largest total numbers of bacteria in the Choptank River water samples were obtained during the summer, and the smallest numbers were obtained during winter and early spring.
Bacterioplankton abundance in concentrated samples ranged from 64 to 93% of the total direct counts for the unconcentrated water samples. However, no more than 36% of the total number of bacteria was lost during any of the concentration procedures, with higher percentages of cells lost when early-spring and winter water samples were analyzed.
FODC of bacteria in Choptank River dock site samples.
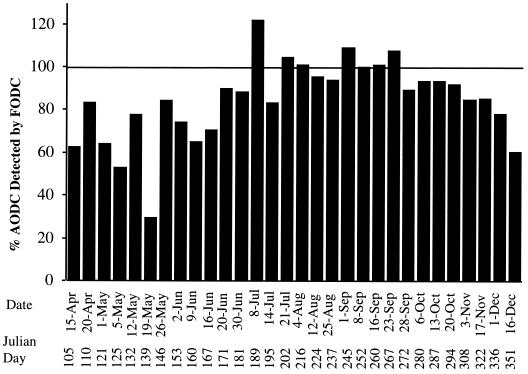
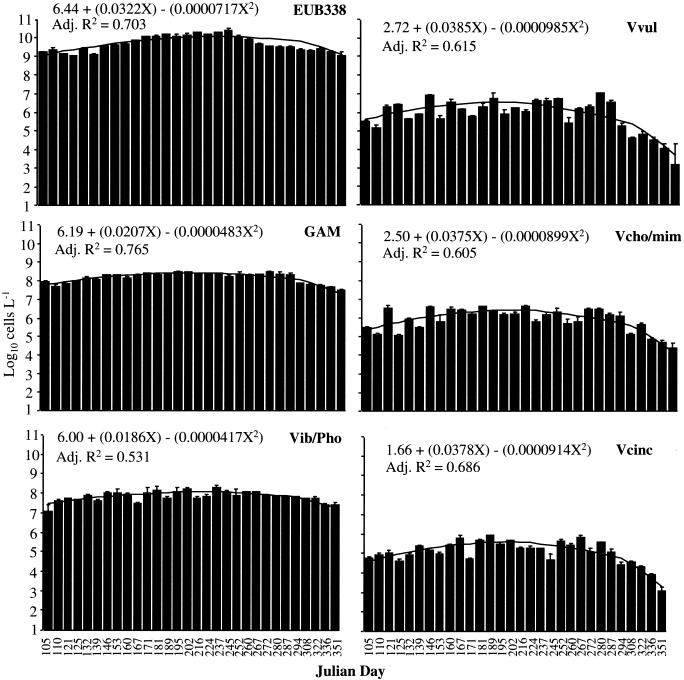
The abundance of Bacteria, estimated by FODC and using the EUB338 probe, was 53 to 120% of the number of cells obtained by AODC (except for a single low value [36%] on 19 May 1996) (Fig. 2). Total Bacteria in Choptank River water samples ranged from 1.0 × 10⁹ to 26 × 109 Bacteria liter−1 (Fig. 3). The largest numbers of Bacteria were observed during the summer months.
FIG. 2.
Percent EUB338 enumerated by FODC relative to total bacterial counts, obtained by AODC.
FIG. 3.
FODC of Choptank River water samples (bars) and second-order polynomial regression (line): EUB338, Bacteria; GAM, γ-Proteobacteria; Vib/Pho, Vibrio-Photobacterium; Vvul, V. vulnificus; Vcho/mim, V. cholerae-V. mimicus; Vcinc, V. cincinnatiensis. Error bars represent ±1 standard error of the mean (n = 3). Polynomial regressions were significant at P < 0.05, and X in the equation is the Julian day.
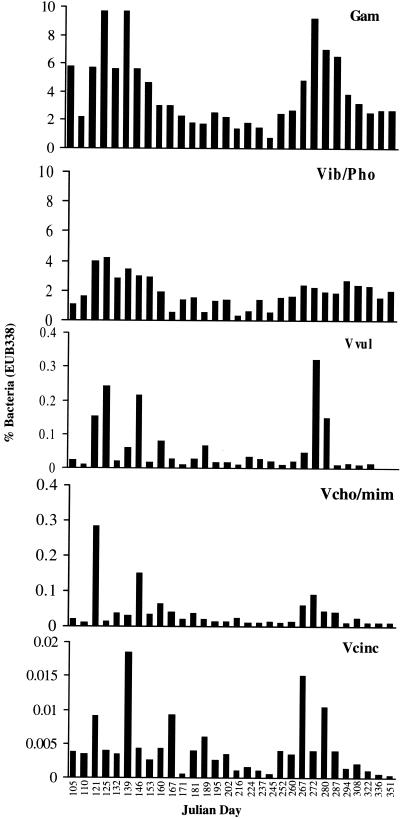
The number of γ-Proteobacteria ranged from 3.2 × 10⁷ to 31 × 107 liter−1, with larger numbers also occurring during the summer months (Fig. 4). Members of this group comprised approximately 1 to 10% of the total Bacteria, with a greater percent composition in the spring and fall.
FIG. 4.
Percent of total Bacteria made up of γ-Proteobacteria (GAM), Vibrio-Photobacterium (Vib/Pho), V. vulnificus (Vvul), V. cholerae-V. mimicus (Vcho/mim), and V. cincinnatiensis (Vcinc).
Numbers of Vibrio-Photobacterium ranged from 1.7 × 10⁷ to 21 × 107 liter−1 (Fig. 4), with significant week-to-week variation relative to the higher taxa. A seasonal pattern was noted, with greater numbers detected in the summer. The genera Vibrio and Photobacterium comprised 0.5 to 4% of the total Bacteria (Fig. 4), with the highest percentage (4%) found during spring and fall and the lowest found during summer.
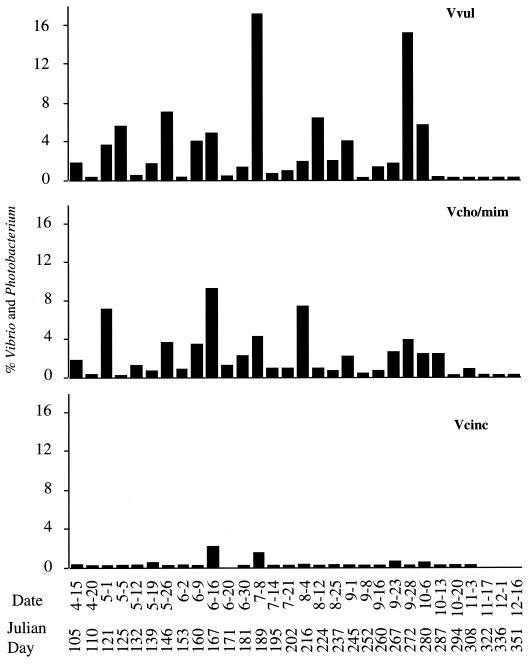
V. vulnificus numbers ranged from 1.3 × 10⁴ to 1.1 × 10⁷ liter−1, with the largest numbers found during the summer (Fig. 4). This species was never completely absent from samples examined in this study. However, in the fall, when water temperatures dropped below 15°C, the number of V. vulnificus organisms was very small. V. vulnificus comprised 0.02 to 0.3% of Bacteria and was a major component of the total Vibrio-Photobacterium group, comprising 1 to 18%. There were two dominant peaks of V. vulnificus, the first in July and the second in September. Otherwise, V. vulnificus comprised approximately 1 to 6% of Vibrio-Photobacterium.
V. cholerae and V. mimicus numbers ranged from 3.2 × 10⁴ to 4.3 × 10⁶ liter−1, with sharp peaks and significant variation among samples. These species comprised 0.01 to 0.3% of Bacteria (Fig. 4) and 1 to 5% of Vibrio-Photobacterium, except during May and June, when they formed a larger component of the bacterioplankton (Fig. 5).
FIG. 5.
Percent total Vibrio and Photobacterium made up of V. vulnificus (Vvul), V. cholerae-V. mimicus (Vcho/mim), and V. cincinnatiensis (Vcinc).
V. cincinnatiensis was present in much smaller numbers than the other Vibrio species, ranging from 1.1 × 10³ to 8.4 × 10⁵ liter−1, with the highest counts being found in July and September. Except for the 16 June and 7 July 1996 samples, this species comprised less than 2.5% of Vibrio-Photobacterium, and it never comprised more than 0.02% of Bacteria.
Relationship of taxon-abundance to physico-chemical parameters.
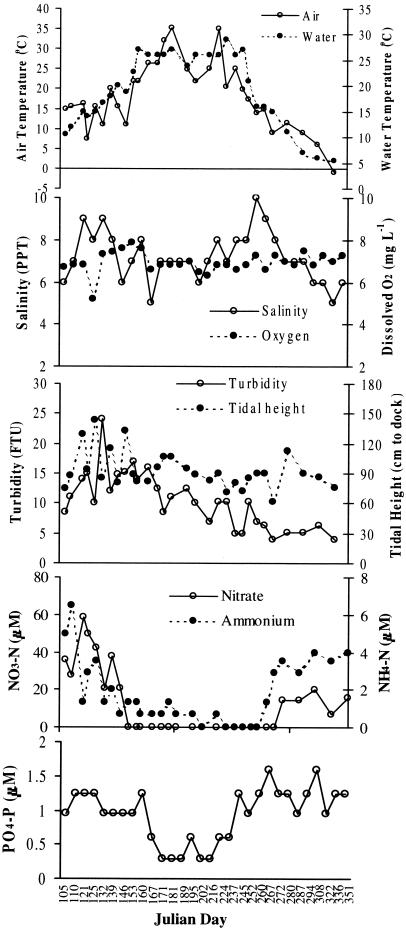
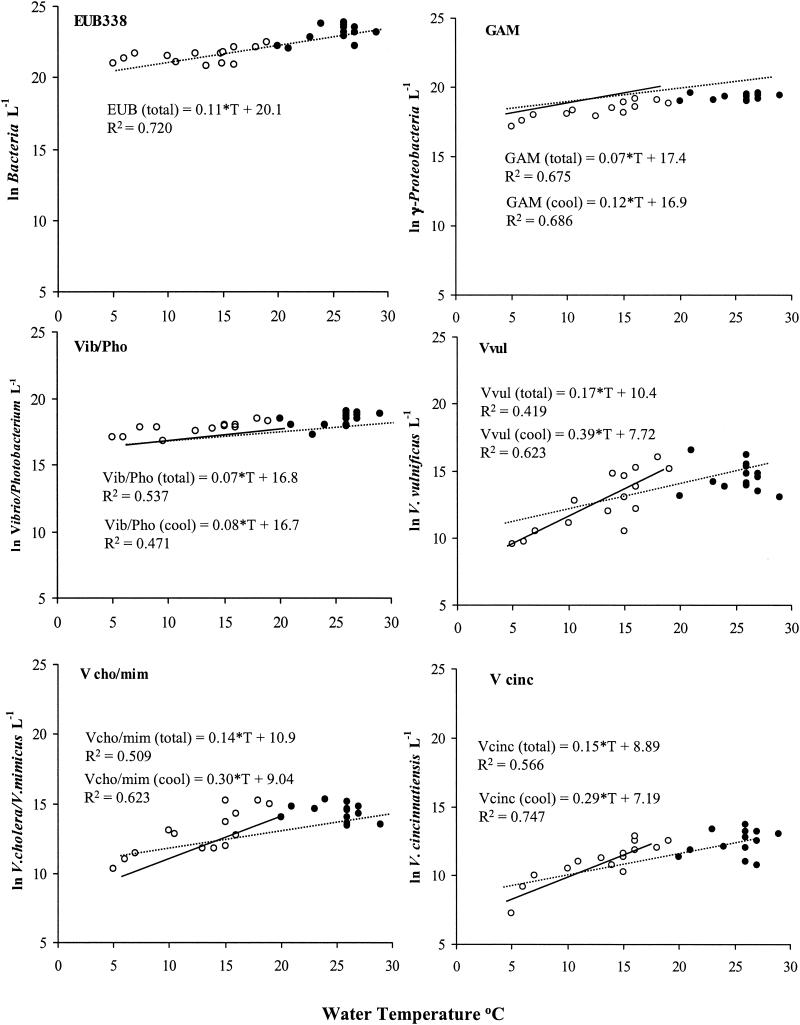
The physical and chemical parameters measured in this study are shown in Fig. 6. An increase in water temperature was associated with increased bacterial population sizes (Fig. 7). However, other factors had a significant effect on bacterial abundance as well. Stepwise forward linear regressions for each variable were calculated, and adjusted coefficients of determination (r2) of the significant regressions are given in Table 1. An increase in the adjusted r2 for the linear regression for water temperature was observed, when the nitrate concentration (Bacteria), dissolved-O2 concentration (Vibrio-Photobacterium), and tide height (V. vulnificus and V. cholerae-V. mimicus) were included. Nitrate concentration was negatively correlated with numbers of Bacteria, while water temperature, dissolved-O2 concentration, and tide height were positively correlated. Linear regression of abundance with water temperature yielded adjusted r2 values of 0.419 to 0.720, and the percent increase in the adjusted r2, achieved by adding other parameters, was 8 to 24% (Table 1).
FIG. 6.
Seasonal variation of physical parameters: water temperature, air temperature, salinity, turbidity, tidal height, dissolved O2, nitrate, ammonium, and phosphate.
FIG. 7.
Scatter diagram of natural logarithm-transformed numbers of cells per liter of Choptank River water with water temperature. Also, regression lines of significant linear regressions of water temperature with population size are shown. The dotted line represents regression for all data collected, and the solid line represents regression for data collected when the water temperature was <20°C. None of the taxa showed significant regression for data collected when the water temperature was ≥20°C. EUB338, total Bacteria; GAM, total γ-Proteobacteria; Vib/Pho, total Vibrio-Photobacterium; Vvul, total V. vulnificus; Vcho/mim, total V. cholerae-V. mimicus; Vcinc, total V. cincinnatiensis.
TABLE 1.
Adjusted r2 and percent improvement of r2 from forward stepwise linear regressions of bacterial abundance with physicochemical parameters
| Probea |
r2 and % improvement for:
|
|||
|---|---|---|---|---|
| Water temp | Nitrate concnb | Dissolved-O2 concn | Tidal height | |
| EUB338 | 0.720 | 0.804 (9.2%) | NSc | NS |
| GAM | 0.675 | NS | NS | NS |
| Vib/Pho | 0.537 | NS | 0.583 (7.9%) | NS |
| Vvul | 0.419 | NS | NS | 0.509 (17.7%) |
| Vcho/mim | 0.509 | NS | NS | 0.672 (24.3%) |
| Vcinc | 0.566 | NS | NS | NS |
EUB338 detects Bacteria; GAM detects γ-Proteobacteria; Vib/Pho detects Vibrio-Photobacterium; Vvul detects V. vulnificus; Vcho/mim detects V. cholerae-V. mimicus; Vcinc detects V. cincinnatiensis.
Nitrate concentration was negatively correlated with abundance, while water temperature, dissolved-O2 concentration, and tidal height were positively correlated with abundance.
NS, not significant at 0.05; salinity, orthophosphate, ammonium, and turbidity did not significantly improve the regression line for any of the probes.
The slope of the regression for bacterial abundance with temperature at three temperature ranges (all, <20°C, and ≥20°C) is given in Fig. 7. For all taxa, an increase in the slope was observed only when the water temperature was <20°C. For Bacteria, temperature was a significant factor with respect to abundance.
Transects across the Choptank River.
Few significant differences were detected in the spatial distribution of taxa in the Choptank River, and no significant differences were noted in picoplankton, Bacteria, γ-Proteobacteria, or V. cincinnatiensis mean abundance between the inflow, dock, and navigation buoy 19A sites. However, V. vulnificus abundance was significantly lower at the dock site in June 1996 and at the inflow site in August 1996. The number of V. cholerae-V. mimicus organisms was smaller at the dock site in August 1996.
Transects down the Choptank River.
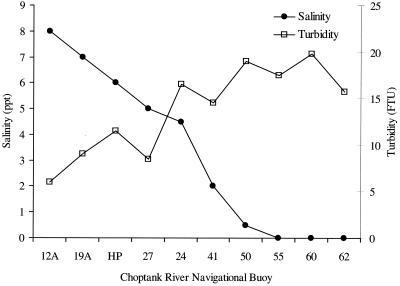
Salinity was higher in the lower part of the Choptank River and ranged from 0 to 8‰. Water temperature varied only slightly, by approximately 1°C (26 to 27°C) over the transect. Turbidity was higher at the upper river station and ranged from 6 to 20 FTU (Fig. 8).
FIG. 8.
Salinity and turbidity measured at trans-river transect stations. Salinity (ppt), parts per thousand; FTU, formazan turbidity unit.
γ-Proteobacteria, Vibrio-Photobacterium, V. cholerae-V. mimicus, and V. cincinnatiensis numbers did not differ significantly (P < 0.05) along the transect. The total Bacteria distribution was patchy, with significant differences but without clear trends. V. vulnificus was present in significantly smaller cell numbers in water samples collected at the upper river sites than in those collected at the midriver sites.
DISCUSSION
Bacterial species diversity and composition measured in situ has been reported to differ from results obtained by culture-based methods (8, 11, 12, 33, 37). This finding has given culture-independent methods an advantage in microbial ecology.
Bacteria present in environmental water samples routinely are concentrated, either by filtration or centrifugation, to ensure accurate cell counts. In extremely oligotrophic environments, tangential-flow filtration and hollow-core filtration have been used to concentrate bacteria for in situ analysis (8, 12). For relatively eutrophic waters like the Choptank River, the focus of the study reported here, microbial abundance rarely is less than 109 bacteria liter−1. In this study, neither filtration nor centrifugation resulted in a significant loss of bacterial cells, as determined by AODC.
When bacteria are grown in a nutrient-rich medium and incubated under optimum conditions, large cells are more common. However, bacteria grown in a rich medium (TSB, 1% NaCl) may be less likely than cells from the environment to produce extracellular structures for attachment to surfaces such as filters (23, 24).
Total picoplankton abundance per liter for Choptank River water concentrated by either filtration or centrifugation, compared to total picoplankton in unconcentrated Choptank River water, was significantly lower after concentration by filtration than after concentration by centrifugation. Centrifugation yielded a slight decrease in the mean number of cells compared to AODC measurements of unconcentrated samples, but the results were not statistically significant.
Bacteria in the natural environment tend to be less metabolically active than bacteria in laboratory cultures. Consequently, bacteria in environmental samples may fail to emit a visible fluorescent signal following hybridization. To determine if a significant portion of Bacteria in the Choptank River were detected by FODC, the Bacteria count (determined by FODC with the EUB338 probe) was compared with the AODC results. In theory, the largest possible number of Bacteria in an environmental sample is estimated by AODC. In this study, the FODC and AODC estimates of Bacteria abundance were in good agreement, indicating that Bacteria in the Choptank River maintain sufficient ribosomes per cell for FODC detection and also do comprise a dominant portion of the bacterioplankton.
Less than 10% of the total Bacteria detected in situ were members of the γ-Proteobacteria. In other aquatic systems, a majority of Bacteria belong to the β- and α-Proteobacteria as well as other Bacteria divisions (phyla) (1, 8, 30). This low total percentage of members of the γ-Proteobacteria in the Bacteria implies that even in the moderately eutrophic Choptank River, culture-based methods overestimate the relative abundance of easily cultured members of the γ-Proteobacteria. This is probably explained, in part, because members of this group readily adapt to the high-nutrient conditions of laboratory culture conditions.
Vibrio and Photobacterium were found in this study to be a major fraction of the γ-Proteobacteria. In the Choptank River, these two genera comprised 15 to 80% of the γ-Proteobacteria. This is not surprising since Vibrio and Photobacterium are autochthonous to estuarine environments. Because these genera include human and fish pathogens, the information obtained here on their seasonal abundance is significant.
V. cholerae and V. vulnificus (and to a lesser extent V. cincinnatiensis) are human pathogens and, from the results of our studies, are widely distributed in the estuarine and coastal waters of the Chesapeake Bay. V. vulnificus is a commensal of oysters, a relationship that can have a severe economic impact when its numbers are large enough to cause oyster bed closures (9, 20).
V. vulnificus, V. cholerae-V. mimicus, and V. cincinnatiensis comprised a smaller percentage of the total Bacteria; this is not surprising, considering the high species diversity of aquatic ecosystems (5, 19). Nevertheless, V. vulnificus and V. cholerae/V. mimicus were present in large total numbers during the summer months, and these Vibrio species comprised a major portion of the total Vibrio-Photobacterium genera.
The week-to-week variation in the percent composition of Bacteria demonstrated by Vibrio-Photobacterium and the other species included in this study was much greater than for the total γ-Proteobacteria, suggesting that the lower phylogenic taxa are affected by external factors more rapidly and perhaps more sensitively than the domain as an entity; i.e., fluctuation in the levels of individual bacterial species in an estuary may be significant throughout the year.
Regression lines for temperature and cell abundance were significant for all groups of bacteria examined in this study. The slope of the regression line at the species level was two or three times greater than for the Vibrio-Photobacterium, γ-Proteobacteria or Bacteria. There are Vibrio-Photobacterium species which are adapted to growth at cooler temperatures (e.g., Vibrio logei and Vibrio marinus). Therefore, these “cool-weather” bacterial species would be affected by temperatures opposite to those affecting “warm weather” species. These results support the hypothesis of Shiah (34) that temperature controls the bacterial abundance in the Choptank River during the nonsummer months while substrate limitation is more important in controlling bacterial abundance in summer. The improvement in the adjusted r2 when tidal height was included in the regression formula for V. vulnificus and V. cholerae-V. mimicus suggests that tidal transport and/or resuspension of sediments could be an important parameter in the total abundance of these bacteria. In this study, samples were collected during the rising tide to isolate the inflow effects from the nearby salt marsh, and during this tidal period, there was increased transport from the mouth of the Choptank River to the collection site. Furthermore, during this tidal period, resuspension of sediments was greater.
There were no significant differences in total numbers of Bacteria, γ-Proteobacteria, Vibrio-Photobacterium, or V. cincinnatiensis between or among the three cross-river transect sites. However, there were significant differences in total numbers of V. cholerae-V. mimicus and V. vulnificus, but no clear trends were observed. V. vulnificus numbers were significantly smaller at the dock site in June 1996 at the Buoy 19A site in August 1996, while V. cholerae/V. mimicus numbers were smaller at the dock site on 12 August 1996. The lack of a clear trend for these species indicates a patchy distribution.
Trans-Choptank River transect results also revealed patchy distribution, with little or no significant difference in the numbers of γ-Proteobacteria, Vibrio-Photobacterium, V. cholera-V. mimicus, or V. cincinnatiensis. The lack of a significant difference in the abundance of V. cincinnatiensis along the transect was unexpected, since it typically is isolated from freshwater ecosystems. However, the few microbial ecology studies of V. cincinnatiensis that have been done to date suggest that this species is present in freshwater and brackish waters. In this study, V. cincinnatiensis was present in larger numbers in the upper river sites, where the water is lower in salinity, but the difference was not significant. Nonetheless, this species should be considered a brackish-water species based on the results of this and other studies reported to date.
The patchy distribution of bacterial species in the water samples collected in this study is important. The tendency for these species to show spatial and temporal variability is a very important consideration for management policies that may be based on periodic sampling to determine the total number of a given species at a single site. In this study, the distance from inflow site to the dock site was less than 150 m; however, even over this short distance, there was a significant difference in the abundance of V. vulnificus between the two sites. The data do allow the conclusion that there is a relatively homogeneous distribution of taxa along the main salinity axis of the Choptank River over a wide range of both turbidity and salinity. Future studies will address whether these transported cells remain metabolically active and competitive.
Acknowledgments
We gratefully acknowledge support of NIH grants 1RO1A139129-01 and RO1 NRO4527-01A1. We also thank the University of Maryland Center for Environmental Science Horn Point Laboratory for generous use of laboratory facilities.
William VanHeukelem provided invaluable technical assistance. We also thank Kathleen Cone for generating graphics used in Fig. 1.
REFERENCES
- 1.Alfreider, A., J. Pernthaler, R. Amann, B. Sattler, F.-O. Glöckner, A. Wille, and R. Psenner. 1996. Community analysis of the bacterial assemblages in the winter cover and pelagic layer of a high mountain lake by in situ hybridization. Appl. Environ. Microbiol. 62:2138-2144. [DOI] [PMC free article] [PubMed] [Google Scholar]
- 2.Amann, R. I., B. J. Binder, R. J. Olson, S. W. Chisholm, R. Devereux, and D. Stahl. 1990. Combination of 16S rRNA-targeted oligonucleotide probes with flow cytometry for analyzing mixed microbial populations. Appl. Environ. Microbiol. 56:1919-1925. [DOI] [PMC free article] [PubMed] [Google Scholar]
- 3.Amann, R. I., W. Ludwig, and K.-H. Schleifer. 1995. Phylogenetic identification and in situ detection of individual microbial cells without cultivation. Microbiol. Rev. 59:143-169. [DOI] [PMC free article] [PubMed] [Google Scholar]
- 4.Atlas, R. M., and R. Bartha. 1987. Microbial ecology: fundamentals and application. Benjamin/Cummings Publishing Co., Inc., Menlo Park, Calif.
- 5.Bidle, K. D., and M. Flecher. 1995. Comparison of free-living and particle-associated bacterial communities in the Chesapeake Bay by stable low-molecular-weight RNA analysis. Appl. Environ. Microbiol. 61:944-952. [DOI] [PMC free article] [PubMed] [Google Scholar]
- 6.Brauns, L., M. C. Hudson, and J. D. Oliver. 1991. Use of polymerase chain reaction in detection of culturable and nonculturable Vibrio vulnificus cells. Appl. Environ. Microbiol. 57:2651-2655. [DOI] [PMC free article] [PubMed] [Google Scholar]
- 7.Coleman, S. S., and J. D. Oliver. 1996. Optimization of conditions for the polymerase chain reaction amplification of DNA from culturable and nonculturable cells of Vibrio vulnificus. FEMS Microbiol. Ecol. 19:127-132. [Google Scholar]
- 8.DeLong, E. F., D. G. Franks, and A. L. Alldredge. 1993. Phylogenetic diversity of aggregate-attached vs. free-living marine bacterial assemblages. Limnol. Oceanogr. 38:924-934. [Google Scholar]
- 9.Desenclos, J.-C. A., K. C. Klontz, L. E. Wolfe, and S. Hoecherl. 1991. The risk of Vibrio illness in the Florida raw oyster eating population, 1981-1988. Am. J. Epidemiol. 134:290-297. [DOI] [PubMed] [Google Scholar]
- 10.Ferris, M. J., G. Muyzer, and D. M. Ward. 1996. Denaturing gradient gel electrophoresis profiles of 16S rRNA defined populations inhabiting a hot spring microbial mat community. Appl. Environ. Microbiol. 62:340-346. [DOI] [PMC free article] [PubMed] [Google Scholar]
- 11.Fuhrman, J. A., K. McCallum, and A. A. Davis. 1993. Phylogenetic diversity of subsurface marine microbial communities from the Atlantic and Pacific Oceans. Appl. Environ. Microbiol. 59:1294-1302. [DOI] [PMC free article] [PubMed] [Google Scholar]
- 12.Giovannoni, S. J., T. B. Britschgi, C. L. Moyer, and K. G. Fields. 1990. Genetic diversity in the Sargasso Sea bacterioplankton. Nature 345:60-63. [DOI] [PubMed] [Google Scholar]
- 13.Giovannoni, S. J., T. D. Mullins, and K. G. Fields. 1995. Microbial diversity in oceanic systems: rRNA approaches to the study of unculturable microbes, p. 217-248. In I. Joint (ed.), Molecular ecology of aquatic microbes. Springer Verlag KG, Berlin, Germany.
- 14.Heidelberg, J. F., K. R. O'Neill, D. Jacobs, and R. R. Colwell. 1993. Enumeration of Vibrio vulnificus on membrane filters with a fluorescently labeled oligonucleotide probe specific for Kingdom-level 16S rRNA sequences. Appl. Environ. Microbiol. 59:3474-3476. [DOI] [PMC free article] [PubMed] [Google Scholar]
- 15.Heidelberg, J. F. 1997. Seasonal abundance of bacterioplankton populations of Bacteria, gamma proteobacteria, Vibrio/Photobacterium, Vibrio vulnificus, Vibrio cholerae/Vibrio mimicus, and Vibrio cincinnatiensis associated with zooplankton in the Choptank River, Maryland. Ph.D. dissertation. University of Maryland, College Park.
- 16.Heidelberg, J. F., K. B. Heidelberg, and R. R. Colwell. 2002. Bacteria of the γ-Subclass Proteobacteria associated with zooplankton in Chesapeake Bay. Appl. Environ. Microbiol. 68:5498-5507. [DOI] [PMC free article] [PubMed] [Google Scholar]
- 17.Hobbie, J. E., and T. E. Ford. 1993. A perspective on the ecology of aquatic microbes, p. 1-15. In T. E. Ford (ed.), Aquatic microbiology: an ecological approach. Blackwell Scientific Publishing, Oxford, United Kingdom.
- 18.Hobbie, J. E., J. Daley, and S. Jasper. 1977. Use of Nucleopore filters for counting bacteria by fluorescence microscopy. Appl. Environ. Microbiol. 33:1225-1228. [DOI] [PMC free article] [PubMed] [Google Scholar]
- 19.Höfle, M. G. 1992. Bacterioplankton community structure and dynamics after large-scale release of nonindigenous bacteria as revealed by low molecular weight RNA analysis. Appl. Environ. Microbiol. 58:3387-3394. [DOI] [PMC free article] [PubMed] [Google Scholar]
- 20.Hoge, C. W., D. Watsky, R. N. Peeler, J. P. Libonati, E. Israel, and J. G. Morris, Jr. 1989. Epidemiology and spectrum of Vibrio infections in a Chesapeake Bay community. J. Infect. Dis. 160:985-993. [DOI] [PubMed] [Google Scholar]
- 21.Joklik, W. K., H. P. Willett, D. B. Amos, and C. M. Wilfert (ed.). 1988. Zinsser microbiology, 19th ed., Appleton & Lange, Norwalk, Conn.
- 22.Kirchman, D., J. Sigda, R. Kapuscinski, and R. Mitchell. 1982. Statistical analysis of the direct count method for enumerating bacteria. Appl. Environ. Microbiol. 44:376-382. [DOI] [PMC free article] [PubMed] [Google Scholar]
- 23.Kirchman, D. L. 1993. Particulate detritus and bacteria in marine environments, p. 321-341. In T. E. Ford (ed.), Aquatic microbiology: an ecological approach. Blackwell Scientific Publishing, Oxford, United Kingdom.
- 24.Kjelleberg, S., K. B. G. Flärdh, T. Nyström, and D. J. W. Moriarty. 1993. Growth limitation and starvation of bacteria, p. 289-320. In T. E. Ford (ed.), Aquatic microbiology: an ecological approach. Blackwell Scientific Publishing, Oxford, United Kingdom.
- 25.Knight, I. T., S. Shults, C. W. Kaspar, and R. R. Colwell. 1990. Direct detection of Salmonella spp. in estuaries by using a DNA probe. Appl. Environ. Microbiol. 56:1059-1066. [DOI] [PMC free article] [PubMed] [Google Scholar]
- 26.Kogure, K., U. Simidu, and N. Taga. 1979. A tentative direct microscopic method for counting living marine bacteria. Can. J. Microbiol. 25:415-420. [DOI] [PubMed] [Google Scholar]
- 27.Larson, N., G. J. Olsen, B. L. Maidak, M. J. McCaughey, R. Overbeek, T. J. Macke, T. L. Marsh, and C. R. Woese. 1993. The ribosomal database project. Nucleic Acids Res. 1:3021-3023. [DOI] [PMC free article] [PubMed] [Google Scholar]
- 28.Lee, S. H., and J. A. Fuhrman. 1991. Species composition shift of confined bacterioplankton studied at the level of community DNA. Mar. Ecol. Prog. Ser. 79:195-201. [Google Scholar]
- 29.Maidak, B. L., G. J. Olsen, N. Larsen, R. Overbeck, M. J. McCaughey, and C. R. Woese. 1996. The ribosomal database project (RDP). Nucleic Acid Res. 24:82-85. [DOI] [PMC free article] [PubMed] [Google Scholar]
- 30.Mullins, T. D., T. B. Britschgi, R. L. Krest, and S. J. Giovannoni. 1995. Genetic comparisons reveal the same unknown bacterial lineages in Atlantic and Pacific bacterioplankton communities. Limnol. Oceanogr. 40:148-158. [Google Scholar]
- 31.Neidhardt, F. C., J. L. Ingraham, and M. Schaechter. 1990. Physiology of the bacterial cell: a molecular approach. Sinauer Associates, Inc., Sunderland, Mass.
- 32.Santegoeds, C. M., S. C. Nold, and D. M. Ward. 1996. Denaturing gradient gel electrophoresis used to monitor the enrichment cultures of aerobic chemoorganotrophic bacteria from a hot spring microbial mat. Appl. Environ. Microbiol. 62:3922-3928. [DOI] [PMC free article] [PubMed] [Google Scholar]
- 33.Schmidt, T. E., E. F. DeLong, and N. R. Pace. 1991. Analysis of marine picoplankton community by 16S rRNA gene cloning and sequencing. J. Bacteriol. 173:4371-4378. [DOI] [PMC free article] [PubMed] [Google Scholar]
- 34.Shiah, F.-K. 1993. Multi-scale variability of bacterioplankton abundance, production and growth rates in the temperate estuarine ecosystems. Ph.D. thesis. University of Maryland, College Park.
- 35.Steel, R. G. D., and J. H. Torrie. 1980. Principles and procedures of statistics: a biometrical approach, 2nd ed. McGraw-Hill Publishing Co., New York, N.Y.
- 36.Suttle, C. A. 1994. The significance of viruses to mortality in aquatic microbial communities. Microb. Ecol. 28:237-243. [DOI] [PubMed] [Google Scholar]
- 37.Suzuki, M. T., M. S. Rappé, Z. W. Haimberger, H. Winfield, N. Adair, J. Ströbel, and S. J. Giovannoni. 1997. Bacterial diversity among small-subunit rRNA gene clones and cellular isolates from the same seawater sample. Appl. Environ. Microbiol. 63:983-989. [DOI] [PMC free article] [PubMed] [Google Scholar]
- 38.Wommack, K. E., and R. R. Colwell. 2000. Virioplankton: viruses in aquatic ecosystems. Microbiol. Mol. Biol. Rev. 64:69-114. [DOI] [PMC free article] [PubMed] [Google Scholar]
- 39.Wright, R. T., and R. B. Coffin. 1984. Factors affecting bacterioplankton densities and production in salt marsh estuaries, p. 485-494. In M. J. Klug and A. Reddy (ed.), Current perspectives in microbial ecology. ASM Press, Washington, D.C.
- 40.Wright, R. T., and R. B. Coffin. 1983. Planktonic bacteria in estuaries and coastal waters of Northern Massachusetts: spacial and temporal distribution. Mar. Ecol. Prog. Ser. 11:205-216. [Google Scholar]
- 41.Yoon, W. B., and R. A. Rosson. 1990. Improved method of enumeration of attached bacteria for studies of fluctuation in the abundance of attached and free-living bacteria in response to diel variation in seawater turbidity. Appl. Environ. Microbiol. 56:595-600. [DOI] [PMC free article] [PubMed] [Google Scholar]


