Abstract
Multiplexed tandem PCR (MT-PCR) is a process for highly multiplexed gene expression profiling. In the first step, multiple primer pairs are added to the RNA to be analysed together with reverse transcriptase and Taq DNA polymerase. Following reverse transcription, the multiplexed amplicons are simultaneously amplified for a small number of cycles so as to avoid competition between amplicons. The reaction product is then diluted and analysed in multiple individual PCRs using primers nested inside the primers used for the multiplexed amplification. As the second PCR uses a template enriched in the amplicons of interest, the conditions can be optimized to significantly reduce ‘primer dimer’ formation allowing SYBR Green chemistry to be used for quantification. MT-PCR can be configured for as little as 10 pg RNA (equivalent to a single mammalian cell) and works well with RNA extracted from archival formalin-fixed paraffin-embedded sections. We illustrate MT-PCR with gene expression profiles of breast cancer cell lines.
INTRODUCTION
Polymerase chain reaction is a key technique in molecular biology, enabling the amplification of specific DNA sequences from complex mixtures of genomic DNA or RNA (1). With the commercial introduction of heat-stable polymerases (2), PCR became an accessible technique for cloning, sequencing and generation of mutants. Real-time PCR, in which the progress of reaction can be followed cycle by cycle (3), allows quantification of DNA to be performed using the cycle number at which the exponential DNA accumulation crosses a threshold value to calculate the original concentration of that target DNA in the test sample.
Up until now PCR has been limited to quantification of up to ∼4 genes in a single tube using different fluorescent probes for each PCR so that they can be independently monitored. The number of genes that can be multiplexed in this way is limited by the availability of fluorescent channels on thermal cyclers and the competition that occurs between different PCRs occurring in the same tube. This necessitates that each multiplexed PCR has to be individually optimized (4). One way to quantify more genes by PCR has been to miniaturize the reaction format so that multiple individual reactions can be set up in parallel. We have explored an alternative, two-step approach in which multiplexed amplicons of interest are first enriched by a limited PCR. In the second step, the product from the multiplexed amplification is used as a template for a large number of single-gene PCRs, corresponding to the genes added in the multiplexed amplification step. By diluting the multiplexed amplification product about 100-fold into the quantification PCR, there is negligible influence of the primers from the first step on the quantification PCR. Furthermore, by enriching the target amplicons in the multiplexed amplification and using limiting amounts of primers and Taq polymerase in the second, the formation of primer dimer is greatly reduced. This enables SYBR Green detection to be used. The technique is related to nested PCR in as much as the primers for the second PCR are nested inside the primers used for the first PCR. However, it differs in that multiple primer pairs are used in the first reaction and this reaction is only carried out for a limited number of cycles, thus minimizing competition between individual PCRs and retaining the quantitative nature of DNA concentration measurement.
The resultant assay, which we call ‘multiplexed tandem PCR’ (MT-PCR), can be configured to profile the gene expression of 72 or more genes from samples as small as 10 pg of RNA in <90 min. Linear amplification of the RNA and individual optimization of the multiplexed reactions are not necessary.
METHODS
Primer design
All primers were designed using Primer 3 software, restricting the size of the ‘inner’ amplicon to 70–90 bp and the size of the ‘outer’ amplicon to <150 bp. All primer pairs spanned an intron–exon boundary and were rejected if they did not give predominantly the correct size product on a Bioanalyser DNA separation chip (Agilent).
Preparation of ‘gene disks’ with lyophilized primers
Gene-specific primer mixes, each containing a pair of inner primers, were prepared containing 5 µl of forward primer stock solution at 100 µM, 5 µl of corresponding reverse primer stock solution at 100 µM and 615 µl of water in a 0.2 ml tube. The CAS1200 Robot (Corbett Research) was then used to aliquot 5 µl of each primer mixture in triplicate into a Corbett Research 72 well ‘gene disk’ (a 96 well plate for other thermal cyclers could equally well be used). These aliquots were then lyophilized in the gene disk for 15 min with heating using a SpeedVac lyophilizer (Savant) followed by temporary sealing of the disk at 160°C using the gene disk heat sealer (Corbett Research). Each disk was then stored at 4°C before use.
10× RT buffer (10 ml)
A total of 500 mM Tris–HCl (pH 8.5) containing 30 mM MgCl2, 300 mM KCl, 1 mM DTT and 0.1 mg/ml gelatin. This was stored at −20°C in 0.5 ml aliquots before use.
10× PCR buffer (10 ml)
A total of 200 mM Tris–HCl (pH 8.5) containing 500 mM KCl, 30 mM MgSO4 and 10 µg/ml gelatin. This was stored at −20°C in 0.5 ml aliquots before use.
RNA extraction
RNA was extracted from cell lines using the RNeasy method (Qiagen) or from formalin-fixed paraffin-embedded (FFPE) sections using the method of Ambion as modified by Warton et al. (K. Warton, H. Barraclough, W. A. Gold and K. K. Stanley, manuscript submitted).
First round multiplexed amplification
RNA was added to an outer primer mixture (up to 72 primer pairs) at a final concentration of 0.1 µM of each primer, 0.3 mM dNTPs (Roche), RT–PCR buffer, dimethyl sulfoxide (DMSO) to 2%, 0.5 µl RNAsin, 20 U MMLV or Superscript III reverse transcriptase (Invitrogen) and 1 U Taq DNA polymerase (Invitrogen) in a total volume of 20 µl.
Each tube was placed in a RotorGene thermal cycler (RG3000, Corbett Research) and heat treated as follows: 1 min at 55°C (reverse transcription), 5 min at 95°C (RT denaturation) followed by 10–20 cycles of 10 s at 95°C, 20 s at 60°C and 20 s at 72°C. This completed the multiplex PCR step and the product was diluted 1:25 in water.
Second round quantification amplification
An aliquot of 500 µl of the multiplex amplification products was added to 1.5 ml of PCR mixture to give a final concentration of 0.2 mM dNTPs, 2% DMSO (Sigma), 25 U/ml Taq, PCR buffer and SYBR Green I dye (Invitrogen) 1:25 000 dilution. An aliquot of 20 µl of PCR mixture was then added to each position within the gene disk containing the lyophilized inner primers and PCR was performed for 35 cycles of 1s at 95°C, 10 s at 60°C and 10 s at 72°C. Fluorescence was measured at the end of each 72°C extension step.
RT–qPCR
For comparison of quantification between MT-PCR and qPCR, reverse transcription of 0.5 µg total RNA was carried out using 100 ng of random hexamer primers in 20 µl followed by qPCR under conditions the same as those used for second round quantification amplification above. cDNA from 12.5 ng was used in each measurement.
RESULTS
In MT-PCR, a large number of primer pairs (as many as 72) are added to a test RNA in a combined reverse transcription and PCR amplification step. The reverse primer of each outer primer pair is used to prime the synthesis of cDNA. Thermal cycling for a limited number of cycles is then used to enrich the template in target sequences corresponding to the genes selected. It is convenient, but not essential, to use one of the inner primers in common between both the first round multiplexed amplification reaction and the second round quantification PCR for each gene. This enables smaller targets to be used, making the assay more resistant to the effects of RNA modification and degradation as occurs in RNA extracted from FFPE tissues. The product from the multiplexed amplification is diluted 100-fold into individual inner PCRs. We found that dilutions above 40-fold resulted in undetectable alternative product formation as measured on a Bioanalyser (data not shown).
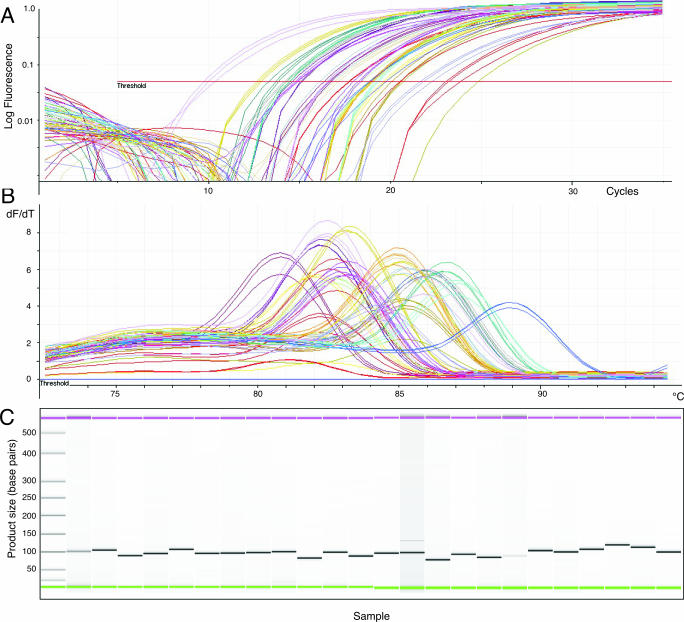
An example of MT-PCR is shown in Figure 1, where 72 pairs of oligonucleotide primers (including the outer primers of Table 1) were added to 50 ng of RNA in the multiplex amplification step of MT-PCR. From the product of this reaction, 24 genes were measured in triplicate on a Corbett Research RG3000 using the primers shown in Table 2. The resultant cycling curves show that each gene expression product was amplified in a reproducible manner, as each set of three cycling curves (with the same colour in Figure 1A), corresponding to an individual gene measurement in triplicate, have almost identical shapes. Importantly, these products were also amplified with high specificity, as secondary amplification products with melt peaks below 80°C were not detectable in these reactions (Figure 1B). This was confirmed by running a sample of the PCR product on a Bioanalyser, which shows that in each case a single product of the predicted size was formed (Figure 1C). Even in the case of one gene that is expressed at very low levels, no alternative products were formed.
Figure 1.
MT-PCR of 72 genes in triplicate 50 ng of MCF7 RNA was analysed by MT-PCR. A total of 72 primer pairs were added to the multiplexed preamplification step at 0.1 µM final concentration. The reaction mixture was then diluted 1:25 and 5 µl used in each inner PCR. The results of 24 genes measured in triplicate are shown. (A) Cycling curves, (B) melt analysis and (C) gel image of electropherogram of product separated on Bioanalyser.
Table 1.
First round outer primers
| Gene | Forward | Reverse |
|---|---|---|
| ESR1 | GATGAATCTGCAGGGAGG | TCGGTGGATATGGTCCTTCT |
| TOP2A | TGCTACACATTTCCCAGATGA | GATTCTTGGTTTTGGCAGGA |
| CCND1 | GCGGAGGAGAACAAACAGAT | TGAGGCGGTAGTAGGACAGG |
| PTEN | TGGCACTGTTGTTTCACAAG | AGGTAACGGCTGAGGGAACT |
| MDM2 | GAGCAGGCAAATGTGCAATA | TTTTTGTGCACCAACAGACTTT |
| TP53 | GGAGCACTAAGCGAGCACTG | CCTCATTCAGCTCGGAAC |
| VEGF | CAAGATCCGCAGACGTGTAA | GGAGGCTCCTTCCTCCTG |
| MYC | TGCTCCATGAGGAGACACC | CTCTGACCTTTTGCCAGGAG |
| PgR | GTCAGTGGGCAGATGCTGTA | AGCCCTTCCAAAGGAATTGT |
| BSG | TGGGCCTGGTACAAGATCAC | GCCTCCATGTTCAGGTTCTC |
| GSTM3 | GGGAAATTCTCATGGTTTGC | CGATTTTCTCCAAAGCCTCA |
| MKI67 | CCCCACCTCAGAGAGTTTTG | GGGCGTTTTTGCTACGTTT |
| MELK | GGAGCAAAAGGAAGGGTTCT | TGCATTGTCACTTTCCCAAA |
| MAD2L1 | TCCTGGAAAGATGGCAGTTT | TGGCAGAAATGTCACCGTAG |
| BUB1 | CTCAGCAACAAACCATGGAA | TCCACATATCCAAATGAGGAAG |
| TPD52 | GCAAGACGTGACAGCAACAT | TTCCAGCTTTTTGGTGATGA |
| HPRT | GCAGACTTTGCTTTCCTTGG | TTTCAAATCCAACAAAGTCTGG |
| NAT1 | ATTCAAGCCAGGAAGAAGCA | TCGGATCTGGTGTTGAAGAA |
| E2F1 | ATCAAAGCCCCTCCTGAGAC | TGGTGGTGGTGACACTATGG |
| TGFB2 | GCATGCCCGTATTTATGGAG | TTGGGTGTTTTGCCAATGTA |
| TGFB3 | GGGCTTTGGACACCAATTAC | GCAGATGCTTCAGGGTTCAG |
| SMAD4 | AGGACAGCAGCAGAATGGAT | GGAATGCAAGCTCATTGTGA |
| RELA | CTCCTGTGCGTGTCTCCAT | GGTCCGCTGAAAGGACTCTT |
| BTF3 | CAGGAAAAACTCGCCAAACT | TGGATCACTGTTCCTTGGTTT |
Table 2.
Second round inner primers
| Gene | Forward | Reverse |
|---|---|---|
| ESR1 | GATGAATCTGCAGGGAGG | TCCAGAGACTTCAGGGTGCT |
| TOP2A | TGCTACACATTTCCCAGATGA | CGGTAGTGGAGGTGGAAGAC |
| CCND1 | GCGGAGGAGAACAAACAGAT | GGCGGATTGGAAATGAACT |
| PTEN | TGGCACTGTTGTTTCACAAG | TCACCTTTAGCTGGCAGACC |
| MDM2 | GAGCAGGCAAATGTGCAATA | AAGCAATGGCTTTGGTCTAA |
| TP53 | GGAGCACTAAGCGAGCACTG | CACGGATCTGAAGGGTGAAA |
| VEGF | CAAGATCCGCAGACGTGTAA | TCACATCTGCAAGTACGTTCG |
| MYC | TGCTCCATGAGGAGACACC | CCTGCCTCTTTTCCACAGAA |
| PgR | GTCAGTGGGCAGATGCTGTA | TGCCACATGGTAAGGCATAA |
| BSG | TGGGCCTGGTACAAGATCAC | GCGAGGAACTCACGAAGAAC |
| GSTM3 | GGGAAATTCTCATGGTTTGC | CAGGCACTTGGGGTCAAATA |
| MKI67 | CCCCACCTCAGAGAGTTTTG | GGGCTTGCAGAGCATTTATC |
| MELK | GGAGCAAAAGGAAGGGTTCT | CAACAGTTGATCTGGATTCACTAA |
| MAD2L1 | TCCTGGAAAGATGGCAGTTT | CGGATTTCATCCTGGATAGC |
| BUB1 | CTCAGCAACAAACCATGGAA | GTGCCAAAGAGCATGCAATA |
| TPD52 | GCAAGACGTGACAGCAACAT | GAGCCAACAGACGAAAAAGC |
| HPRT | GCAGACTTTGCTTTCCTTGG | ACACTTCGTGGGGTCCTTTT |
| NAT1 | ATTCAAGCCAGGAAGAAGCA | CAATGTCCATGATCCCCTTT |
| E2F1 | ATCAAAGCCCCTCCTGAGAC | CTCAGGGCACAGGAAAACAT |
| TGFB2 | GCATGCCCGTATTTATGGAG | GCAGCAAGGAGAAGCAGATG |
| TGFB3 | GGGCTTTGGACACCAATTAC | GCAGATGCTTCAGGGTTCAG |
| SMAD4 | AGGACAGCAGCAGAATGGAT | GTTTTGGTGGTGAGGCAAAT |
| RELA | CTCCTGTGCGTGTCTCCAT | GTTTCTCCTCAATCCGGTGA |
| BTF3 | CAGGAAAAACTCGCCAAACT | TCATCTGCTGTGGCTGTTCT |
The reproducibility of MT-PCR was determined by performing 10 separate MT-PCRs on 4 different days from 50 ng of the same batch of RNA isolated from MCF7 cells using 10 cycles of multiplex PCR in the first round. The coefficient of variation in the measurement of the Ct for individual genes ranged from 0.01 to 0.05 with a mean value of 0.03 for all the genes (data not shown). This demonstrates a high level of reproducibility between MT-PCR experiments.
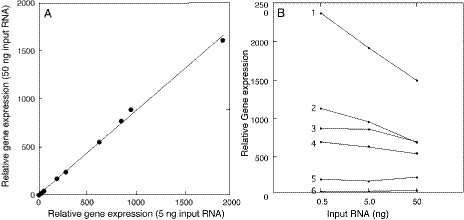
It is also important to demonstrate that MT-PCR responds in a linear way to changes in input gene concentrations for all genes. Because changes in the recovery of RNA from a tissue could influence the absolute level of fluorescence and Ct value of a gene, we always compare the Ct values of test genes to a comparator gene, or genes, located on the same gene disk. These relative concentrations should remain constant for every gene when different amounts of the same RNA are applied to the assay. We have compared the expression of 24 genes in triplicate relative to BTF3 as a comparator gene at input RNA levels of 0.5, 5 and 50 ng using MT-PCR employing 15 cycles of multiplex amplification (Figure 2A). It can be seen that the correlation between relative gene expression measured at 5 and 50 ng input was excellent (r = 0.999 in Figure 2A), indicating that all 23 genes compared with BTF3 behave in a similar way. Similarly, the correlation between data at 0.5 and 5 ng was 0.997 and that between 0.05 and 50 ng was 0.994. Thus, even over two logs of input variation there is no evidence for individual gene differences. The slope of each correlation line was 0.8–0.9 when comparing over a 10-fold difference of input RNA, indicating that measurements of relative gene expression levels by MT-PCR are not significantly affected by the input level of RNA. The small deviation from linearity is due to the most highly expressed genes included in the gene set. In Figure 2B, it can be seen that the non-linearity increases with the expression level of the gene. If the three most abundant genes are not included in the correlation graph, the slope is close to 1.0 (data not shown).
Figure 2.
Accuracy of MT-PCR gene expression measurements Total RNA from MCF7 cells was analysed by MT-PCR using 15 multiplex preamplification cycles. An aliquot of 0.5, 5.0 and 50.0 ng of RNA was used in three different assays performed in duplicate. In each assay, 24 genes were measured in triplicate and the Ct values obtained where the cycling curves intersected with a threshold set at 5% of the total fluorescence was used to calculate an arbitrary concentration relative to one of the 24 genes. (A) Correlation of gene expression relative to BTF3 comparator gene at 5 and 50 ng input RNA (r = 0.999, slope = 0.9). (B) Relative gene expression of the most highly expressed six genes at three different RNA inputs (1 = CCND1; 2 = BSG; 3 = MKI67; 4 = E2F1; 5 = PTEN; 6 = MDM2).
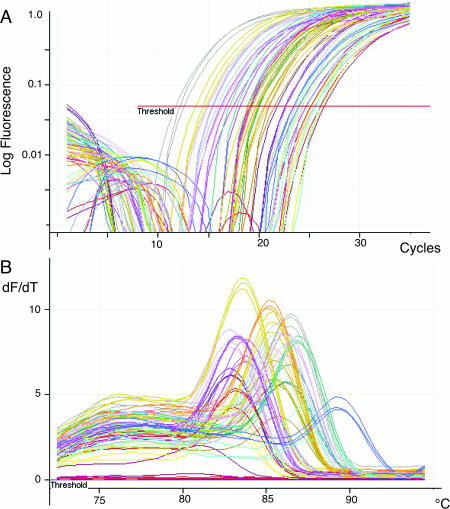
The quantification of gene expression from archival FFPE samples is highly desirable, but limited by the low recovery of RNA from these specimens (<10 ng per 10 µm section of a needle biopsy) and by the highly fragmented nature of the recovered molecules. It is not possible to perform linear RNA amplification or reverse transcription using oligo(dT) primer as it is unlikely that any RNA fragment will contain both the 3′ end of the RNA and the amplicon that is going to be measured. However, using gene-specific priming in MT-PCR and the short target sequences, excellent results are obtainable. For samples of total RNA containing 0.5–50 ng we find that 15 cycles of multiplex preamplification are suitable. A typical result using MT-PCR to measure 24 genes in triplicate from a single slice of a FFPE xenograft specimen that had been stored for 10 years prior to RNA extraction is shown in Figure 3. All 24 genes were measured with good reproducibility between triplicates, and without the formation of ‘primer dimer’ as evidenced by the lack of products with a melt temperature below 80°C, and the appearance of a single product of the correct molecular weight on Bioanalyser analysis (data not shown).
Figure 3.
MT-PCR of RNA extracted from an FFPE section. A single slice of a 10-year-old FFPE biopsy specimen was extracted using proteinase digestion and silica column purification (Ambion). The diameter of the specimen was ∼4 mm and the section was 10 µm thick. One-third of the extracted RNA was analysed by MT-PCR using 15 cycles of preamplification. The results of 24 genes measured in triplicate are shown. (A) Cycling curves; (B) melt analysis.
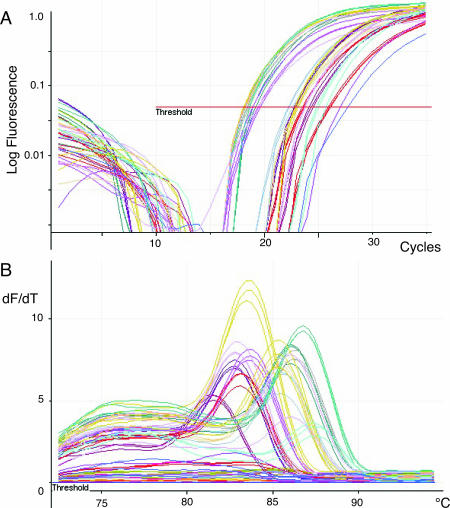
When using extremely low amounts of RNA input (0.01–1 ng), as many as 20 cycles of multiplex amplification may be used. Figure 4A shows the quantification of 24 genes in triplicate from 10 pg of MCF7 RNA, which is equivalent to the total RNA found in a single mammalian cell. In this case, 20 out of the 24 gene expression products could be detected and quantified. Of the four genes which now fell under the detection limit of the assay, only one gave rise to unwanted secondary amplification products. Since the expected melt temperature of each product is known, any reactions resulting in incorrect product can be identified in software and eliminated. When the input RNA was raised to 0.05 ng all 24 genes were detected showing that this is around the sensitivity for detection of low copy number RNA molecules.
Figure 4.
MT-PCR of 10 pg total RNA MT-PCR of 24 genes in triplicate using 10 pg of input RNA and 20 cycles of multiplexed amplification. The results of 23 of the 24 genes are shown. (A) Cycling curves; (B) melt analysis.
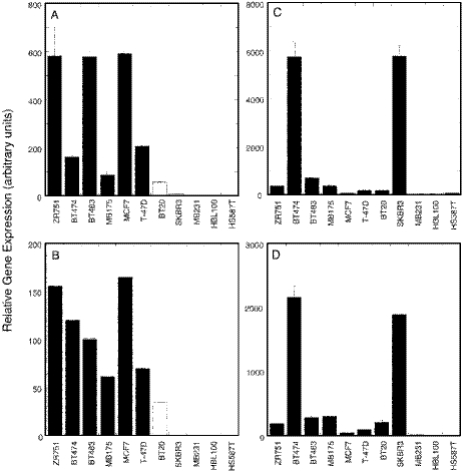
An example of the utility of MT-PCR is shown in Figure 5. In this study, RNA was extracted from 11 human breast cancer cell lines and subjected to MT-PCR measuring 24 genes in triplicate on a single gene disk. ESR1 and ERBB2 expression are critical for decisions relating to clinical management of breast cancer patients and these traits are preserved in human breast cancer cell lines (5). In Figure 5A, it can be seen that the expression of ESR1 closely follows the oestrogen receptor status of the cell line as determined by immuno histochemistry (solid bars). This result was confirmed by the expression of the progesterone receptor, which is directly regulated by ESR1 (data not shown). When RNA from the same cell lines was reverse transcribed using random primers and ESR1 measured by conventional qPCR, a very similar pattern of cell type expression was obtained (Figure 5B). The correlation between the values measured by MT-PCR and qPCR was high (r = 0.9). Similar correlations were obtained for a number of genes that could be measured by qPCR; however, in many cases the quantification by qPCR was not very reliable as alternative products were formed when the concentration of target was low.
Figure 5.
MT-PCR of gene expression in human breast cell lines Total RNA was extracted from 11 human breast cancer cell lines and 10 ng of each was analysed by MT-PCR using 15 cycles of multiplex preamplification. The results of 4 out of 24 genes measured are shown: (A) ESR1 measured by MT-PCR (solid bars = oestrogen receptor positive by IHC), (B) ESR1 measured by qPCR (mean of duplicate measurements), (C) ERBB2 measured by MT-PCR and (D) GRB7 measured by MT-PCR. Error bars indicate SD of three measurements. Gene expression is shown relative to BTF3.
ERBB2 was upregulated in two of the cell lines (Figure 5C). Both of these cell lines also show elevated levels of expression of the adjacent gene, GRB7 (Figure 5D). This confirms the result with ERBB2 and shows that in this case the changes in expression most likely relate to the amplification of a segment of chromosome 17, not just to changes in the activity of the ERBB2 gene itself. Thus, MT-PCR is capable of gene expression profiling of genes relating to gene diagnosis of cancer patients. Although tissue biopsies would contain both cancer and non-cancer cells, decreasing the signal-to-noise ratio observed for critical genes, the high sensitivity of MT-PCR should enable it to be used with laser dissection microscopy to determine gene expression profiles of small clusters of cells in a biopsy section.
DISCUSSION
The multiplexed amplification and measurement of multiple gene expression products using a generic reporter such as SYBR Green has been made possible using a tandem PCR process in which the first step is highly multiplexed, but only continued for a small number of cycles so that competition between primers is not significant, and a second round of PCRs in which each individual gene is quantified. The method circumvents the need for the lengthy process of RNA amplification and will work on highly fragmented RNA as the reverse transcription reaction is primed by the same antisense oligonucleotides that are used as 3′ PCR primers in the first round of multiplexed amplification. Furthermore, only a very short reverse transcription reaction is necessary, allowing less enzymes to be used, which in turn improves the specificity of the reaction. A second improvement to specificity arises out of the nested nature of the first and second stage primers. Thus, three reactions (reverse transcription, first and second stage PCR) use gene-specific primers. Unlike multiplexed probe assays, no optimization of the individual PCRs is required; all PCRs which produce a single product when run on their own have functioned in MT-PCR in our hands. Indeed, the nested nature of the primers in the two-stage process usually makes the MT-PCR product cleaner than the product obtained when outer or inner primer pairs are evaluated in a normal PCR. If desired, labelled probe assays can be used in the quantification PCR, but are not essential for specificity in most cases.
Currently, the simultaneous analysis of multiple genes is only possible using array hybridization methods, or using miniaturized PCR assays. Neither of these techniques will work satisfactorily on RNA samples from a single FFPE section or a single cell. The most popular method of RNA amplification is by conversion into double stranded cDNA using an oligo(dT) primer that contains a T4 promoter sequence and then linear amplification using T4 RNA polymerase. This process takes at least 2 days to complete and is unsuitable when the target sequences of downstream assays are a significant distance away from the 3′ end of the mRNA. This is especially true for fragmented RNA isolated from FFPE sections. In this case, random priming of reverse transcriptase can be performed, but the RNA is not amplified, and larger amounts are therefore required for analysis. A major advantage of MT-PCR is that the whole process takes only 60–90 min without any need for prior amplification of RNA. Furthermore, MT-PCR utilizes gene-specific priming of reverse transcription at the site of the target amplicon making it tolerant of highly degraded RNA and well suited to analysis of RNA extracted from paraffin embedded specimens.
Separating the PCR into two stages has additional advantages. Longer annealing times can be used in the multiplexed amplification step to allow rare mRNA molecules time to hybridize with their primers. In the second stage, short cycle times add selectivity for products amplified in the first stage. The enriched template for the quantification PCR also allows reduced primer and Taq concentration to be used, resulting in unfavourable conditions for primer dimer formation. It should be noted that the amount of reverse transcriptase used in the multiplexed amplification is one-tenth that recommended by the manufacturer and the concentration of Taq used in the quantification PCR is half that recommended. Using higher levels of these enzymes promotes the formation of non-specific products (data not shown). The overall effect of the nested primers, three gene-specific reactions and optimized PCR conditions is that primer dimer is essentially absent from the reaction product, allowing quantification to proceed from the fluorescence of intercalating DNA dyes, such as SYBR Green. When no template is added to an MT-PCR, we normally observe about half of the genes give no cycling curves and thus a zero measurement of concentration. In the remaining cases some primer dimer is formed, but this has a different melt from the expected amplicon and is also easily designated as absent. By the time that the RNA concentration has been increased into the recommended range for analysis, almost all genes that are present give good cycling and melt curves. A further improvement might be obtained by adding thermostable RecA protein to the multiplexed amplification reaction when assaying extremely low levels of RNA to prevent the formation of unwanted products (6). Since an MT-PCR has a total of 45–55 cycles (depending on whether 10, 15 or 20 cycles of multiplexed amplification are used), it is unlikely that a gene that is present in the original RNA sample would give a null result.
Although it would be possible to calibrate MT-PCR with known standards in order to obtain absolute quantification data, the most straightforward treatment of results is to express the data as an expression relative to a comparator gene. For this purpose, we routinely use the Pol II subunit, BTF3, which is present is very similar amounts relative to total RNA in all cell lines and tissues that we have examined (7). The abundance of BTF3 makes it easy to measure, but this is also a drawback, in as much as it is likely to suffer from competition effects. Comparison of the relative quantification data at three different RNA input concentrations spanning a 100-fold change demonstrated that the concentration relative to BTF3 for 20 of the genes did not change, indicating that BTF3 measurements could not have been significantly attenuated. The four most highly expressed genes did show a small fall off in measured concentration at the highest level of input RNA. This lead to a small fall off in the slope of the correlation data if all points are included. The genes used in our test set spanned a 10 000:1 range of concentration, making this a bigger effect on target abundance than the experimentally introduced input RNA level. Ideally, MT-PCR should be set up with groups of genes having a similar abundance and compared with a comparator gene, or a group of comparator genes, of similar concentration. Despite the non-ideal setup, MT-PCR of genes with a wide range of concentration did not show any competition effect, as evidenced by the excellent correlation of data points to a straight line.
MT-PCR is well suited to many research and diagnostic assays, especially where only small amounts of starting RNA are available. It may also be used for the analysis of DNA targets, especially when coupled with high resolution melt analysis to distinguish chromosomal mutations. Since MT-PCR can produce adequate results from a fraction of the RNA extracted from a single FFPE section, it would be possible to measure several hundred genes from a single sample if desired. In many cases, the diagnostic use of gene expression in cancer requires the use of <100 genes making MT-PCR a suitable vehicle for most diagnostic applications.
Acknowledgments
The authors thank Dr Rik Thompson for generously allowing access to archival xenograft FFPE tissue specimens, and Wendy Gold and Thomas Grewal for helpful discussions. This work was funded by a START grant from AusIndustry to Corbett Research for the development of a turnkey instrument for gene expression profiling of cancer patient biopsies. Funding to pay the Open Access publication charges for this article was provided by Corbett Research Pty Ltd and University of New South Wales.
Conflict of interest statement. None declared.
REFERENCES
- 1.Saiki R.K., Scharf S., Faloona F., Mullis K.B., Horn G.T., Erlich H.A., Arnheim N. Enzymatic amplification of beta-globin genomic sequences and restriction site analysis for diagnosis of sickle cell anemia. Science. 1985;230:1350–1354. doi: 10.1126/science.2999980. [DOI] [PubMed] [Google Scholar]
- 2.Saiki R.K., Gelfand D.H., Stoffel S., Scharf S.J., Higuchi R., Horn G.T., Mullis K.B., Erlich H.A. Primer-directed enzymatic amplification of DNA with a thermostable DNA polymerase. Science. 1988;239:487–491. doi: 10.1126/science.2448875. [DOI] [PubMed] [Google Scholar]
- 3.Higuchi R., Fockler C., Dollinger G., Watson R. Kinetic PCR analysis: real-time monitoring of DNA amplification reactions. Biotechnology. 1993;11:1026–1030. doi: 10.1038/nbt0993-1026. [DOI] [PubMed] [Google Scholar]
- 4.Henegariu O., Heerema N.A., Dlouhy S.R., Vance G.H., Vogt P.H. Multiplex PCR: critical parameters and step-by-step protocol. Biotechniques. 1997;23:504–511. doi: 10.2144/97233rr01. [DOI] [PubMed] [Google Scholar]
- 5.Lacroix M., Leclercq G. Relevance of breast cancer cell lines as models for breast tumours: an update. Breast Cancer Res Treat. 2004;83:249–289. doi: 10.1023/B:BREA.0000014042.54925.cc. [DOI] [PubMed] [Google Scholar]
- 6.Shigemori Y., Mikawa T., Shibata T., Oishi M. Multiplex PCR: use of heat-stable Thermus thermophilus RecA protein to minimize non-specific PCR products. Nucleic Acids Res. 2005;33:e126. doi: 10.1093/nar/gni111. [DOI] [PMC free article] [PubMed] [Google Scholar]
- 7.Warton K., Foster N.C., Gold W.A., Stanley K.K. A novel gene family induced by acute inflammation in endothelial cells. Gene. 2004;342:85–95. doi: 10.1016/j.gene.2004.07.027. [DOI] [PubMed] [Google Scholar]


