

Abstract
Yeast species have undergone extensive genome reorganization in their evolutionary history, including variations in chromosome number and large chromosomal rearrangements, such as translocations. To determine directly the contribution of chromosomal translocations to the whole organism's fitness, we devised a strategy to construct in Saccharomyces cerevisiae collinear ‘evolutionary mimics' of other species originally differing by the presence of reciprocal translocations in their genome. A modification of the Cre/loxP system was used to create in S. cerevisiae the translocations detected in the sibling species Saccharomyces mikatae IFO 1815 and 1816. Competition experiments under different physiological conditions showed that the translocated strains of S. cerevisiae consistently outcompeted the reference S. cerevisiae strain with no translocation, both in batch and chemostat culture, especially under glucose limitation. These results indicate that chromosomal translocations in Saccharomyces may have an adaptive significance, and lend support to a model of fixation by natural selection of reciprocal translocations in Saccharomyces species.
Keywords: fitness, Cre/loxP, chemostat, adaptation, yeast
Introduction
Nuclear genome rearrangements are common events during the evolutionary history of yeast species. They include variations in chromosome number (Keogh et al, 1998; Langkjaer et al, 2000; Špírek et al, 2003), differences in gene order resulting from duplication events followed by differential gene loss (Llorente et al, 2000; Fischer et al, 2001), inversions (Huynen et al, 2001) and reciprocal translocations (Fischer et al, 2000). Owing to their short life cycle and the availability of excellent genetic tools, the Saccharomyces ‘sensu stricto' species complex represents a good model system to investigate the fitness effects of reciprocal translocations. Among these species, translocations are not distributed evenly, raising the possibility that they might be adaptive (Fischer et al, 2000). The recently isolated yeast species Saccharomyces mikatae is characterized by the presence of reciprocal translocations, involving chromosomes VI, VII and XVI, with respect to Saccharomyces cerevisiae. The impact of chromosomal translocations on reproductive isolation between these two species has already been reported, showing that restored collinearity can increase hybrid fertility (Delneri et al, 2003). In this work, we wanted to investigate the effect of these naturally occurring rearrangements on the whole organism's evolutionary fitness (defined as the probable genetic contribution of an individual or a genotype to succeeding generations).
So far, it has been difficult to assess the fitness effect of translocations in yeast species, owing to the presence of other genetic or epigenetic differences between strains or species. To isolate the specific effects of reciprocal translocations, excluding any other genetic or epigenetic components, we needed to obtain isogenic strains differing exclusively by the presence of translocations. S. cerevisiae is the ideal system to investigate this issue, owing to the availability of standard laboratory strains and powerful tools for genetic manipulation. Therefore, we decided to ‘mimic' the naturally occurring reciprocal translocations of S. mikatae in S. cerevisiae. We used a modification of the Cre/loxP system to engineer four strains of S. cerevisiae: one acting as a reference strain (r-ScWT, no translocations), two mimicking the genome structure of S. mikatae IFO 1816 (ScT1, one translocation) and IFO 1815 (ScT1T2, two translocations), and one (ScT2) not collinear with any isolate so far obtained from nature. All strains were isogenic, except for the engineered translocations. In an asexually propagating microorganism, the relative fitness is given by the population growth rates of the different cell types, as they compete for a pool of resources. In our experiments, the relative fitness of the strains was assessed in competition experiments under different nutrient limitations (C-, N-, P- and S-limited media). We showed that ScT1 and ScT1T2 consistently outcompeted the reconstituted wild-type strain (r-ScWT) in batch and chemostat culture, especially under glucose limitation, whereas strain ScT2, in batch culture, did not show any significant growth advantage. Our results indicate that the translocations present in S. mikatae have a significant effect on the fitness of S. cerevisiae in glucose-limited laboratory conditions. As strains of S. mikatae have been isolated from nutritionally poor habitats, such as soil and decaying leaves (Naumov et al, 2000), our data suggest that the translocations found in this species may have conferred some advantage in natural conditions. This is compatible with a model of fixation of chromosomal rearrangements by natural selection.
Results
Construction of strains for the competition experiment
To assess the effect that chromosomal rearrangements have on yeast growth, we constructed four strains differing from one another by specific translocations. S. cerevisiae r-ScWT is a strain that has been taken through the complete process for the introduction of translocations. It has a reconstituted genome that is collinear with that of the original wild-type strain, and contains four loxP ‘scars' at the selected translocation breakpoints (see Fig 1). S. cerevisiae ScT1 and ScT1T2 are strains in which translocations have been introduced to render their genomes collinear with those of S. mikatae strains 1816 and 1815, respectively. Finally, S. cerevisiae strain ScT2 shares one translocation with S. mikatae 1815, but otherwise has a genome configuration that has not been found in any Saccharomyces species so far isolated from nature.
Figure 1.

Strategy adopted to construct isogenic strains differing by chromosomal rearrangements. loxP–kanr–loxP and loxP–KlURA3–loxP cassettes were inserted in the Sct1 genome at the translocation breakpoints relative to S. mikatae IFO 1815. A single colony was selected and transformed with a plasmid containing the Cre recombinase. The transformants were selected on minimal media lacking leucine, and single colonies were transferred onto galactose media to induce the recombinase. Serial dilutions onto YPD were performed and the colonies were screened by PCR for the genotypes ScT1, ScT1T2, ScT2 and rscWT.
To discriminate between the effects of the genomic rearrangements and other genetic effects, all the strains used in the competition experiments needed to be isogenic (Fig 1). To achieve this, the Sct1 strain (Delneri et al, 2003) underwent two series of transformations to introduce the loxP–Kanr–loxP and loxP–KlURA3–loxP cassettes into the translocation breakpoints identified for S. mikatae IFO 1815 (between ORFs YGR188c/YGR189c and YPL108w/YPL109c). The resulting strain was transformed with a Cre recombinase plasmid (Delneri et al, 2000) and, upon induction of the recombinase, different translocation events occurred at the positions of the loxP sites present in the genome. The colonies were screened by PCR for the ScT1, ScT1T2, ScT2 and rscWT chromosomal configurations. In this way, all four strains were obtained from the Sct1 strain, had undergone the same transformation process, and all possessed four loxP scars at the translocation breakpoints (even if, as in r-ScWT, the chromosomes retained their wild-type configuration). Karyotypes of the newly generated strains were checked by pulse field gel electrophoresis (PFGE).
Batch competition
The intrinsic growth rates of each strain in YPD and SD media were measured, and the selection coefficients in pairwise competition experiments were determined (Table 1). When comparing the intrinsic growth rates of the same strain grown either in YPD or SD media, no major differences were detected, with the exception of ScT1T2, whose growth rate decreased, relative to rscWT, in SD medium. When comparing the intrinsic growth rates of different strains in YPD and SD media, ScT1 showed the highest rate of growth in both media. Competition experiments carried out in YPD showed that ScT1 had a significant advantage over both r-ScWT (s=0.229) and ScT1T2 (s=0.110), whereas ScT1T2 outcompeted ScT2 (s=0.166). These results are in agreement with predictions from the intrinsic growth rates for the different strains. On YPD, all strains carrying the translocation T1 showed the largest competitive advantage, regardless of the presence of translocation T2, with similar selection coefficients for the pairs r-ScWQT/ScT1 and ScT2/ScT1T2 (t-test, P=0.24, n=5). Conversely, strains carrying translocation T2 showed different selective advantages depending on the presence of translocation T1 (comparison of the pairs r-ScWT/ScT2 and ScT1/ScT1T2, t-test, P<0.001, n=5). The effects of each individual translocation do not appear to be additive, as indicated by the comparison of the selection coefficients of the three translocated strains with that of the reconstituted wild type. When competition experiments were carried out in SD medium, no selection coefficient for any pairwise strain comparison showed high values.
Table 1.
Batch competition experiment: intrinsic growth rates (growth per hour between 0 and 24 h) of individual strains in YPD and SD and selection coefficients (strain 1/strain 2=relative change in frequencies in strain 1 per generation) of pairwise competition
| YPD | SD | |
|---|---|---|
| Intrinsic growth rates (h−1) | ||
| Sc | 0.261 (0.006) | 0.253 (0.010) |
| ScT1 | 0.273 (0.008) | 0.276 (0.013) |
| ScT2 | 0.265 (0.006) | 0.25 (0.009) |
| ScT1T2 | 0.266 (0.007) | 0.221 (0.006) |
| Selection coefficients | ||
| Sc/ScT1 | −0.229 (0.036)*** | 0.027 (0.029) |
| Sc/ScT2 | 0.013 (0.006)*** | 0.038 (0.025)** |
| Sc/ScT1T2 | 0.005 (0.004)** | 0.048 (0.081) |
| Sct1/ScT1T2 | 0.11 (0.004)*** | 0.018 (0.023) |
| Sct2/ScT1T2 | −0.166 (0.099)*** | −0.022 (0.03) |
The value shown is the average selection coefficient from the five replicates. Standard deviation values are given in parentheses. Selection coefficients significantly different from 0 (t-test) are marked (*at the 95% confidence level; **at the 99% confidence level; ***at the 99.9% confidence level).
Continuous culture competition experiments
The changes in the proportions of the three strains during chemostat competition in four culture conditions are shown in Fig 2A. In all cases, a plateau was reached after 35 generations, after an initial change in the frequencies of the strains. Such plateau effects are not unusual in chemostat culture, and may result from interactions between the strains via the growth medium (Baganz et al, 1998; Discussion). The last sample, at 66 generations, showed much higher variation between replicates than the previous one. This could be caused by the occurrence of secondary mutations in some replicates. Therefore, the analysis was performed from the estimated strain frequencies after 53 generations.
Figure 2.

Selection effects of translocations measured in continuous cultures. (A) Changes in the relative proportions of the different strains in the population grown in chemostat culture competition under four nutrient limitations. r-ScWT (—), ScT1 (–··–·), ScT1T2 (·······). (B) Selection coefficients of each strain in the chemostat competition experiment under four different nutrient limitations.
Selection coefficients (see Fig 2B) were much lower than in the batch experiment (less than 0.1), but significantly different from zero. The strongest competitive advantage was observed under carbon limitation, and the lowest under sulphate limitation. Under carbon and phosphate limitation, selection favoured ScT1T2 at the expense of rscWT, whereas the ScT1 frequency did not change significantly. Under ammonium limitation, ScT1 was favoured, whereas r-ScWT was selected against. Under sulphate limitation, there was a slight but significant advantage for ScT1T2 at the expense of ScT1.
Discussion
S. cerevisiae strains grown in glucose-limited chemostats have been found to show chromosomal rearrangements after approximately 500 generations and, in some cases, to share the same translocation breakpoints. The fact that similar genomic rearrangements recur in different strains suggests that they may be adaptive and responsible for the increased fitness of these strains (Dunham et al, 2002). In addition, chromosomal rearrangements could occur during standard laboratory growth conditions (Hughes et al, 2000), and have also been shown to be involved in the adaptive evolution of wine yeast strains. A reciprocal translocation between chromosomes VII and XVI appears to cause overexpression of the SSU1 gene, which makes the wine yeasts resistant to high concentrations of sulphite (Péréz-Ortín et al, 2002). In higher eukaryotes, such as Drosophila, inversion polymorphisms have also been associated with fitness variation (Fernandez-Iriarte & Hasson, 2000).
All but two of the competition experiments described here (the batch SD experiment, and chemostat under sulphate limitation) provided evidence for positive fitness effects of reciprocal translocations. Even though these effects are modest in the case of chemostat cultures, they are significant. The greatest effect was observed under batch culture in standard YPD medium. In this case, the T1 translocation showed a strong selective advantage (s>0.1), irrespective of the strain's status for the T2 translocation. In contrast, the T2 translocation showed a selective advantage only in strains possessing the T1 translocation. The order of occurrence of these two translocations in S. mikatae may be inferred from the species' phylogeny, and is T1 (the sole translocation present in S. mikatae 1816 strain) followed by T2 (the S. mikatae 1815 strain possesses both translocations). No S. mikatae strain so far isolated from nature has been found to contain the T2 translocation on its own. Moreover, T2 involves one of the reciprocal chromosomal products of the T1 event. It could also be postulated that, where multiple translocations have been preserved in natural isolates, there may be some synergistic interactions between them to confer some greater selective advantage than the individual translocations.
Fitness effects of translocation in minimal (SD) medium and in chemostats under nutrient limitation were much smaller than in YPD, with selection coefficients lower than 0.03. Glucose was the principal source of carbon and energy in all of the media. Glucose was chosen as it is the one sugar that is omnipresent in grapes at all stages of the ripening process (Lafon-Lafourcade, 1983). Although glucose was the main carbon source, population densities were (of course) much higher in the rich YPD medium than in the minimal media. This, together with the plateau effect seen in some chemostat experiments, suggests that the selected strain may alter the growth environment in such a way that the selection conditions are not constant. Such frequency-dependent effects may have important evolutionary consequences (Greig & Travisano, 2004).
Our data indicate that reciprocal translocations in Saccharomyces can have positive fitness effects and provide evidence for an increase in maximum specific growth rate in translocated strains of S. cerevisiae. At the molecular level, the increased fitness may be the result of changes in the expression of specific genes (as with sulphite resistance in wine yeasts; Péréz-Ortín et al, 2002) or changes in the structure of the chromosome themselves (e.g. by the redistribution of replication origins).
It is, of course, difficult to extrapolate our data on a laboratory strain of S. cerevisiae to explain the particular evolutionary history of another species. Our results are important in showing that chromosomal rearrangements (and especially those mimicking naturally occurring translocations) have the potential to provide a selective advantage in certain environmental conditions. In this respect, they support a model of chromosomal evolution involving fixation of major genomic rearrangements by natural selection. It cannot be argued that our methodological approach reflects natural conditions, and more research is needed into the natural history of S. mikatae to gain insights into the actual evolutionary forces acting in the fixation of chromosomal translocations in that species. If S. mikatae were indeed mainly found in sugar-limited habitats, which contrasts to the famous rotting fig from which the progenitor of most laboratory strains of S. cerevisiae was isolated, this would give more support to the notion of the adaptive fixation of a favourable translocation.
Methods
Yeast strains. S. cerevisiae Sct1 (Delneri et al, 2003) is collinear with S. mikatae 1816 and it was derived from S. cerevisiae FY23 (MATa ura3-52 leu2Δ1 trp1Δ63). The strains ScT1, ScT1T2, ScT2 and rscWT were constructed in this work. ScT1 and ScT1T2 are collinear with S. mikatae IFO 1816 and 1815 and present, respectively, one and two translocations compared with S. cerevisiae wild type. The strain ScT2 differs by one translocation from S. cerevisiae, and from both S. mikatae strains. r-ScWT is collinear with S. cerevisiae, but has loxP scars at the translocation breakpoints found in the two S. mikatae strains.
All strains were maintained on medium containing 2% yeast extract, 1% peptone and 2% glucose (YPD). To select transformants, cells were grown on YPD–agar containing 300 μg/ml geneticin (Gibco BRL), or on glucose minimal medium (SD) containing 0.67% yeast nitrogen base (Difco), 0.5% ammonium sulphate and 2% glucose (amino acids or nucleic acid bases were added at a concentration of 20 mg/l).
Genetic manipulation. The loxP loci were inserted in the genome by PCR-mediated gene replacement (Baudin et al, 1993; Wach et al, 1994) using either the kanr gene or the KlURA3 gene from Kluyveromyces lactis, as selectable markers. Yeast cells were transformed using the lithium acetate method (Gietz et al, 1995). Primers flanking the translocation breakpoints on chromosomes VI, VII and XVI were designed, and verification of translocation events was performed by analytical PCR (Delneri et al, 2003). All primers used for engineering and verifying the translocations are listed in Table 2. PFGE was performed according to Fischer et al (2000).
Table 2.
Primers used for insertion of the loxP sites in the genome by PCR-mediated gene replacement, and for the verification of the rearrangements by analytical PCR
| Primers for disruption cassettes | |||||
|---|---|---|---|---|---|
| Primer names | Primer sequences | ||||
| VI/VIIt translocation | |||||
| YFR0607 | F: atgattactagtgcttaaaccttgttattcatgcctcagctgaagcttcgtacgc | ||||
| R: aacctaacaaggttacttcatttttcccgaagagcaatacgcataggccactagtggatc | |||||
| YGR2122 | F: actgtaataaagagtaaaaacaacaacaaagacaatcgagctgaagcttcgtacgc | ||||
| R: gtgtttaaacaaatttcggaagcaatggagcatcaggccactagtggatc | |||||
| VII/XVIt translocation | |||||
| YGR188189 | F: ccgcactttatattttaacgtttgatggttttctatcttggcagcgcagctgaagcttcgtacg | ||||
| R: cttttattattaagggtagccttcatacaaaggaaatttatgtcatcgcataggccactagtggatc | |||||
| YPL116103 | F: cgctgcttctataacacttgttttgacatgacgataagtgtagtcagctgaagcttcgtacgc | ||||
| R: ataaattgattctaagtacaggaagtatcaagggggggggttgacgcataggccactagtggatc | |||||
| Primers for analytical PCR | |||||
| Fragment sizes (bp) | |||||
| Primer names | Primer sequences | Primer pairs | Wild-type size | With no translocations | With translocations |
| VI/VIIt translocation | |||||
| Ck6F | cgtcgtccacctatttgag | Ck6F/Ck6R | 1,046 | 765 | – |
| Ck6R | atccaatagctgaagaacgtc | Ck7F/Ck7R | 1,060 | 605 | – |
| Ck7F | acatcagagacttgggcatc | Ck6F/Ck7R | – | – | 865 |
| Ck7R | agctgtgctcgatgttgtg | Ck7F/Ck6R | – | – | 495 |
| VII/XVIt translocation | |||||
| Ck7bF | gttggcacaagttatggagtc | Ck7bF/Ck7bR | 1,259 | 667 | – |
| Ck7bR | cgtagctttactagccttgc | Ck16F/Ck16R | 914 | 508 | – |
| Ck16F | ttattcccctcatatattcgg | Ck7bF/Ck16F | – | – | 634 |
| Ck16R | ttattatgcaagttgtgtaggc | Ck16R/Ck7bR | – | – | 560 |
Batch competition experiments. Pairs of strains were assessed for competitive ability in YPD and SD media. Five pairs were tested (r-ScWT/ScT1, r-ScWT/ScT2, r-ScWT/ScT1T2, ScT1/ScT1T2, ScT2/ScT1T2), and the growth rate of each of the four strains was determined. All experiments were carried out with five replicates. For the growth assay, 6.25 × 10⁵ cells were inoculated in 5 ml medium. Cell counts were estimated from the OD600 after 12, 24, 30, 36 and 48 h. The carrying capacity and intrinsic growth rate were estimated from the cell counts, with carrying capacity K=N48 h, where N48 h is the cell count after 48 h (at stationary phase), and intrinsic growth rate
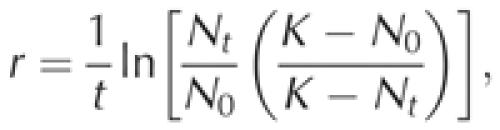 |
where N0 is the cell count at time 0, Nt is the cell count at time t (24 h) and K is the number of cells at carrying capacity (Mable, 2001). Pairwise competition experiments were conducted in YPD and SD media. In all, 6.25 × 10⁵ cells of each strain were inoculated in 5 ml medium, and were grown for 48 h until the stationary phase. Strain frequencies were estimated by quantitative PCR (see below), and selection coefficient (Dykhuizen, 1993) was calculated as follows: s=1/t[ln(x1t/x2t)−ln(x10/x20)], where t is the number of generations (around eight generations in this experiment), x1t and x2t are the frequencies of strains 1 and 2 at time 48 h, and x10 and x20 are the frequencies of strains 1 and 2 at the time of inoculation.
Continuous culture competition experiments. Competition experiments were conducted in four different nutrient-limited conditions: glucose-, ammonium-, phosphate- and sulphate-limited (Baganz et al, 1998). An equal volume of overnight cultures of three strains (rscWT, ScT1 and ScT1T2) was inoculated into a flask containing 100 ml medium and allowed to compete for 66 generations in a Fedbatch-pro (Das Gip Technology) system, at 30°C, pH 4.5 and shaking at 200 rpm, with a dilution rate of 0.125 h−1. Samples were taken every 4 days (about 18 generations) to assess strain frequencies by quantitative PCR (see below). Each competition experiment was conducted in four replicates. Selection coefficients were determined from the strain frequencies after 53 generations of culture to avoid bias due to uncontrolled mutations. Indeed, mutations with an effect on growth tend to occur every 50 generations (Brown et al, 1998; Ferea et al, 1999).
Quantitative PCR. Strain frequencies were estimated by quantitative PCR and densitometry (Baganz et al, 1998). Genomic DNA was extracted with the Nucleon MiY kit (Amersham). PCR reactions with primers 6F, 6R, 7R and 16F, 16R, 7bf were used to assess the frequency of the VI/VIIt and VII/XVIt translocations, respectively. For each experiment, all reactions were carried out simultaneously with the same Master Mix. PCR conditions were 94°4 min–(94°45″–57°45″–72°1 min) × 35–72°5 min. PCR products were run on 1.5% agarose in TAE gels stained with 0.2 μg/ml ethidium bromide. Densitometry was performed using Quantity One software (Bio-Rad). The strain frequencies were then interpolated from calibration curves constructed from strain mixtures of known frequencies. Estimations from three PCR reactions per sample were averaged to give the final value. Selection coefficients were calculated as for the batch experiment, except that each strain's frequency was compared with the sum of the frequencies of the two competing strains.
Acknowledgments
We thank Allen Moore for critical reading of the manuscript. This work was supported by grants to S.G.O. from the Wellcome Trust and from the NERC Environmental Genomics Programme.
References
- Baganz F, Hayes A, Farquhar R, Butler PR, Gardner DCJ, Oliver SG (1998) Quantitative analysis of yeast gene function using competition experiments in continuous culture. Yeast 14: 1417–1427 [DOI] [PubMed] [Google Scholar]
- Baudin A, Ozier-Kalogeropoulos O, Denouel A, Lacroute F, Cullin C (1993) A simple and efficient method for direct gene deletion in Saccharomyces cerevisiae. Nucleic Acids Res 21: 3329–3330 [DOI] [PMC free article] [PubMed] [Google Scholar]
- Brown CJ, Todd KM, Rosenzweig RF (1998) Multiple duplications of yeast hexose transport genes in response to selection in a glucose-limited environment. Mol Biol Evol 15: 931–942 [DOI] [PubMed] [Google Scholar]
- Delneri D, Tomlin GC, Wixon JL, Hutter A, Sefton M, Louis EJ, Oliver SG (2000) Exploring redundancy in the yeast genome: an improved strategy for use of the cre/loxP system. Gene 252: 127–135 [DOI] [PubMed] [Google Scholar]
- Delneri D, Colson I, Grammenoudi S, Roberts IN, Louis EJ, Oliver SG (2003) Engineering evolution to study speciation in yeasts. Nature 422: 68–72 [DOI] [PubMed] [Google Scholar]
- Dunham MJ, Badrane H, Ferea T, Adams J, Brown PO, Rosenzweig F, Botstein D (2002) Characteristic genome rearrangements in experimental evolution of Saccharomyces cerevisiae. Proc Natl Acad Sci USA 99: 16144–16149 [DOI] [PMC free article] [PubMed] [Google Scholar]
- Dykhuizen DE (1993) Chemostats used for studying natural selection and adaptive evolution. Methods Enzymol 224: 613–631 [DOI] [PubMed] [Google Scholar]
- Ferea TL, Botstein D, Brown PO, Rosenzweig RF (1999) Systematic changes in gene expression patterns following adaptive evolution in yeast. Proc Natl Acad Sci USA 96: 9721–9726 [DOI] [PMC free article] [PubMed] [Google Scholar]
- Fernandez-Iriarte P, Hasson E (2000) The role of the use of different host plants in the maintenance of the inversion polymorphism in the cactophilic Drosophila buzzatti. Evol Int J Org Evol 54: 1295–1302 [DOI] [PubMed] [Google Scholar]
- Fischer G, James SA, Roberts IN, Oliver SG, Louis EJ (2000) Chromosomal evolution in Saccharomyces. Nature 405: 451–454 [DOI] [PubMed] [Google Scholar]
- Fischer G, Neuveglise C, Durrens P, Gaillardin C, Dujon B (2001) Evolution of gene order in the genomes of two related yeast species. Genome Res 11: 2009–2019 [DOI] [PubMed] [Google Scholar]
- Gietz R, Schiestl R, Willems A, Woods R (1995) Studies on the transformation of intact yeast cells by the LiAc/SS-DNA/PEG procedure. Yeast 11: 355–360 [DOI] [PubMed] [Google Scholar]
- Greig D, Travisano M (2004) The prisoner's dilemma and polymorphism in yeast SUC genes. Proc R Soc Lond B (Suppl) 271: S25–S26 [DOI] [PMC free article] [PubMed] [Google Scholar]
- Hughes TR et al. (2000) Widespread aneuploidy revealed by DNA microarray expression profiling. Nat Genet 25: 333–337 [DOI] [PubMed] [Google Scholar]
- Huynen MA, Snel B, Bork P (2001) Inversions and the dynamics of eukaryotic gene order. Trends Genet 17: 304–306 [DOI] [PubMed] [Google Scholar]
- Keogh RS, Seoighe C, Wolfe KH (1998) Evolution of gene order and chromosome number in Saccharomyces, Kluyveromyces and related fungi. Yeast 14: 443–457 [DOI] [PubMed] [Google Scholar]
- Lafon-Lafourcade S (1983) Wine and brandy. Biotechnology 5: 81–163 [Google Scholar]
- Langkjaer RB, Nielsen ML, Daugaard PR, Liu W, Piskur J (2000) Yeast chromosomes have been significantly reshaped during their evolutionary history. J Mol Biol 304: 271–288 [DOI] [PubMed] [Google Scholar]
- Llorente B et al. (2000) Genomic exploration of the hemiascomycetous yeasts: 18. Comparative analysis of chromosome maps and synteny with Saccharomyces cerevisiae. FEBS Lett 487: 101–112 [DOI] [PubMed] [Google Scholar]
- Mable BK (2001) Ploidy evolution in the yeast Saccharomyces cerevisiae: a test of the nutrient limitation hypothesis. J Evol Biol 14: 157–170 [DOI] [PubMed] [Google Scholar]
- Naumov GI, James SA, Naumova ES, Louis EJ, Roberts IN (2000) Three new species in the Saccharomyces sensu stricto complex: Saccharomyces cariocanus, Saccharomyces kudriavzevii and Saccharomyces mikatae. Int J Syst Evol Microbiol 50: 1931–1942 [DOI] [PubMed] [Google Scholar]
- Péréz-Ortín JE, Querol A, Puig S, Barrio E (2002) Molecular characterization of chromosomal rearrangement involved in the adaptive evolution of yeast strains. Genome Res 12: 1533–1539 [DOI] [PMC free article] [PubMed] [Google Scholar]
- Špírek M, Yang J, Groth C, Petersen RF, Langkjaer RB, Naumova ES, Sulo P, Naumov GI, Piskur J (2003) High-rate evolution of Saccharomyces sensu lato chromosomes. FEMS Yeast Res 3: 363–373 [DOI] [PubMed] [Google Scholar]
- Wach A, Brachat A, Pohlmann R, Philippsen P (1994) New heterologous modules for classical or PCR-based gene disruptions in Saccharomyces cerevisiae. Yeast 10: 1793–1808 [DOI] [PubMed] [Google Scholar]