Abstract
The peroxisome proliferator-activated receptor gamma (PPARγ) controls adipogenesis and metabolism. We demonstrate here that the absence of PPARγ in fat has potent osteogenic activities, which affect haematopoiesis. The congenital absence of PPARγ in fat of lipodystrophic PPARγhyp/hyp mice, strongly enhanced bone mass and consequentially reduced the bone-marrow cavity. Consistent with this, PPARγhyp/hyp mice had a significant decrease in bone marrow cellularity and resorted to extramedullary haematopoiesis in the spleen to maintain haematopoiesis. Our data indicate that antagonizing PPARγ activity in fat could be an effective way to combat osteoporosis and suggest that haematopoietic function should be scrutinized in lipodystrophic subjects.
Keywords: osteoporosis, nuclear receptors, lipodystrophy, extramedullary haematopoiesis
Introduction
Peroxisome proliferator-activated receptor gamma (PPARγ) is a nuclear receptor that controls not only adipogenesis but also the endocrine function of adipose tissue (Cock et al, 2004). PPARγ activity is governed by binding of fatty acids or synthetic compounds with antidiabetic activity, including thiazolidinediones, such as rosiglitazone and pioglitazone (Picard & Auwerx, 2002). These compounds represent one of the most effective therapies for type 2 diabetes. PPARγ activation, however, induces multiple effects that go beyond the control of metabolism and range from effects on cell proliferation and immune function, to the most recent implication in bone homeostasis.
The influence of PPARγ on bone homeostasis was first indicated by a silent single-nucleotide polymorphism of PPARγ that was associated with lower bone mineral density (BMD) (Ogawa et al, 1999) and higher leptin levels (Meirhaeghe et al, 1998). Genetic, genomic and pharmacological studies suggested that lipoxygenase 12/15, an enzyme that produces endogenous PPARγ ligands (Klein et al, 2004), and synthetic PPARγ agonists (Rzonca et al, 2004) adversely affect bone formation in mice. The interpretation of such studies, using natural and synthetic PPARγ agonists, is complicated because they reflect PPARγ-dependent and PPARγ-independent effects (Picard & Auwerx, 2002). Genetic PPARγ-deficient animal models are not fraught with such problems and allow careful dissection of receptor-mediated effects. The recent observation that heterozygous PPARγ deficiency in mice enhanced bone mass due to increased osteoblastogenesis is consistent with a role of PPARγ in determining bone mass (Akune et al, 2004), but it is still not defined in which tissue PPARγ contributed to enhanced bone formation.
We independently ascertained the contribution of PPARγ to bone homeostasis, in the severely lipodystrophic PPARγhyp/hyp mice, which have a hypomorphic mutation at the PPARγ2 locus that not only results in an absence of PPARγ2 expression but also drastically reduces PPARγ1 levels to almost undetectable levels in white adipose tissue (WAT; Koutnikova et al, 2003). This congenital and selective deficit in PPARγ expression in WAT of the PPARγhyp/hyp mice results in lipodystrophy, which severely impedes bone marrow haematopoiesis, favouring extramedullary haematopoiesis in the spleen, highlighting the importance of PPARγ in WAT in whole-body homeostasis.
Results
The absence of PPARγ changes bone architecture
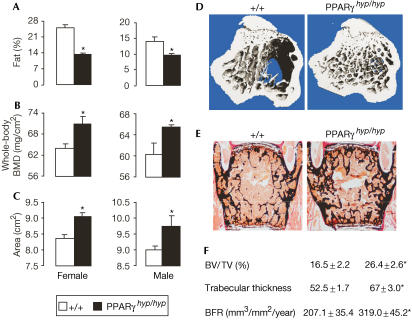
Previously, we demonstrated that the PPARγhyp/hyp mice, which congenitally lack PPARγ in WAT, were severely lipodystrophic (Koutnikova et al, 2003). Dual-energy X-ray absorptiometry (DEXA) analysis in PPARγhyp/hyp mice showed that both sexes not only had a lower fat mass (Fig 1A) but also an increased BMD and bone area (Fig 1B,C). Micro-computed tomography (micro-CT) and histomorphometric analyses showed an increase in bone content (ratio of bone volume/trabecular volume (BV/TV), 38%) and trabecular thickness (22%) in lumbar vertebrae of PPARγhyp/hyp mice (Fig 1D–F). Similar increases in bone content and trabecular thickness were observed in femurs (not shown). These increases are secondary to increased bone formation rate (BFR, 35%; Fig 1F), demonstrating that the decrease in PPARγ activity in fat enhances bone formation.
Figure 1.
Increased bone mass in lipodystrophic PPARγhyp/hyp mice. (A–C) DEXA analysis of adult wild-type (white bars) or PPARγhyp/hyp mice (black bars; n>10) in both sexes quantifying (A) whole-body fat content, (B) whole-body BMD and (C) bone area. (D) Micro-CT image and (E) histological analysis of vertebrae of 3-month-old wild-type and PPARγhyp/hyp mice. Mineralized bone matrix is stained in black by von Kossa. (F) Histomorphometric parameters, bone volume over tissue volume (BV/TV), trabecular thickness and BFR (n=8; *P<0.05).
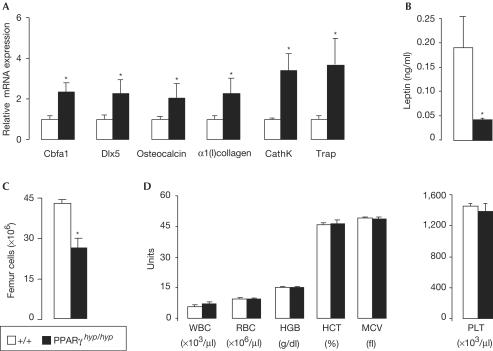
The absence of PPARγ in PPARγhyp/hyp mice affected both osteoblast and osteoclast activities. The increased osteoblast activity in bone of PPARγhyp/hyp mice was signified by increased mRNA levels of the osteoblast-specific transcription factors Dlx5 and Runx2/Cbfa1 and markers such as 1(I)collagen and osteocalcin (Fig 2A). Bone formation and resorption are coupled (Harada & Rodan, 2003); hence with the increase in BFR in PPARγhyp/hyp mice, it was not surprising that genes that typify the osteoclastic lineage, tartrate-resistant acid phosphatase (Trap) and cathepsin K (CathK) were increased (Fig 2A). Decreases in PPARγ activity in this lipodystrophic mouse model also robustly reduced leptin levels (Fig 2B), which was shown to enhance bone formation in the mouse (Ducy et al, 2000; Takeda et al, 2002). Also in humans, low leptin levels in patients with lipodystrophy have been correlated with enhanced bone formation (Elefteriou et al, 2004). Because of the increased bone content, the PPARγhyp/hyp mice had 40% less total bone marrow cells (Fig 2C). Bone marrow is the principal site of adult haematopoiesis; peripheral blood and leukocyte counts were, however, not different between the genotypes (Fig 2D and data not shown).
Figure 2.
Increased bone formation and consequential deceased bone cavity of PPARγhyp/hyp mice. (A) Relative expression levels of mRNA of osteoblast- and osteoclast-specific markers in bone and bone marrow of wild-type and PPARγhyp/hyp mice, determined by RT–PCR (n=4); CathK, cathepsin K; Trap, tartrate-resistant acid phosphatase. (B) Serum leptin levels (n>10). (C) Bone marrow cell number within femurs (n=4). (D) Complete blood count analysing white (WBC) and red blood cell (RBC) counts, haematocrit (HCT), haemoglobin (HGB), erythrocyte indexes (mean corpuscular haemoglobin, mean corpuscular haemoglobin concentration, mean corpuscular volume (MCV)) and platelets (PLT) in PPARγhyp/hyp and wild-type male mice (n=8–10; *P<0.05).
Extramedullary erythromyelopoiesis in enlarged spleens
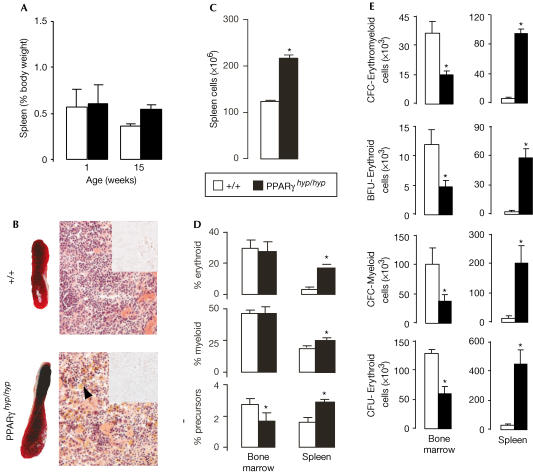
We also investigated alternative sites for haematopoiesis in the spleen and liver. Whereas spleens of neonatal PPARγhyp/hyp mice were normal in size, adult PPARγhyp/hyp mice showed a twofold increase in spleen size and cell number (Fig 3A–C). Adult PPARγhyp/hyp livers were normal in size and function (Koutnikova et al, 2003), and showed no clinical indications of portal hypertension or haematopoiesis (not shown). The PPARγhyp/hyp spleens showed no signs of lipid accumulation or infiltrative diseases, but only a pronounced accumulation of megakaryocytes, which is indicative of extramedullary haematopoiesis (Fig 3B). To evaluate the existence of extramedullary haematopoiesis, different haematopoietic lineages were examined in PPARγhyp/hyp animals. In bone marrow, absolute numbers of myeloid (Gr1+:granulocyte specific and CD11b/Mac1+:myeloid specific in rodents and humans) and erythroid (TER119+:erythroid specific) cells were reduced in PPARγhyp/hyp mice, but the proportions remained unchanged between the genotypes (Fig 3D). In contrast, the proportion and absolute numbers of myeloid and erythroid cells were consistently increased in the PPARγhyp/hyp spleen. The relative and absolute size of the population of immature haematopoietic cells (negative for differentiation markers and positive for the cytokine receptor c-kit) was decreased in bone marrow and increased in spleen (Fig 3D). The absolute numbers of all types of erythroid and myeloid progenitors declined in PPARγhyp/hyp bone marrow (Fig 3E). Conversely, all progenitors were markedly increased in the PPARγhyp/hyp spleen (Fig 3E). Although cell numbers were reduced, the proportion of erythroid and myeloid cells in the PPARγhyp/hyp bone marrow did not differ from wild type (not shown), suggesting that erythroid and myeloid cell differentiation is not modified by the changed bone microenvironment, but just limited. Overall, these observations suggest that bone marrow haematopoiesis is lost because of increased bone area and decreased bone marrow space in PPARγhyp/hyp animals. The haematopoietic defect is offset by extramedullary haematopoiesis in the PPARγhyp/hyp spleen. Extramedullary haematopoiesis is also reported in humans, in which bone marrow space is reduced due to osteopetrosis (Freedman & Saunders 1981; Caluser et al, 1995).
Figure 3.
Haematopoietic rearrangement in PPARγhyp/hyp mice due to decreased bone marrow cellularity. (A) The spleen/body weight in neonatal and adult wild-type and PPARγhyp/hyp mice. (B) Gross morphology, histology (× 6,000) and Oil-Red O staining of the spleen of adult PPARγ+/+ and PPARγhyp/hyp mice; megakeratocytes are indicated by the arrowhead. (C) Spleen cell number of adult mice. (D) Proportion of erythroid, myeloid and precursor populations determined using flow cytometry in bone marrow and spleen (n=4). (E) The methylcellulose colony assay measured the absolute number of each type of progenitor per organ (spleen and two femurs for bone marrow) for PPARγhyp/hyp and wild-type animals (n=4). Erythromyeloid progenitor quantification was performed. CFC-Erythromyeloid cells are immature progenitors, which give rise to mixed erythromyeloid colonies; BFU-Erythroid and CFC-Myeloid cells are immature progenitors with respective erythroid or myeloid potential; CFU-Erythroid cells are mature erythroid progenitors (*P<0.05).
Haematopoietic defects are indirect
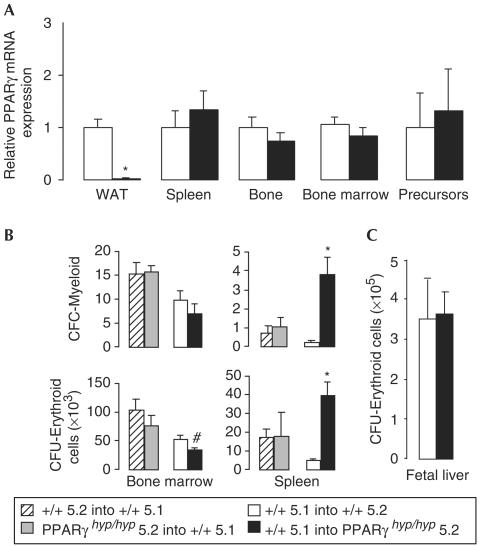
The changes observed in bone physiology and haematopoiesis between the two genotypes were not related to differences in PPARγ expression in spleen, bone, bone marrow or haematopoietic precursors (Fig 4A). The only difference in gene expression was the virtual absence of expression of both PPARγ1 and 2 within adipose tissue of PPARγhyp/hyp mice (Fig 4A). Unfortunately, PPARγ isoformspecific knockout animals will have to be generated to determine the relative contribution of each specific PPARγ isoform to the bone phenotype and to exclude that the loss of PPARγ2 may lead to specific alterations of the bone phenotype, which are independent of the overall levels of PPARγ1 in WAT.
Figure 4.
PPARγhyp/hyp mice do not have intrinsic haematopoietic abnormalities. (A) Relative level of PPARγ mRNA in white adipose tissue, bone, spleen, bone marrow and haematopoietic precursor cells from bone marrow of wild-type and PPARγhyp/hyp mice (n=4; *P<0.05). (B) Haematopoietic reconstitution 7 weeks after transplantation of bone marrow cells into lethally irradiated recipients. Absolute number of erythroid (CFU-Erythroid) and myeloid (CFC-Myeloid) progenitor cells per organ (n=4). Bone marrow cells from PPARγhyp/hyp (grey bars) or wild-type littermates (Ly-5.2; striped bars) were transplanted into C57Bl/6Ly-5.1 recipient mice or donor cells from C57Bl/6Ly-5.1 mice were transplanted into wild-type (Ly-5.2; white bars) and PPARγhyp/hyp (Ly-5.2; black bars) mice. (C) Erythroid progenitors (CFU-Erythroid) in E18.5 embryonic livers for each genotype (n=4; *P<0.05, #P<0.06).
To determine whether the haematopoietic phenotype was due to an intrinsic defect of PPARγhyp/hyp haematopoietic cells, we performed bone marrow reconstitution experiments. Bone marrow cells from PPARγhyp/hyp or wild-type mice, both expressing the Ly-5.2 marker, were transferred into lethally irradiated wild-type C57Bl/6 mice expressing the Ly-5.1 marker (C57Bl/6Ly-5.1) and vice versa. Successful reconstitution (85–95%) by haematopoietic cells of donor origin was confirmed by analysis of surface markers seven weeks later (not shown). When C57Bl/6Ly-5.1 mice were reconstituted with either PPARγhyp/hyp or wild-type cells, no differences were detected in the number of erythroid (CFU-E), myeloid (CFC-M) or mixed (CFC-EM) progenitor cells in bone marrow or spleen (Fig 4B and data not shown). Conversely, when PPARγhyp/hyp or wild-type littermate mice were reconstituted with donor cells from C57Bl/6Ly-5.1 mice, fewer haematopoietic progenitors were detected in bone marrow (CFU-E were reduced) and significantly more erythroid (BFU-E and CFU-E), myeloid (CFC-M) and mixed (CFC-EM) progenitors were present in spleens of PPARγhyp/hyp relative to wild-type recipients (Fig 4B and data not shown). These data demonstrate that the bone marrow deficiency in PPARγhyp/hyp mice is not due to an intrinsic defect of the haematopoietic cells but rather to changes in bone cavity. These conclusions are further supported by our observations that fetal liver haematopoiesis is normal in PPARγhyp/hyp mice (Fig 4C).
Discussion
Adipocytes and osteoblasts both originate from common mesenchymal stromal precursor (MSP) cells. In vitro models suggested that PPARγ activation stimulates adipocyte differentiation of MSP cells at the expense of osteoblastogenesis (Lecka-Czernik et al, 2002). This was recently substantiated in vivo in heterozygous PPARγ-deficient mice (Akune et al, 2004) and confirmed in this study in PPARγhyp/hyp mice, which like PPARγ+/− mice showed enhanced bone formation. Moreover, low leptin levels in PPARγhyp/hyp mice suggest that PPARγ not only drives competition between adipogenic and osteoblastic differentiation of MSP cells but also could have an important antiosteogenic endocrine role. Adipocytes secrete adipokines, such as leptin, which have antiosteogenic activity in both mice and humans (Ducy et al, 2000; Takeda et al, 2002; Elefteriou et al, 2004). The contribution of other adipokines, such as adiponectin and interleukins, to bone remodelling cannot be excluded (Manolagas & Jilka, 1995; Yokota et al, 2002). As age-related bone loss is associated with bone marrow lipid accumulation (Nuttall & Gimble, 2000), it has also been suggested that PPARγ could drive the age-related increase in adipocytes and decline of osteoblasts in bone, due to enhanced ligand availability (fatty acids; Lecka-Czernik et al, 1999, 2002). The importance of ligand availability for the antiosteogenic actions of PPARγ was recently illustrated by the improved bone density and strength following genetic and pharmacological inhibition of 12/15-lipoxygenase, an enzyme that generates endogenous PPAR ligands (Klein et al, 2004). Conversely, PPARγ activation by thiazolidinediones reduces bone integrity, in as little as seven weeks in mice (Rzonca et al, 2004). So far, there are no clinical data that correlate changes in BMD with treatment with PPARγ agonists. It would be of considerable concern if such effects were to occur in the many patients with type 2 diabetes who are receiving thiazolidinediones. Given the species differences in bone homeostasis, it is imperative that eventual effects of PPARγ agonists on bone integrity are ascertained in clinical studies.
Recently, evidence has been accumulating that osteoblasts support haematopoietic stem cell development (Calvi et al, 2003; Zhang et al, 2003). The enhanced bone formation in PPARγhyp/hyp animals hence leads us to expect more haematopoietic precursor cells. Even though we did not analyse the haematopoietic stem cell compartment in PPARγhyp/hyp bone marrow, the large decrease in both erythro/myeloid colony-forming precursors and the Lin−c-kit+ population argues against an increase in the haematopoietic stem cell population. In fact, positive effects of osteoblasts on haematopoiesis requires an increase in contact area between osteoblastic and haematopoietic cells (Calvi et al, 2003; Zhang et al, 2003). A massive increase in bone formation will lead to a decrease of this contact area, which adversely affects haematopoiesis, as seen in PPARγhyp/hyp mice. The result would force migration of the haematopoietic precursor cells to the spleen, where we demonstrated a robust increase in haematopoietic precursors. Bone marrow reconstitution experiments in lethally irradiated mice demonstrated that the bone marrow deficiency in PPARγhyp/hyp mice was not due to an intrinsic defect of haematopoietic cells but rather to changes in bone cavity. The increased number of spleen cells, on repopulating sublethally irradiated PPARγhyp/hyp recipient mice with wild-type donor cells, further proved that the restricted bone marrow space was directly causing the increase in spleen cell numbers.
Extramedullary haematopoiesis has previously been described in osteopetrotic mice (Tagaya et al, 2000) and humans (Freedman & Saunders 1981; Caluser et al, 1995). Our study suggests that an enlarged spleen observed in other lipodystrophic mouse models and patients with lipodystrophy (Moitra et al, 1998; Shimomura et al, 1998; Misra & Garg, 2003) cannot be attributed to infiltrative processes or steatotic liver dysfunction and portal hypertension alone, but also to bone abnormalities. Increased bone volume not only decreases bone total cellularity but it may also change cell–cell interactions within bone microenvironment, which are important for haematopoietic differentiation (Okubo et al, 2002). In view of this, the proportion of haematopoietic cells present in the bone marrow did not differ between genotypes, indicating that the possible alterations in cell–cell interactions do not lead to a major disruption of haematopoiesis. Hence, reduction in erythromyelopoiesis within bone marrow is most likely a consequence of space limitations. These bone abnormalities, together with the decreased expression of adipokines that support haematopoietic differentiation (Bennett et al, 1996; Mikhail et al, 1997), cause the extramedullary haematopoiesis in PPARγhyp/hyp mice. No haematopoietic abnormalities have so far been reported in human lipodystrophic or lipoatrophic patients. This could be due to the apparently normal peripheral blood analysis in these patients, which does not incite physicians to analyse this further. Splenomegaly is, however, a common clinical abnormality in human lipodystrophy (Rajab et al, 2002; Misra & Garg, 2003). Furthermore, enhanced bone formation was reported in human lipodystrophy patients (Elefteriou et al, 2004). These observations hence warrant systematic investigation of bone homeostasis and haematopoiesis in response to severe changes in adiposity in humans.
In summary, the specific absence of PPARγ in fat robustly increases bone mass by favouring osteogenic over adipogenic differentiation of MSP cells. In addition, absence of PPARγ in adipocytes limits their capacity to secrete antiosteogenic signalling factors, such as leptin, further enhancing the bone phenotype. Previous studies on the role of PPARγ in bone homeostasis did not allow us to make this conclusion or enable to unequivocally pinpoint PPARγ specifically in WAT as causative factor for the changes in bone architecture, as they involved changes in PPARγ activity in all tissues (agonists (Rzonca et al, 2004) and the heterozygous PPARγ+/− mice model (Akune et al, 2004)). If our data and other recently published mouse studies can be extrapolated to humans, inhibition of PPARγ activity could be an interesting strategy to combat osteoporosis. Furthermore, the splenomegaly in lipodystrophic patients also needs to be revisited, as it might reflect reactivation of haematopoiesis that occurs in the wake of the reduction in bone marrow cavity.
Methods
Animal experiments. Generation of PPARγhyp/hyp mice on a hybrid C57BL/6J/129 SV background has been described previously (Koutnikova et al, 2003). Unless otherwise stated, female PPARγhyp/hyp and wild-type littermates fed regular rodent chow were used at 4 months of age. Blood and tissue were collected as described previously (Koutnikova et al, 2003).
Bone analysis. Bone histology on lumbar vertebrae and BFR by calcein double labelling were performed as described previously (Takeda et al, 2002). Micro-CT analysis of L5 vertebrae was performed at 12 μm resolution (Scanco Medical, Bassersdorf, Switzerland). Lumbar vertebrae were embedded in methylmethacrylate, sectioned and stained with von Kossa, or left unstained for calcein labelling. Histomorphometric measurements were performed using the OsteoMeasure system (OsteoMetrics, Atlanta, GA). BMD and body fat mass were evaluated in anaesthetized mice by DEXA (PIXIMUS™, GE Medical Systems, Buc, France).
Haematological assays. Bone marrow and spleen cells were obtained from adult animals. Liver cells were taken from 17.5-day embryos. Methylcellulose colony assays and quantification of erythroid precursors have been described previously (Back et al, 2004). The following primary antibodies were used: phycoerythrin (PE)-anti-TER119, biotin-anti-CD71, biotin-anti-CD117 (c-kit), biotin-anti-CD11b (Mac1), PE-anti-Gr1 (all from Pharmingen, San Diego, CA, USA), purified anti-B220 (clone RA36B2), anti-Ly5.2 and PE-anti-IgM. Lineage staining was performed using antibodies against TER-119, CD3, CD4, CD8, B220, NK1.1, GR1 and F4/80. Secondary antibodies include cyanin (Cy) 5-anti-rat IgG and PE-anti-rat IgG (Jackson Immunoresearch, West Grove, PA, USA), Cy5 or fluorescein (FITC)-conjugated streptavidin.
Bone marrow reconstitutions. Recipient mice were irradiated at 9 Gy, and reconstituted 1 day later with 10 × 106 donor bone marrow cells. Mice were analysed 7 weeks after reconstitution. Donor cells or host cells were identified by the appropriate Ly-5.1 or Ly-5.2 expression by flow cytometry.
RNA analysis. RNA preparation and quantitative RT–PCR were described previously (Koutnikova et al, 2003). Sequences of primers used are available at http://www-igbmc.u-strasbg.fr/Auwerx or in Rzonca et al (2004). Glyceraldehyde-3-phosphate dehydrogenase mRNA or 18S rRNA was used as a control.
Data analysis. Data are presented as mean±s.e.m. and statistical differences analysed using Student's t-test.
Acknowledgments
This work was supported by grants from CNRS, INSERM, Hopitaux Universitaires de Strasbourg, ARC (7759), European Union (QLRT-2001-00930) and NIH (1-P01-DK59820-01).
References
- Akune T et al. (2004) PPAR γ insufficiency enhances osteogenesis through osteoblast formation from bone marrow progenitors. J Clin Invest 113: 846–855 [DOI] [PMC free article] [PubMed] [Google Scholar]
- Back J et al. (2004) PU.1 determines the self-renewal capacity of erythroid progenitor cells. Blood 103: 3615–3623 [DOI] [PubMed] [Google Scholar]
- Bennett BD et al. (1996) A role for leptin and its cognate receptor in hematopoiesis. Curr Biol 6: 1170–1180 [DOI] [PubMed] [Google Scholar]
- Caluser C, Scott A, Macapinlac H, Yeh S, Rosenfelt N, Farid B, Abdel-Dayem HM, Larson SM, Kalaigian H (1995) Extramedullary hematopoiesis assessment in a patient with osteopetrosis. Clin Nucl Med 20: 75. [DOI] [PubMed] [Google Scholar]
- Calvi LMA et al. (2003) Osteoblastic cells regulate the hematopoietic stem cell niche. Nature 425: 841–847 [DOI] [PubMed] [Google Scholar]
- Cock TA et al. (2004) PPARγ: too much of a good thing causes harm. EMBO Rep 5: 142–147 [DOI] [PMC free article] [PubMed] [Google Scholar]
- Ducy P et al. (2000) Leptin inhibits bone formation through a hypothalamic relay: a central control of bone mass. Cell 100: 197–207 [DOI] [PubMed] [Google Scholar]
- Elefteriou F et al. (2004) Serum leptin level is a regulator of bone mass. Proc Natl Acad Sci USA 101: 3258–3263 [DOI] [PMC free article] [PubMed] [Google Scholar]
- Freedman MH, Saunders EF (1981) Hematopoiesis in the human spleen. Am J Hematol 11: 271–275 [DOI] [PubMed] [Google Scholar]
- Harada S, Rodan GA (2003) Control of osteoblast function and regulation of bone mass. Nature 423: 349–355 [DOI] [PubMed] [Google Scholar]
- Klein RF et al. (2004) Regulation of bone mass in mice by the lipoxygenase gene Alox15. Science 303: 229–232 [DOI] [PubMed] [Google Scholar]
- Koutnikova H et al. (2003) Compensation by the muscle limits the metabolic consequences of lipodystrophy in PPARγ hypomorphic mice. Proc Natl Acad Sci USA 100: 14457–14462 [DOI] [PMC free article] [PubMed] [Google Scholar]
- Lecka-Czernik B, Gubrij I, Moerman EJ, Kajkenova O, Lipschitz DA, Manolagas SC, Jilka RL (1999) Inhibition of Osf2/Cbfa1 expression and terminal osteoblast differentiation by PPARγ2. J Cell Biochem 74: 357–371 [PubMed] [Google Scholar]
- Lecka-Czernik B et al. (2002) Divergent effects of selective PPARγ2 ligands on adipocyte versus osteoblast differentiation. Endocrinology 143: 2376–2384 [DOI] [PubMed] [Google Scholar]
- Manolagas SC, Jilka RL (1995) Bone marrow, cytokines, and bone remodeling. Emerging insights into the pathophysiology of osteoporosis. N Engl J Med 332: 305–311 [DOI] [PubMed] [Google Scholar]
- Meirhaeghe A et al. (1998) A genetic polymorphism of the PPARγ gene influences plasma leptin levels in obese humans. Hum Mol Genet 7: 435–440 [DOI] [PubMed] [Google Scholar]
- Mikhail AA et al. (1997) Leptin stimulates fetal and adult erythroid and myeloid development. Blood 89: 1507–1512 [PubMed] [Google Scholar]
- Misra A, Garg A (2003) Clinical features and metabolic derangements in acquired generalized lipodystrophy: case reports and review of the literature. Medicine (Baltimore) 82: 129–146 [DOI] [PubMed] [Google Scholar]
- Moitra J et al. (1998) Life without fat: a transgenic mouse. Genes Dev 12: 3168–3181 [DOI] [PMC free article] [PubMed] [Google Scholar]
- Nuttall ME, Gimble JM (2000) Is there a therapeutic opportunity to either prevent or treat osteopenic disorders by inhibiting marrow adipogenesis? Bone 27: 177–184 [DOI] [PubMed] [Google Scholar]
- Ogawa S et al. (1999) Association of bone mineral density with a polymorphism of the peroxisome proliferator-activated receptor gamma gene: PPARγ expression in osteoblasts. Biochem Biophys Res Commun 260: 122–126 [DOI] [PubMed] [Google Scholar]
- Okubo K, Yanai N, Ikawa S, Obinata M (2002) Reversible switching of expression of c-kit and Pqx-5 in immature hematopoietic progenitor cells by stromal cells. Exp Hematol 30: 1193–1201 [DOI] [PubMed] [Google Scholar]
- Picard F, Auwerx J (2002) PPARγ and glucose homeostasis. Annu Rev Nutr 22: 167–197 [DOI] [PubMed] [Google Scholar]
- Rajab A et al. (2002) Heterogeneity for congenital generalized lipodystrophy in seventeen patients from Oman. Am J Med Genet 110: 219–225 [DOI] [PubMed] [Google Scholar]
- Rzonca SO et al. (2004) Bone is a target for the antidiabetic compound rosiglitazone. Endocrinology 145: 401–406 [DOI] [PMC free article] [PubMed] [Google Scholar]
- Shimomura I et al. (1998) Insulin resistance and diabetes mellitus in transgenic mice expressing nuclear SREBP-1c in adipose tissue: model for congenital generalized lipodystrophy. Genes Dev 12: 3182–3194 [DOI] [PMC free article] [PubMed] [Google Scholar]
- Tagaya H et al. (2000) Intramedullary and extramedullary B lymphopoiesis in osteopetrotic mice. Blood 95: 3363–3370 [PubMed] [Google Scholar]
- Takeda S et al. (2002) Leptin regulates bone formation via the sympathetic nervous system. Cell 111: 305–317 [DOI] [PubMed] [Google Scholar]
- Yokota T et al. (2002) Paracrine regulation of fat cell formation in bone marrow cultures via adiponectin and prostaglandins. J Clin Invest 109: 1303–1310 [DOI] [PMC free article] [PubMed] [Google Scholar]
- Zhang JN et al. (2003) Identification of the haematopoietic stem cell niche and control of the niche size. Nature 425: 836–841 [DOI] [PubMed] [Google Scholar]


