Abstract
Mallory bodies (MBs) are cytoplasmic inclusions that contain keratin 8 (K8) and K18 and are present in hepatocytes of individuals with alcoholic liver disease, nonalcoholic steatohepatitis, or benign or malignant hepatocellular neoplasia. Mice fed long term with griseofulvin are an animal model of MB formation. However, the lack of a cellular model has impeded understanding of the molecular mechanism of this process. Culture of HepG2 cells with griseofulvin has now been shown to induce both the formation of intracellular aggregates containing K18 as well as an increase in the abundance of K18 mRNA. Overexpression of K18 in HepG2, HeLa, or COS-7 cells also induced the formation of intracellular aggregates that stained with antibodies to ubiquitin and with rhodamine B (characteristics of MBs formed in vivo), eventually leading to cell death. The MB-like aggregates were deposited around centrosomes and disrupted the microtubular array. Coexpression of K8 with K18 restored the normal fibrous pattern of keratin distribution and reduced the toxicity of K18. In contrast, an NH2-terminal deletion mutant of K8 promoted the formation of intracellular aggregates even in the absence of K18 overexpression. Deregulated expression of K18, or an imbalance between K8 and K18, may thus be an important determinant of MB formation, which compromises the function of centrosomes and the microtubule network and leads to cell death.
INTRODUCTION
The keratin family of proteins comprises >20 members and forms the intermediate filaments (IFs) of epithelial cells. These proteins are subdivided into two types: the type I (acidic) keratins and type II (neutral-basic) keratins (Moll et al., 1982). Keratins exist as heteropolymers of type I and type II subunits, and the expression of various keratin isoforms is dependent on cell type or differentiation stage (Steinert and Roop, 1988). For example, most cells in epithelia as well as in the liver, pancreas, and intestine express keratins 8 and 18 (K8-K18), whereas K5-K14 and K1-K10 are expressed in basal and suprabasal keratinocytes of the epidermis, respectively (Fuchs and Weber, 1994). In epithelial cells, keratins typically organize into a cytoplasmic reticular network of anastomosing filament bundles that are linked noncovalently and that connect the surface of the nucleus to cell adhesion complexes. The keratin network provides mechanical integrity to cells, without which they become fragile and prone to rupture (Fuchs and Cleveland, 1998).
Mallory bodies (MBs) were first described as cytoplasmic inclusions in the hepatocytes of individuals with alcoholic liver disease but were also present in the hepatocytes of patients with nonalcoholic steatohepatitis as well as in benign and malignant hepatocellular neoplasms. Despite their clinical importance, the mechanism of MB formation is poorly understood. MBs do, however, share morphological and physicochemical features with other inclusion bodies, such as spheroid bodies associated with amyotrophic lateral sclerosis (ALS). MBs have been shown to contain K8-K18 (Franke et al., 1979; Hazan et al., 1986). Furthermore, Northern blot and reverse transcription-polymerase chain reaction (PCR) analyses revealed that the abundance of keratin mRNAs is increased in the hepatocytes of mice subjected to long-term feeding with griseofulvin or 3,5-diethoxycarbonyl-1,4-dihydrocollidine (Cadrin et al., 2000; Zatloukal et al., 2000), both of which treatments induce the formation of MBs, suggesting that the amount of keratins is critical for MB formation. Keratin null and transgenic mice have recently been described. Most K8 null embryos in the C57BL/6 background die at midgestation, although this phenotype may differ in other genetic backgrounds (Baribault et al., 1993, 1994). MBs were not detected in transgenic mice expressing K8 (Casanova et al., 1999), wild-type K18 (Abe and Oshima, 1990), or mutant K18 (Ku et al., 1995). Aged K18 null mice, however, develop a distinctive liver pathology with abnormal hepatocytes containing K8-positive aggregates (Magin et al., 1998). Although these studies suggest that keratins are important for the development of MBs, the specific roles of keratins in MB formation remain unclear.
To examine these roles, we have now established an in vitro model of MB formation in cultured cells. We demonstrate that K18 is more prone to aggregate than is K8 and that K8 antagonizes the aggregation of K18. Furthermore, keratin aggregation was shown to damage the cellular array of microtubules and to reduce cell viability. These results suggest that deregulated expression of K18, or an imbalance in the relative amounts of K8 and K18, may be an important factor in the development of MBs, which, in turn, severely compromise the structure and function of the microtubule array, leading to cell death.
MATERIALS AND METHODS
Cell Culture and Drug Treatment
HepG2, HeLa, and COS-7 cells were cultured in DMEM supplemented with 10% fetal bovine serum (Invitrogen, Carlsbad, CA) and under an atmosphere of 5% CO2 with constant humidity. HepG2 cells were incubated with griseofulvin (Sigma-Aldrich, St. Louis, MO) at a concentration of 0.5, 1.0, or 2.0 μg/ml, nocodazole (Sigma-Aldrich) at a concentration of 20 ng/ml, or cisplatin (Sigma-Aldrich) at a concentration of 40 ng/ml for 10 d. HepG2 cells was regularly subjected to recloning.
Cloning of cDNA and Construction of Expression Vectors
Complementary DNAs encoding human K18 and K8 were amplified by reverse transcription-PCR from total RNA of HeLa cells. The PCR primers were as follows: 5′-GAC AGC ATG AGC TTC ACC ACT CGC-3′ and 5′-GCT GGC TTA ATG CCT CAG AAC TTT-3′ for K18, and 5′-TCC ACC ATG TCC ATC AGG GTG ACC-3′ and 5′-AGC TGT TCA CTT GGG CAG GAC GTC-3′ for K8. Complementary DNAs for K8 mutants lacking either the NH2-terminal 35 amino acids (K8ΔN) or the COOH-terminal 60 amino acids (K8ΔC) of the full-length protein were generated by appropriate enzyme digestion (XhoI for K8ΔN and SacI for K8ΔC) of the wild-type cDNA. All cDNAs encoding K8 and K18 derivatives tagged with the Myc or hemagglutinin (HA) epitope at their NH2 termini were cloned into the mammalian expression vector pcDNA3 (Invitrogen). To generate fusion proteins with enhanced green fluorescent protein (EGFP), we cloned K8 or K18 cDNAs into pEGFP-C2 (CLONTECH, Palo Alto, CA).
RNA Preparation and Northern Blot Analysis
Total RNA of cultured cells was isolated with an ISOGEN RNA preparation kit (Wako Pure Chemicals, Osaka, Japan). RNA samples (30 μg) were fractionated by electrophoresis in a 1% agarose gel containing 6% formaldehyde, and the gel was stained with ethidium bromide to verify that identical amounts of RNA were applied to each lane. The separated molecules were then transferred to a nylon membrane, which was subjected to hybridization for 16 h at 42°C with 32P-labeled K18 or K8 cDNA as a probe in a solution comprising 50% formamide, 5× saline-sodium phosphate-EDTA, 10× Denhardt's solution, salmon sperm DNA (0.1 mg/ml), and 2% SDS. A final wash was performed at 50°C with 0.2× SSC containing 0.1% SDS. The blot was then analyzed and the intensity of the signals was quantified with a BAS-2000 image analyzer (Fuji Film, Kanagawa, Japan).
Immunofluorescence Microscopy
HepG2 and COS-7 cells were grown on glass coverslips in growth medium and transfected either with the use of FuGENE 6 transfection reagent (Roche Applied Science, Indianapolis, IN) or by the calcium phosphate method (Wigler et al., 1977). Immunostaining was performed as described previously (Hatakeyama et al., 1997). Primary antibodies included those to Myc (9E10; Roche Applied Science), to the HA (Y-11; Santa Cruz Biotechnology, Santa Cruz, CA), to K18 (DC-10; Santa Cruz Biotechnology), to ubiquitin (1B3; MBL, Nagoya, Japan), to pericentrin (GTU-88, Sigma-Aldrich), to β-COP (antibody-1; Oncogene Science, Cambridge, MA), and to β-tubulin (TUB 2.1; Sigma-Aldrich), and they were detected with Alexa 488- or Alexa 546-conjugated antibodies to rabbit or mouse IgG (Molecular Probes, Eugene, OR). Staining of MBs in cultured cells with 0.001% rhodamine B (Wako Pure Chemicals) was performed as described previously (Wessely et al., 1981). Hoechst33258 (1 μg/ml) or propidium iodide (PI) (1 μg/ml) was used for the staining of nuclei. Stained cells were observed by confocal laser microscopy (FLUOVIEW FV500; Olympus, Tokyo, Japan) or with an Eclipse E800 M microscope (Nikon, Tokyo, Japan) equipped with a color chilled 3 charge-coupled device camera (C5810; Hamamatsu Photonics, Hamamatsu, Japan).
Flow Cytometry
HeLa cells were transfected with plasmids encoding EGFP-keratin fusion proteins and then cultured for 2 d. Apoptotic or necrotic cells were detected by staining with propidium iodide (10 μg/ml) (Sigma-Aldrich) followed by flow cytometry with a FACSCalibur instrument and analysis with Cell Quest software (BD Biosciences, San Jose, CA).
Electron Immunocytochemistry
HeLa cells were transfected with expression construct for Myc-K18 and cultured for 2 d. The cells were gently harvested and fixed with mixture of 4% glutaraldehyde and 2% paraformaldehyde in 0.1 M cacodylate buffer, pH 7.4, containing 3.4% sucrose and 3 mM CaCl2. Ultrathin sections were prepared from these cells embedded in LR White resin (London Resin, Berkshire, United Kingdom). The sections were treated with anti-Myc and protein A-gold (E. Y. Labs, San Mateo, CA), and gold signals were observed by JEM 2000EX electron microscope (JOEL, Tokyo, Japan).
Doxycycline (Dox)-regulated Expression of K8 Derivatives
HeLa cells were transfected with the reverse tetracycline (tet)-responsive transcriptional activator construct (pTet-On; CLONTECH) and selected with 1 mg/ml G418. A clone showing high-level induction by Dox was used for the expression of tet-regulated constructs. pUHD10-3 containing cDNAs encoding HA-K8FL and HA-K8ΔN was transfected to the clone with pTK-Hyg (CLONTECH), and the cells were selected with 200 μg/ml hygromycin. The expression construct for EGFP-K18 was transiently expressed in the established stable lines, and the aggregate formation in the cells was scored under the immunofluorescence microscopy.
Immunoblot Analysis
Cultured cells were subsequently harvested and lysed in sample buffer containing 9.5 M urea, 4% (vol/vol) Ampholytes (Bio-Lyte, pH 3–10; Bio-Rad, Hercules, CA), 2% (vol/vol) Nonidet P-40, and 5% (vol/vol) β-mercaptoethanol. The lysates were subjected to SDS-PAGE. The separated proteins were subsequently subjected to immunoblot analysis with antibodies to HA (HA11; Research Diagnostics, Flanders, NJ), green fluorescent protein (GFP) (1E4; MBL) and GSK-3β (clone7; Transduction Laboratories, Lexington, KY). Immune complexes were detected with appropriate horseradish peroxidase-conjugated secondary antibodies and SuperSignal West Pico chemiluminescence reagents (Pierce Chemical, Rockford, IL).
RESULTS
Griseofulvin-induced Increase in K18 Expression in Cultured Cells
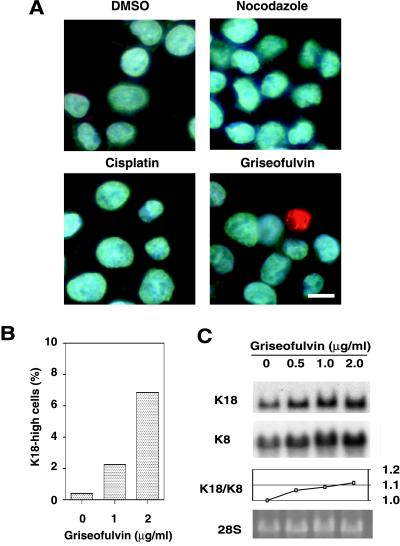
Although the griseofulvin-fed mouse is studied as a model of MB formation, the effects of this compound on cultured cells have been unclear. In an attempt to establish an in vitro system for the study of MB formation in cultured cells, we incubated HepG2 (human hepatoma) cells in the presence of griseofulvin for 10 d. The cells were then stained with antibodies to K18 (Figure 1A). In contrast to cells cultured in the presence of dimethyl sulfoxide (vehicle control), a proportion of the griseofulvin-treated cells exhibited an increased abundance of K18, suggesting the existence of a threshold in the response to griseofulvin. Cells treated with nocodazole, which inhibits polymerization of microtubules, or cisplatin, which is a DNA-damaging agent, did not exhibit the increased abundance of K18 as seen in those treated with griseofulvin. The frequency of cells highly expressing K18 increased in a griseofulvin concentration-dependent manner, being ∼7% at a concentration of 2 μg/ml but only 0.3% in the absence of this agent (Figure 1B). Northern blot analysis revealed that griseofulvin also induced a concentration-dependent increase in the amount of K18 and K8 mRNA in HepG2 cells (Figure 1C). The ratio of K18/K8 mRNA was increased in a dose-dependent manner, suggesting that the imbalance of the mRNA ratio (excess of K18 mRNA over K8 mRNA) may lead to the aggregate formation. We also observed that a small proportion of treated cells (<1%) exhibited a pattern of immunostaining indicative of K18 aggregation (Figure 1A). The heterogeneity of K18 expression and aggregation formation in HepG2 cells does not seem to be attributed to the efflux system mediated by P-glycoprotein, given that there was no differences in expression of P-glycoprotein in responsive/nonresponsive HepG2 cells (our unpublished data). These data suggest that MB formation in the hepatocytes of griseofulvin-fed mice results from a direct action of this agent on these cells and is likely attributable to an increase in K18 expression that is mediated at the transcriptional level.
Figure 1.
Griseofulvin-induced increase in the expression of K18 in HepG2 cells. (A) Immunofluorescence analysis of the effect of griseofulvin on the abundance of K18 in HepG2 cells. Cells were incubated for 10 d in the presence of 0.2% dimethyl sulfoxide (vehicle), nocodazole (20 ng/ml), cisplatin (40 ng/ml), or griseofulvin (2 μg/ml), after which they were stained with antibodies to K18 (green) and the DNA-specific dye Hoechst 33258 (blue). Scale bar, 10 μm. (B) Concentration dependence of the effect of griseofulvin on the percentage of cells showing increased expression of K18. Cells were cultured for 10 d in the presence of the indicated concentrations of griseofulvin, after which the percentage of cells showing an increased concentration of K18 was determined. (C) Northern blot analysis of the effect of griseofulvin on the abundance of K18 and K8 mRNA. HepG2 cells were incubated for 10 d in the presence of the indicated concentrations of griseofulvin. Total RNA was then prepared from the cells and subjected to Northern blot analysis with a 32P-labeled K18 and K8 cDNA probes (top and second panels, respectively); the corresponding gel was also stained with ethidium bromide, and the 28S rRNA band is shown as a loading control (bottom panel). The ratios of K18 to K8 mRNA were plotted at the indicated concentrations of griseofulvin (third panel).
Intracellular Aggregation of Recombinant K18
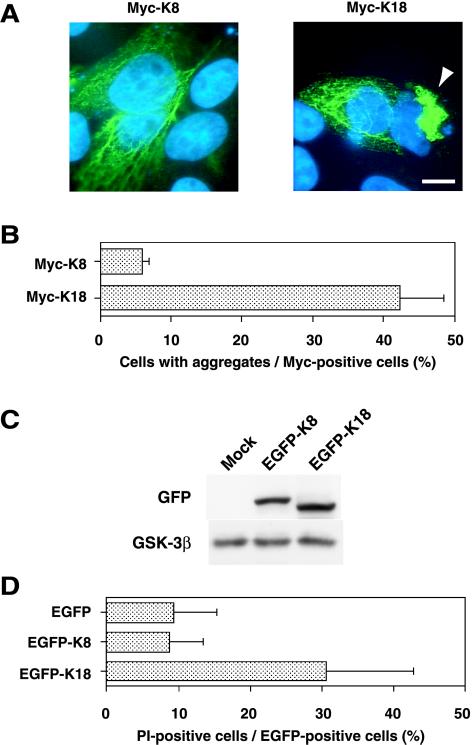
The observation that griseofulvin induced the expression and intracellular aggregation of K18 suggested that an increase in the concentration of K18 above a certain threshold might result in the aggregation of this protein and the formation of MBs. To test this hypothesis, we transfected HepG2 or HeLa cells with an expression vector encoding Myc epitope-tagged K18 or K8 and then examined the cells by immunofluorescence staining with antibodies to Myc. Expression of recombinant K18 resulted in the formation of aggregates of keratin fibers in >40% of cells of each cell type, whereas recombinant K8 exhibited a normal reticular pattern of staining, with only ∼5% of cells manifesting aggregates (Figure 2, A and B). The morphology of the nuclei of cells exhibiting K18 aggregation was altered, seeming to be distorted by the aggregates. The possible effect of keratin aggregation on cell viability was examined by two-color flow cytometric analysis of HeLa cells that had been transfected with expression plasmids encoding EGFP alone or EGFP fusion proteins of K8 or K18. Immunoblotting analysis (Figure 2C) as well as flow cytometric analysis (our unpublished data) showed that there was no significant difference in expression levels of the fusion proteins and in percentages of cells expressing the fusion proteins between cells transfected with EGFP-K8 and EGFP-K18. The transfected cells were stained with propidium iodide and electrically gated for EGFP expression, and the percentage of propidium iodide-positive cells, which were defined as apoptotic or necrotic cells, was estimated. The mortality rate of cells expressing EGFP-K18 was >30%, compared with values of <10% for cells expressing EGFP alone or EGFP-K8 (Figure 2D). These data thus indicate that overexpression of K18, but not that of K8, results in aggregate formation and cell death.
Figure 2.
Aggregate formation and cell death induced by overexpression of K18. (A) Immunofluorescence images of HepG2 cells overexpressing Myc epitope-tagged K8 or Myc-K18. Cells were transfected with expression plasmids for Myc-K8 or Myc-K18 and were then stained with antibodies to Myc (green) and Hoechst 33258 (blue). The arrowhead indicates a cell containing a large aggregate of Myc-K18 adjacent to the nucleus. Bar, 10 μm. (B) Percentage of cells containing aggregates among those expressing Myc-K8 or Myc-K18. Data are means ± SD of values from triplicate cultures. (C) Immunoblotting analysis for the expression of EGFP-K18 and EGFP-K8 in HeLa cells. HeLa cells were transfected with the expression construct for EGFP-K18 or EGFP-K8, and the lysates were subjected to immunoblotting analysis with antibodies to GFP (top) or GSK-3β (bottom). (D) Reduced viability of cells overexpressing K18. HeLa cells that had been transfected with expression vectors encoding EGFP alone, EGFP-K8, or EGFP-K18 were stained with PI and subjected to flow cytometric analysis for the detection of dead (PI-positive) cells among EGFP-expressing cells. Data are means ± SD of values from triplicate cultures.
Similarity of K18 Aggregates to MBs
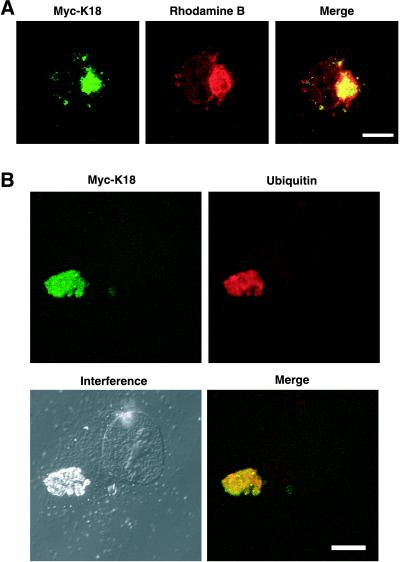
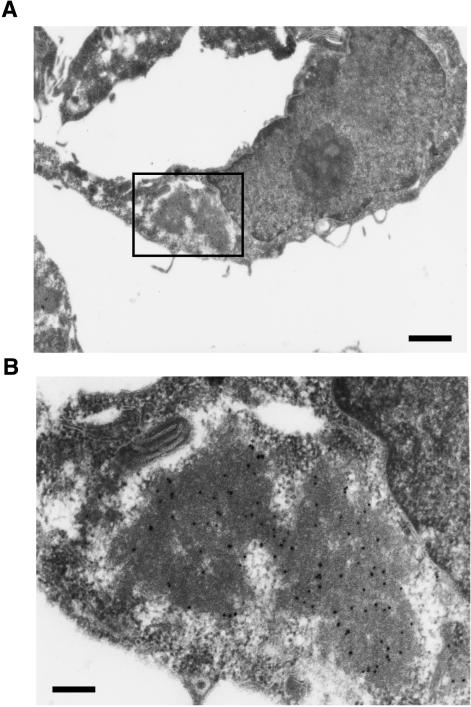
We next examined whether the aggregates induced by overexpression of K18 recapitulate the characteristics of MBs formed in vivo. These characteristics include the following: 1) MBs usually form as a single large inclusion that is located adjacent to the nucleus. 2) They are preferentially stained by acidophilic compounds such as eosin and rhodamine B; the latter is a weakly basic dye of the xanthine group and has been shown to be a sensitive and selective stain for MBs, obviating the need for immunohistochemistry or electron microscopy (Wessely et al., 1981). And 3), they contain ubiquitinated keratins, including K18. In cells expressing recombinant K18, the aggregates of this protein were often located adjacent to or surrounding the nucleus and they were stained with rhodamine B (Figure 3A). In addition, antibodies to ubiquitin reacted with the K18-containing inclusions (Figure 3B). Also, K8 was involved in the K18 aggregates as in MBs in the liver (our unpublished data). Furthermore, we prepared thin sections from HeLa cells in which Myc-K18 was expressed, and the localization of recombinant Myc-K18 was analyzed by electron microscopic immunocytochemistry, by using anti-Myc in combination with protein A-gold. The aggregates seem to be composed of high electron-dense material that reacted with anti-Myc (Figure 4). The aggregate was surrounded by low electron-dense halo, which was not reactive to anti-Myc. The aggregation has no limiting membrane and is distinguished from other organelles. The inclusion bodies in the cells overexpressing K18 thus seem to be consistent with the characteristics of MBs in the hepatocytes either of humans with alcoholic liver disease or of griseofulvin-fed mice.
Figure 3.
Characterization of the inclusion bodies in cells overexpressing K18. COS-7 cells were transfected with an expression plasmid encoding Myc-K18 and were subsequently stained with antibodies to Myc (green; left) together with either rhodamine B (A) or antibodies to ubiquitin (B) (red). Superimposed images are shown (merge). Bars, 10 μm.
Figure 4.
Electron immunocytochemical analysis of K18-aggregates. (A) HeLa cells were transfected with expression construct for Myc-K18 and embedded to prepare ultrathin slices. Myc-K18 signals in the slice were examined by electron microscopic immunocytochemistry with antibodies to Myc in combination with protein A-gold (black dots). Bars, 1 μm. (B) Higher magnification image of the boxed region in A. Bars, 200 nm.
Disruption of Microtubule Array by K18 Aggregates
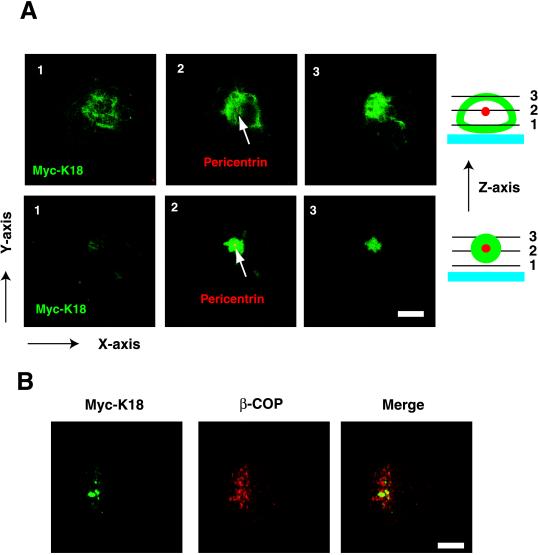
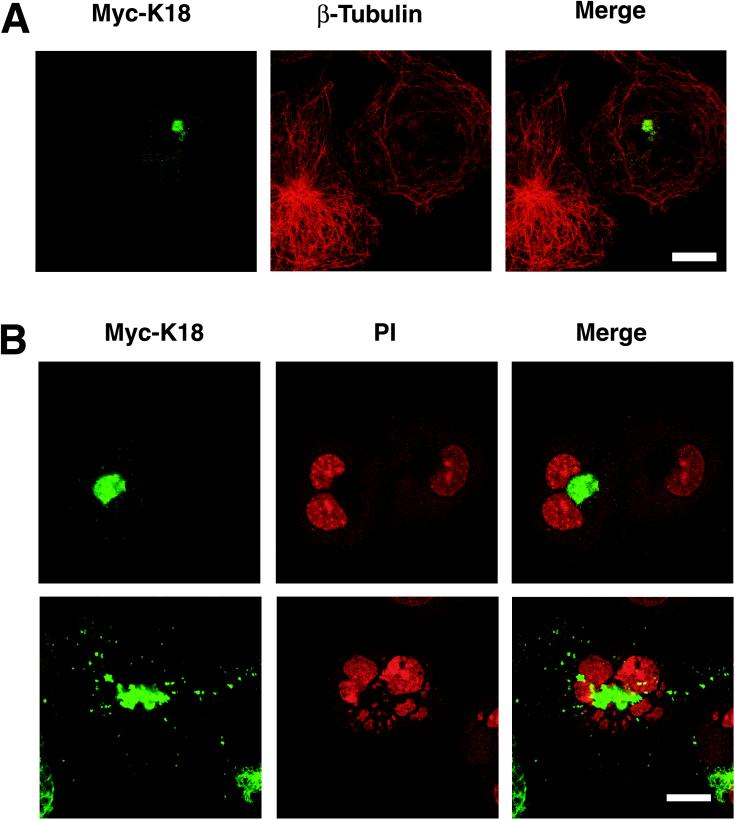
Given that the K18 aggregates were localized adjacent to the nucleus and that other intracellular inclusions are concentrated around centrosomes (Garcia-Mata et al., 1999; Wigley et al., 1999), we next investigated whether K18 aggregates are also deposited around these structures. COS-7 cells expressing Myc-K18 were stained with antibodies to pericentrin or to β-tubulin in combination with antibodies to Myc and were then observed by confocal laser microscopy. In some cells, the K18 aggregates were detected surrounding centrosomes, whereas in others, centrosomes were apparent in the center of the aggregates (Figure 5A). Dual immunofluorescence staining with anti-Myc and anti-β-COP, which is a marker of the Golgi apparatus, revealed that the K18 aggregates were not colocalized with the β-COP (Figure 5B). In addition, the electron microscopic analysis also revealed that the amorphous structures of K18 aggregation are independently localized to Golgi apparatus (our unpublished data). These observations suggest that aggregates might be transported to centrosomes, as described for the “aggresomes” induced by expression of mutant cystic fibrosis transmembrane conductance regulator (Johnston et al., 1998). The normal pattern of microtubules radiating out from a centrosome was no longer apparent in cells containing K18 aggregates; instead, microtubules appeared concentric with centrosomes in these cells (Figure 6A). Such cells often contained more than two nuclei, suggestive of a defect in cytokinesis due to impaired function of microtubules (Figure 6B). Such cells often show fragmentation of the nucleus, probably due to abnormal segregation of chromosomes and/or apoptosis. These data suggest that disruption of microtubule organization by K18 aggregates surrounding centrosomes might be responsible for the reduced viability of cells overexpressing this protein.
Figure 5.
Localization of K18 aggregates at the pericentrosomal area. (A) Formation of K18 aggregates around centrosomes. COS-7 cells that had been transfected with a plasmid encoding Myc-K18 were stained with antibodies to Myc (green) and to pericentrin (red; arrows). The two-color staining was visualized by confocal laser microscopy, and the X-Y images are displayed at the various levels of Z-axis illustrated as the right schemes. Slice, 2 μm; bars, 40 μm. (B) Localization of K18 aggregates distinct from Golgi apparatus. COS-7 cells containing Myc-K18 (green) aggregates were also stained with anti-β-COP (red), which is a marker of the Golgi apparatus. Superimposed images are shown (merge). Bars, 10 μm.
Figure 6.
Disruption of the microtubular array by K18 aggregates. (A) Impaired function of microtubules in cells containing K18 aggregates. COS-7 cells that had been transfected with a plasmid encoding Myc-K18 were stained with antibodies to Myc (green; left) and to β-tubulin (red; middle). (B) Abnormal morphology of the nucleus of cells containing K18 aggregates. COS-7 cells containing Myc-K18 (green) aggregates were also stained with PI (red) to detect nuclei. Superimposed images are shown (merge). A cell with K18 aggregates contains two nuclei (top), whereas another cell contains fragmented nuclei (bottom). Bar, 20 μm.
Suppression of K18 Aggregate Formation by Coexpression of K8
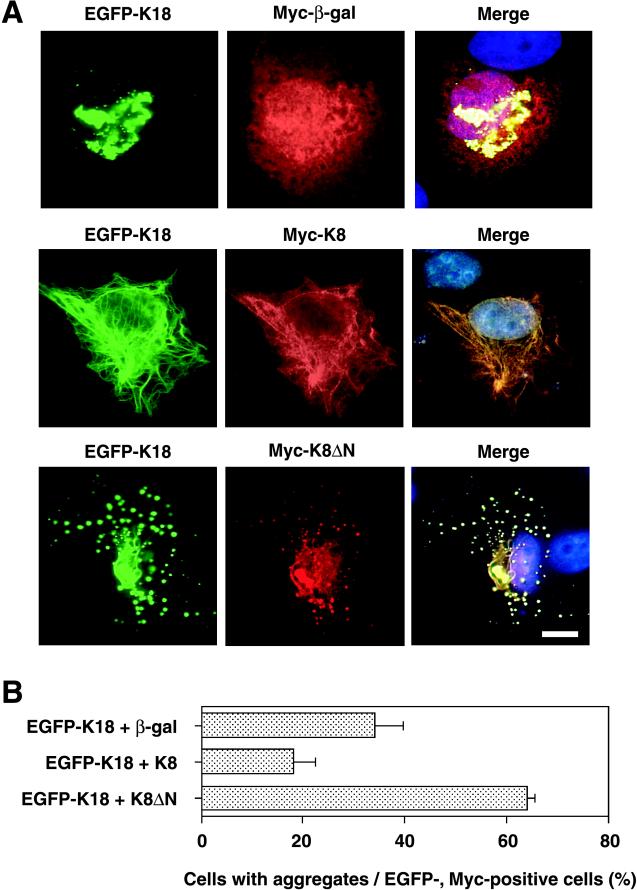
Given that K18 forms a heterodimer with K8, we investigated whether an imbalance in the K8/K18 ratio might result in aggregation of K18 fibers. The effect of K8 on K18 aggregation was evaluated by immunofluorescence microscopy in HepG2 cells that had been transfected with expression vectors encoding EGFP-K18 and Myc-K8. As a control, Myc epitope-tagged β-galactosidase was coexpressed with EGFP-K18. Coexpression of β-galactosidase did not affect the aggregation of K18 (Figure 7A). In contrast, coexpression of K8 restored the normal fibrous array of K18; the merged image of K8 and K18 immunofluorescence indicated that the expression patterns of the two proteins were almost identical, indicative of heterodimer formation. We next examined which region of the K8 protein is required for the inhibitory effect on K18 aggregation by cotransfection of HepG2 cells with vectors encoding Myc epitope-tagged K8 mutants that lack either NH2-terminal or COOH-terminal portions of the protein (designated K8ΔN and K8ΔC, respectively). Coexpression of K8ΔN with K18 resulted in the formation of many scattered aggregates, a large proportion of which was localized to the perinuclear region (Figure 7A). The patterns of K18 and K8ΔN expression were almost identical, suggesting that K8ΔN retains the ability to form a heterodimer with K18. Coexpression of K8ΔC exhibited no marked effect on K18 aggregation (our unpublished data). Quantitative analysis revealed that the percentage of cells with K18 aggregates was reduced by about one-half in cells expressing K8 with K18, compared with that apparent for cells expressing both β-galactosidase and K18 (Figure 7B). In contrast, coexpression of K8ΔN with K18 not only altered the pattern of aggregation but also increased the percentage of cells containing aggregates to >60%.
Figure 7.
Inhibitory effect of K8 on K18 aggregation. (A) HepG2 cells were transfected with a plasmid encoding an EGFP-K18 fusion protein together with vectors encoding either Myc epitope-tagged β-galactosidase (top), Myc-K8 (middle), or Myc-K8ΔN (bottom). Fluorescence images of EGFP-K18 (green) are shown on the left. The cells were also subjected to immunostaining with antibodies to Myc (red; middle), and the two fluorescence images were superimposed with that of Hoechst 33258 staining (blue), as shown on the right (merge). Bar, 10 μm. (B) Percentage of cells containing aggregates among the EGFP-expressing cells for the experiment shown in A. Three independent experiments to show suppression of K18 aggregate formation by K8 were performed. In each trial, 100 cells that expressed both GFP-K18 and Myc-K8 were analyzed. Data are means ± SD of values from triplicate cultures.
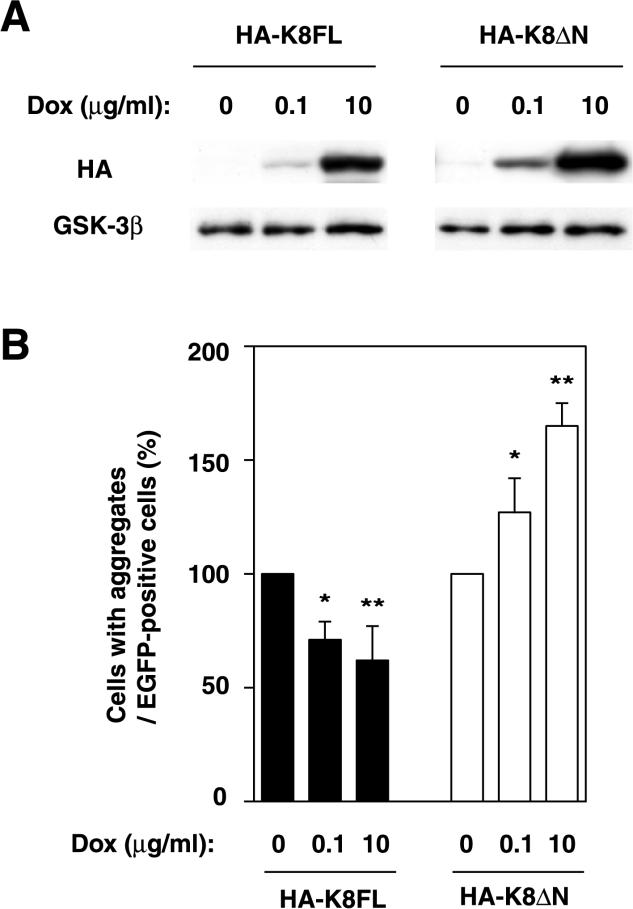
To prove that the suppressive effect of K8 on K18 aggregation is produced in a dose-dependent manner, we established a Dox-induced system in which HeLa cells express HA-K8FL (full length) or HA-K8ΔN in response to Dox. The expression of HA-K8FL and HA-K8ΔN was quantified by immunoblotting analysis and has been shown to be induced by Dox in a dose-dependent manner (Figure 8A). The suppressive and promotive effect of HA-K8FL and HA-K8ΔN, respectively, on the K18 aggregations correlated with the expression levels of the proteins induced by Dox (Figure 8B). These results suggest that K8 inhibits aggregate formation induced by K18 overexpression, probably as a result of heterodimerization with, and consequent stabilization of, the excess K18 molecules. The NH2-terminal domain of K8 seems to be required for this effect; although K8ΔN likely heterodimerizes with K18, it enhances its aggregation.
Figure 8.
Effect of K8 derivatives on K18 aggregation in a dose-dependent manner. (A) Expression of K8 derivatives in HeLa cells in response to Dox. The expression of HA-K8FL or HA-K8ΔN was induced with Dox and was quantified by immunoblotting analysis. GSK-3β levels were shown as a loading control. (B) Modification of the K18 aggregation by the induced K8 derivatives. The cells in which the expression of K8 derivatives had been regulated with Dox were transiently transfected with EGFP-K18. Percentage of cells containing aggregates among the EGFP-expressing cells is shown. Data are means ± SD; *p < 0.05, **p < 0.01.
K8ΔN-induced Formation of Intracellular Aggregates without Overexpression of K18
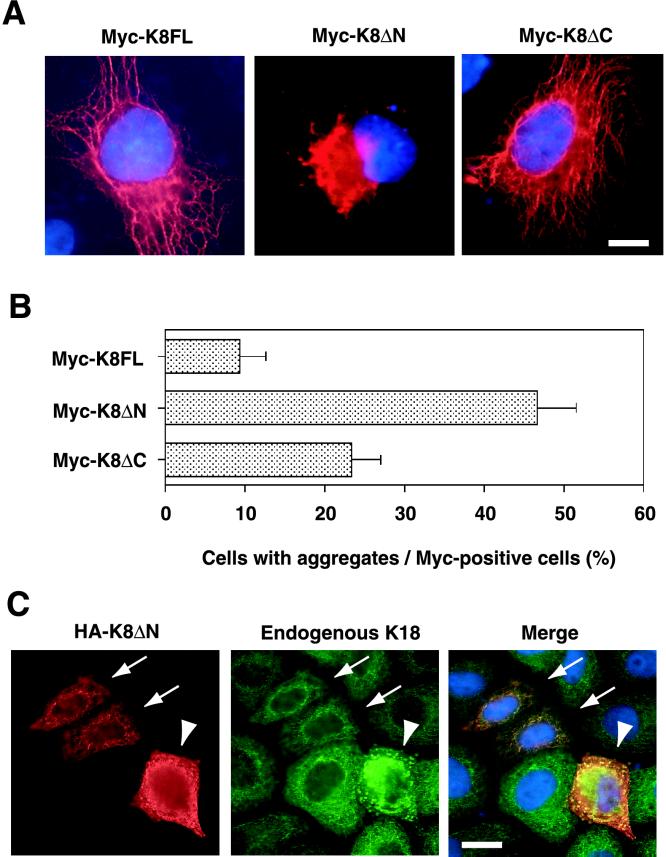
It remained possible that the observed aggregate formation might be a consequence of an increase in K18 expression to nonphysiological levels and therefore irrelevant to the mechanism of MB formation in vivo. To exclude this possibility, we used K8ΔN as a dominant negative molecule for endogenous K8, on the basis of the observation that K8ΔN colocalized with recombinant K18 and enhanced aggregate formation. Myc-tagged full-length K8 (K8FL) or mutant K8 (K8ΔN or K8ΔC) was expressed in HepG2 and HeLa cells, and the expression pattern of the recombinant proteins was examined by immunostaining with antibodies to Myc. Whereas K8FL and K8ΔC each exhibited a normal fibrous pattern in most cells, expression of K8ΔN resulted in the formation of large perinuclear aggregates that distorted the nucleus in ∼50% of cells (Figure 9, A and B). Although quantitative analysis revealed that K8ΔC also promoted aggregate formation, this effect was much less pronounced than that of K8ΔN. Expression of K8ΔN at a high level also induced marked perinuclear aggregation of endogenous K18, whereas expression of the mutant at a low level did not affect the normal fibrous array of the endogenous K18 (Figure 9C). These data suggest that K8ΔN heterodimerizes with endogenous K18, resulting in the formation of insoluble aggregates. Thus, aggregate formation is not necessarily dependent on the abundance of K18. Rather, the ratio of K8/K18 seems to be the important determinant of the formation of MB-like inclusions.
Figure 9.
Induction of the aggregation of endogenous K18 by mutant K8. (A) Aggregation induced by expression of K8ΔN. HepG2 cells were transfected with plasmids encoding Myc epitope-tagged full-length K8 (K8FL; left), K8ΔN (middle), or K8ΔC (right). The cells were then subjected to staining with antibodies to Myc (red) and Hoechst 33258 (blue). Bar, 10 μm. (B) Quantitative analysis of aggregate formation in cells expressing K8FL, K8ΔN, or K8ΔC. The percentage of cells containing aggregates among those expressing the recombinant K8 proteins was determined for the experiment shown in A. Data are means ± SD of values from triplicate cultures. (C) Induction of aggregation of endogenous K18 by expression of K8ΔN. HeLa cells were transfected with a plasmid encoding HA-tagged K8ΔN. The cells were then subjected to double staining with antibodies to HA (red; left) and to K18 (green; middle). Expression of K8ΔN at high levels (arrowheads) induced marked perinuclear aggregation of endogenous K18, whereas low levels of K8ΔN expression (arrows) did not affect the fibrous array of the endogenous protein. The superimposed images (merge) on the right, also showing Hoechst 33258 staining (blue), reveal that HA-K8ΔN colocalized with endogenous K18. Bar, 20 μm.
DISCUSSION
We have shown that deregulated expression of K18 or an imbalance in the K8/K18 ratio may play an important role in MB formation. Given that coexpression of K8 with K18 restored the normal pattern of K18 distribution, K8 may regulate the arrangement of keratin dimers. Our data suggest that overexpression of K18 is toxic for cells because of the tendency of this protein to aggregate and that K8 suppresses this tendency. Indeed, mice lacking K8 in certain genetic backgrounds manifest severe liver damage (Zatloukal et al., 2000). The NH2-terminal portion of K8 seems to be essential for the ability of this protein to inhibit K18 aggregation.
Our cellular model of MB formation seems to recapitulate the characteristics of MBs formed in vivo. The inclusion bodies formed in the cultured cells were thus induced by griseofulvin, they were stained by rhodamine B, they reacted with antibodies to ubiquitin, they contained K18, and they were localized adjacent to the nucleus. Griseofulvin induces MB formation and the expression of K18 in the hepatocytes of mice. Our data are consistent with these in vivo observations and also suggest that the effect of griseofulvin is hepatocyte autonomous. However, our cellular model of MB formation seems inconsistent with certain characteristics of genetically engineered mice. First, no pathological consequences were observed in transgenic mice expressing K18 (Abe and Oshima, 1990; Ku et al., 1995). In general, the expression of a transgene does not necessarily achieve levels required for an associated phenotype and often varies from line to line, because it is affected by the promoter, copy number, and position of the integrated transgene. It is thus possible that the expression level of the K18 transgene was not sufficient to induce the formation of MBs, with the increase in K18 abundance possibly being small enough to be neutralized by endogenous K8. Second, our data indicate that cultured cells are tolerant to the overexpression of intact K8, which is also associated with a change in the K8/K18 ratio. However, K18-deficient mice develop a distinctive liver pathology with abnormal hepatocytes containing K8-positive aggregates (Magin et al., 1998). In such mice, it is impossible for K8 to form dimers with K18, which results in the aggregation of K8. This discrepancy between the cellular and animal models might be explained if the endogenous pool of K18 in the K8-overexpressing cultured cells is sufficiently plentiful to compensate for the increase in K8.
Unexpectedly, griseofulvin treatment increased both levels of K18 and K8 mRNA. However, the ratio of K18/K8 mRNA was increased, suggesting that the imbalance of the mRNA ratio (excess of K18 mRNA over K8 mRNA) may lead to the aggregate formation. The immunoblotting analysis for K18 and K8 proteins did not detect significant differences in the protein levels with or without griseofulvin treatment (our unpublished data), which is consistent with immunofluorescence study showing that only 7% cells display high expression of K18 (Figure 1B). The results of Northern blotting analysis reflect an average of mRNA abundance in numerous cells, and we speculate that there may be variation in the increase of K18 and/or K8 mRNA in response to griseofulvin. In a small population of cells, K18 mRNA might accumulate in the cells beyond a certain threshold, resulting in the increase of K18 protein. It is likely that the increase of the protein level in such a small population (probably ∼7%) is not sufficient for the detection by immunoblotting analysis.
An imbalance in the heterodimeric components of IFs is also implicated in the formation of other inclusion bodies that share morphological and physicochemical features with MBs. In individuals with ALS, inclusion bodies (spheroid bodies) containing neuronal IFs are a common feature of degenerating motor neurons (Corbo and Hays, 1992). Neurofilaments (NFs) are composed of three neuron-specific proteins: NF-L, NF-M, and NF-H (for light, medium, and heavy, respectively). They are formed from heterodimers of NF-L and NF-M or of NF-L and NF-H (Ching and Liem, 1993; Lee et al., 1993). Furthermore, the abundance of NF-L mRNA is decreased in motor neurons of ALS patients (Bergeron et al., 1994). Transgenic mice expressing human NF-H, which are studied as a model of ALS, develop abnormal accumulations of NFs in spinal motor neurons and manifest motor dysfunction with increasing age (Cote et al., 1993). Expression of a human NF-L transgene in the NF-H transgenic mice rescued the animals from motor neuropathy (Meier et al., 1999). These observations thus seem consistent with those made with our model, suggesting that the ratio of the two heterodimeric components of keratin is a critical determinant of MB formation.
The importance of various post-translational modifications of keratins, including phosphorylation, glycosylation, acetylation, lipidation, transglutamination, and proteolysis, for the solubility and the performance of keratins has recently been outlined in Omary et al. (1998). Given that keratins are phosphorylated in the physiological conditions, we evaluated the phosphorylation status in the presence of griseofulvin by two-dimensional gel electrophoresis for endogenous K18 and K8. There were no significant changes in the pattern accompanied with griseofulvin treatment (our unpublished data). Another post-translational modification of keratins is ubiquitination (Ku and Omary, 2000). Ubiquitin is a component of MBs as well as of neurofibrillary tangles in Alzheimer's disease and of other cytoplasmic protein aggregates such as Lewy bodies in Parkinson's disease, Rosenthal fibers in astrocytomas, and spheroid bodies in ALS (Lowe et al., 1988, 1993; Ohta et al., 1988). Ubiquitin targets proteins for proteasomal degradation (Hershko and Ciechanover, 1998), and evidence suggests that an altered function of the ubiquitin–proteasome system contributes both to the mechanism of aggregate formation in and to the pathogenesis of these various disorders (Kitada et al., 1998; Leroy et al., 1998; Cummings et al., 1999; Saigoh et al., 1999; Fernandez-Funez et al., 2000; Shimura et al., 2000). In the present study, keratin aggregates reacted with antibodies to ubiquitin, as do MBs in vivo, suggesting that the ubiquitin system is important in MB formation. Consistent with this notion, keratin turnover mediated by ubiquitination has recently been demonstrated (Ku and Omary, 2000).
The cytoskeleton is required for the efficient and polarized transport of vesicles in intracellular membrane-sorting pathways. Organelles and vesicular transport intermediates are localized in association with the polarized array of microtubules, and such a distribution of organelles is thought to promote their transport by cytoskeletal motors (Hirokawa, 1998; Kamal and Goldstein, 2000). In nonpolarized cells, the minus ends of microtubules are located at the cell center near the centrosomes, whereas the plus ends extend radially to the cell periphery. Disruption of this radial arrangement of microtubules impairs the transport and sorting of proteins and lipids to their appropriate destinations. Moreover, the loss of such trafficking may result in severe cellular dysfunction or death.
The formation of cytoplasmic inclusion bodies in mammalian cells is thought to require active, retrograde transport of misfolded proteins by microtubules (Johnston et al., 1998; Garcia-Mata et al., 1999; Kopito, 2000). Furthermore, proteasome-mediated proteolysis is thought to be associated with centrosomes (Anton et al., 1999; Wigley et al., 1999; Fabunmi et al., 2000). We have now shown that keratin aggregates in our cultured cell model are associated with centrosomes and that they disrupt the normal array of microtubules. It is thus possible that keratin aggregates are recruited to the centrosomes but that aggregation beyond a certain level may result in the formation of inclusion bodies and inhibit centrosome-microtubule functions. As the microtubule organizing center of the cell, centrosomes have been implicated in many microtubule-dependent activities. During mitosis, centrosome duplication is thought to be necessary to ensure bipolarity of the mitotic spindle. Moreover, proteins associated with centrosomes, such as the Polo kinase (Nigg, 1998), are thought to participate in cytokinesis. Cells expressing large amounts of a protein containing a long polyglutamine tract, which increases the tendency to aggregate, have been shown to possess a DNA content of 4N, likely as a result of a defect in mitosis (Bence et al., 2001). In our study, cells containing inclusion bodies also exhibited disarranged microtubules and multiple nuclei. Such inclusion bodies thus likely disrupt centrosome-associated functions, including mitosis, cytokinesis, and microtubule-based transport, and thereby ultimately induce cell death.
ACKNOWLEDGMENTS
We thank M. Nakamuta for HepG2 cells; M. Sasaki and N. Kinoshita for electron microscopy; Y.A. Minamishima, N. Nishimura, R. Yasukochi, and other laboratory members for technical assistance; and M. Kimura and C. Sugita for help in preparation of the manuscript. This work was supported in part by a grant from the Ministry of Education, Science, Sports, and Culture of Japan, by Nissan Science Foundation, and by a research grant from the Human Frontier Science Program.
Footnotes
Article published online ahead of print. Mol. Biol. Cell 10.1091/mbc.01–10–0510. Article and publication date are at www.molbiolcell.org/cgi/doi/10.1091/mbc.01–10–0510.
REFERENCES
- Abe M, Oshima RG. A single human keratin 18 gene is expressed in diverse epithelial cells of transgenic mice. J Cell Biol. 1990;111:1197–1206. doi: 10.1083/jcb.111.3.1197. [DOI] [PMC free article] [PubMed] [Google Scholar]
- Anton LC, et al. Intracellular localization of proteasomal degradation of a viral antigen. J Cell Biol. 1999;146:113–124. doi: 10.1083/jcb.146.1.113. [DOI] [PMC free article] [PubMed] [Google Scholar]
- Baribault H, Penner J, Iozzo RV, Wilson-Heiner M. Colorectal hyperplasia and inflammation in keratin 8-deficient FVB/N mice. Genes Dev. 1994;8:2964–2973. doi: 10.1101/gad.8.24.2964. [DOI] [PubMed] [Google Scholar]
- Baribault H, Price J, Miyai K, Oshima RG. Mid-gestational lethality in mice lacking keratin 8. Genes Dev. 1993;7:1191–1202. doi: 10.1101/gad.7.7a.1191. [DOI] [PubMed] [Google Scholar]
- Bence NF, Sampat RM, Kopito RR. Impairment of the ubiquitin-proteasome system by protein aggregation. Science. 2001;292:1552–1555. doi: 10.1126/science.292.5521.1552. [DOI] [PubMed] [Google Scholar]
- Bergeron C, Beric-Maskarel K, Muntasser S, Weyer L, Somerville MJ, Percy ME. Neurofilament light and polyadenylated mRNA levels are decreased in amyotrophic lateral sclerosis motor neurons. J Neuropathol Exp Neurol. 1994;53:221–230. doi: 10.1097/00005072-199405000-00002. [DOI] [PubMed] [Google Scholar]
- Cadrin M, Hovington H, Marceau N, McFarlane-Anderson N. Early perturbations in keratin, and actin gene expression, and fibrillar organization in griseofulvin-fed mouse liver. J Hepatol. 2000;33:199–207. doi: 10.1016/s0168-8278(00)80360-8. [DOI] [PubMed] [Google Scholar]
- Casanova ML, Bravo A, Ramirez A, Morreale de Escobar G, Were F, Merlino G, Vidal M, Jorcano JL. Exocrine pancreatic disorders in transsgenic mice expressing human keratin 8. J Clin Investig. 1999;103:1587–1595. doi: 10.1172/JCI5343. [DOI] [PMC free article] [PubMed] [Google Scholar]
- Ching GY, Liem RK. Assembly of type IV neuronal intermediate filaments in nonneuronal cells in the absence of preexisting cytoplasmic intermediate filaments. J Cell Biol. 1993;122:1323–1335. doi: 10.1083/jcb.122.6.1323. [DOI] [PMC free article] [PubMed] [Google Scholar]
- Corbo M, Hays AP. Peripherin and neurofilament protein coexist in spinal spheroids of motor neuron disease. J Neuropathol Exp Neurol. 1992;51:531–537. doi: 10.1097/00005072-199209000-00008. [DOI] [PubMed] [Google Scholar]
- Cote F, Collard JF, Julien JP. Progressive neuronopathy in transgenic mice expressing the human neurofilament heavy gene: a mouse model of amyotrophic lateral sclerosis. Cell. 1993;73:35–46. doi: 10.1016/0092-8674(93)90158-m. [DOI] [PubMed] [Google Scholar]
- Cummings CJ, Reinstein E, Sun Y, Antalffy B, Jiang Y, Ciechanover A, Orr HT, Beaudet AL, Zoghbi HY. Mutation of the E6-AP ubiquitin ligase reduces nuclear inclusion frequency while accelerating polyglutamine-induced pathology in SCA1 mice. Neuron. 1999;24:879–892. doi: 10.1016/s0896-6273(00)81035-1. [DOI] [PubMed] [Google Scholar]
- Fabunmi RP, Wigley WC, Thomas PJ, DeMartino GN. Activity, and regulation of the centrosome-associated proteasome. J Biol Chem. 2000;275:409–413. doi: 10.1074/jbc.275.1.409. [DOI] [PubMed] [Google Scholar]
- Fernandez-Funez, et al. Identification of genes that modify ataxin-1-induced neurodegeneration. Nature. 2000;408:101–106. doi: 10.1038/35040584. [DOI] [PubMed] [Google Scholar]
- Franke WW, Denk H, Schmid E, Osborn M, Weber K. Ultrastructural, biochemical, and immunologic characterization of Mallory bodies in livers of griseofulvin-treated mice. Fimbriated rods of filaments containing prekeratin-like polypeptides. Lab Invest. 1979;40:207–220. [PubMed] [Google Scholar]
- Fuchs E, Cleveland DW. A structural scaffolding of intermediate filaments in health and disease. Science. 1998;279:514–519. doi: 10.1126/science.279.5350.514. [DOI] [PubMed] [Google Scholar]
- Fuchs E, Weber K. Intermediate filaments, structure, dynamics, function, and disease. Annu Rev Biochem. 1994;63:345–382. doi: 10.1146/annurev.bi.63.070194.002021. [DOI] [PubMed] [Google Scholar]
- Garcia-Mata R, Bebok Z, Sorscher EJ, Sztul ES. Characterization and dynamics of aggresome formation by a cytosolic GFP-chimera. J Cell Biol. 1999;146:1239–1254. doi: 10.1083/jcb.146.6.1239. [DOI] [PMC free article] [PubMed] [Google Scholar]
- Hatakeyama S, Jensen JP, Weissman AM. Subcellular localization and ubiquitin-conjugating enzyme (E2) interactions of mammalian HECT family ubiquitin protein ligases. J Biol Chem. 1997;272:15085–15092. doi: 10.1074/jbc.272.24.15085. [DOI] [PubMed] [Google Scholar]
- Hazan R, Denk H, Franke WW, Lackinger E, Schiller DL. Change of cytokeratin organization during development of Mallory bodies as revealed by a monoclonal antibody. Lab Invest. 1986;54:543–553. [PubMed] [Google Scholar]
- Hershko A, Ciechanover A. The ubiquitin system. Annu Rev Biochem. 1998;67:425–479. doi: 10.1146/annurev.biochem.67.1.425. [DOI] [PubMed] [Google Scholar]
- Hirokawa N. Kinesin and dynein superfamily proteins and the mechanism of organelle transport. Science. 1998;279:519–526. doi: 10.1126/science.279.5350.519. [DOI] [PubMed] [Google Scholar]
- Johnston JA, Ward CL, Kopito RR. Aggresomes: a cellular response to misfolded proteins. J Cell Biol. 1998;143:1883–1898. doi: 10.1083/jcb.143.7.1883. [DOI] [PMC free article] [PubMed] [Google Scholar]
- Kamal A, Goldstein LS. Connecting vesicle transport to the cytoskeleton. Curr Opin Cell Biol. 2000;12:503–508. doi: 10.1016/s0955-0674(00)00123-x. [DOI] [PubMed] [Google Scholar]
- Kitada T, Asakawa S, Hattori N, Matsumine H, Yamamura Y, Minoshima S, Yokochi M, Mizuno Y, Shimizu N. Mutations in the parkin gene cause autosomal recessive juvenile parkinsonism. Nature. 1998;392:605–608. doi: 10.1038/33416. [DOI] [PubMed] [Google Scholar]
- Kopito RR. Aggresomes, inclusion bodies, and protein aggregation. Trends Cell Biol. 2000;10:524–530. doi: 10.1016/s0962-8924(00)01852-3. [DOI] [PubMed] [Google Scholar]
- Ku NO, Michie S, Oshima RG, Omary MB. Chronic hepatitis: hepatocyte fragility, and increased soluble phosphoglycokeratins in transgenic mice expressing a keratin18 conserved arginine mutant. J Cell Biol. 1995;131:1303–1314. doi: 10.1083/jcb.131.5.1303. [DOI] [PMC free article] [PubMed] [Google Scholar]
- Ku NO, Omary MB. Keratins turn over by ubiquitination in a phosphorylation-modulated fashion. J Cell Biol. 2000;149:547–552. doi: 10.1083/jcb.149.3.547. [DOI] [PMC free article] [PubMed] [Google Scholar]
- Lee MK, Xu Z, Wong PC, Cleveland DW. Neurofilaments are obligate heteropolymers in vivo. J Cell Biol. 1993;122:1337–1350. doi: 10.1083/jcb.122.6.1337. [DOI] [PMC free article] [PubMed] [Google Scholar]
- Leroy E, et al. The ubiquitin pathway in Parkinson's disease. Nature. 1998;395:451–452. doi: 10.1038/26652. [DOI] [PubMed] [Google Scholar]
- Lowe J, Blanchard A, Morrell K, Lennox G, Reynolds L, Billett M, Landon M, Mayer RJ. Ubiquitin is a common factor in intermediate filament inclusion bodies of diverse type in man, including those of Parkinson's disease, Pick's disease, and Alzheimer's disease, as well as Rosenthal fibers in cerebellar astrocytomas, cytoplasmic bodies in muscle, and mallory bodies in alcoholic liver disease. J Pathol. 1988;155:9–15. doi: 10.1002/path.1711550105. [DOI] [PubMed] [Google Scholar]
- Lowe J, Mayer RJ, Landon M. Ubiquitin in neurodegenerative diseases. Brain Pathol. 1993;3:55–65. doi: 10.1111/j.1750-3639.1993.tb00726.x. [DOI] [PubMed] [Google Scholar]
- Magin TM, Schroder R, Leitgeb S, Wanninger F, Zatloukal K, Grund C, Melton DW. Lessons from keratin 18 knockout mice: formation of novel keratin filaments, secondary loss of keratin7 and accumulation of liver-specific keratin 8-positive aggregates. J Cell Biol. 1998;140:1441–1451. doi: 10.1083/jcb.140.6.1441. [DOI] [PMC free article] [PubMed] [Google Scholar]
- Meier J, Couillard-Despres S, Jacomy H, Gravel C, Julien JP. Extra neurofilament NF-L subunits rescue motor neuron disease caused by overexpression of the human NF-H gene in mice. J Neuropathol Exp Neurol. 1999;58:1099–1110. [PubMed] [Google Scholar]
- Moll R, Franke WW, Schiller DL, Geiger B, Krepler R. The catalog of human cytokeratins: patterns of expression in normal epithelia, tumors and cultured cells. Cell. 1982;31:11–24. doi: 10.1016/0092-8674(82)90400-7. [DOI] [PubMed] [Google Scholar]
- Nigg EA. Polo-like kinases: positive regulators of cell division from start to finish. Curr Opin Cell Biol. 1998;10:776–783. doi: 10.1016/s0955-0674(98)80121-x. [DOI] [PubMed] [Google Scholar]
- Ohta M, Marceau N, Perry G, Manetto V, Gambetti P, Autilio-Gambetti L, Metuzals J, Kawahara H, Cadrin M, French SW. Ubiquitin is present on the cytokeratin intermediate filaments and Mallory bodies of hepatocytes. Lab Invest. 1988;59:848–856. [PubMed] [Google Scholar]
- Omary MB, Ku NO, Liao J, Price N. Keratin modifications and solubility properties in epithelial cells and in vitro. Subcellular Biochem. 1998;31:105–140. [PubMed] [Google Scholar]
- Saigoh K, et al. Intragenic deletion in the gene encoding ubiquitin carboxy-terminal hydrolase in gad mice. Nat Genet. 1999;23:47–51. doi: 10.1038/12647. [DOI] [PubMed] [Google Scholar]
- Shimura H, et al. Familial Parkinson disease gene product, parkin, is a ubiquitin-protein ligase. Nat Genet. 2000;25:302–305. doi: 10.1038/77060. [DOI] [PubMed] [Google Scholar]
- Steinert PM, Roop DR. Molecular and cellular biology of intermediate filaments. Annu Rev Biochem. 1988;57:593–625. doi: 10.1146/annurev.bi.57.070188.003113. [DOI] [PubMed] [Google Scholar]
- Wessely Z, Shapiro SH, Klavins JV, Tinberg HM. Identification of Mallory bodies with rhodamine B fluorescence and other stains for keratin. Stain Technol. 1981;56:169–176. doi: 10.3109/10520298109067305. [DOI] [PubMed] [Google Scholar]
- Wigler M, Silverstein S, Lee LS, Pellicer A, Cheng Y, Axel R. Transfer of purified herpes virus thymidine kinase gene to cultured mouse cells. Cell. 1977;11:223–232. doi: 10.1016/0092-8674(77)90333-6. [DOI] [PubMed] [Google Scholar]
- Wigley WC, Fabunmi RP, Lee MG, Marino CR, Muallem S, DeMartino GN, Thomas PJ. Dynamic association of proteasomal machinery with the centrosome. J Cell Biol. 1999;145:481–490. doi: 10.1083/jcb.145.3.481. [DOI] [PMC free article] [PubMed] [Google Scholar]
- Zatloukal K, Stumptner C, Lehner M, Denk H, Baribault H, Eshkind LG, Franke WW. Cytokeratin 8 protects from hepatotoxicity, and its ratio to cytokeratin 18 determines the ability of hepatocytes to form Mallory bodies. Am J Pathol. 2000;156:1263–1274. doi: 10.1016/S0002-9440(10)64997-8. [DOI] [PMC free article] [PubMed] [Google Scholar]


