Abstract
Background
The objective of this research was to investigate the reproducibility of cross-species microarray hybridisation. Comparisons between same- and cross-species hybridisations were also made. Nine hybridisations between a single pig skeletal muscle RNA sample and three human cDNA nylon microarrays were completed. Three replicate hybridisations of two different amounts of pig RNA, and of human skeletal muscle RNA were completed on three additional microarrays.
Results
Reproducibility of microarray hybridisations of pig cDNA to human microarrays was high, as determined by Spearman and Pearson correlation coefficients and a Kappa statistic. Variability among replicate hybridisations was similar for human and pig data, indicating the reproducibility of results were not compromised in cross-species hybridisations. The concordance between data generated from hybridisations using pig and human skeletal muscle RNA was high, further supporting the use of human microarrays for the analysis of gene expression in the pig. No systematic effect of stripping and re-using nylon microarrays was found, and variability across microarrays was minimal.
Conclusion
The majority of genes generated highly reproducible data in cross-species microarray hybridisations, although approximately 6% were identified as highly variable. Experimental designs that include at least three replicate hybridisations for each experimental treatment will enable the variability of individual genes to be considered appropriately. The use of cross-species microarray analysis looks promising. However, additional validation is needed to determine the specificity of cross-species hybridisations, and the validity of results.
Background
One approach for identifying novel genes associated with physiological pathways is to identify genes whose expression changes with differences in experimental treatment or phenotype. This approach has been implemented using several different techniques, including the use of cDNA microarrays to quantitate and evaluate the expression of thousands of genes simultaneously [1]. Various types of microarrays have been utilized to study a wide range of biological models (for example, [2-4]. To date, examples of experiments using microarrays to evaluate changes in gene expression in mammalian species other than humans and rodent species are lacking, primarily due to the limited availability of arrays. Although resources are being developed that will facilitate production of microarrays for livestock species [5,6], the resulting microarrays may not meet the needs of all researchers. One alternative to developing species-specific microarrays may be to utilize commercially available human or rodent microarrays in cross-species hybridisations. This approach would allow microarrays that are currently commercially available to be utilized to study additional mammalian species. A variety of human microarray systems are commercially available and represent well over 30,000 gene and EST sequences. In addition, cross-species hybridisation would allow a common set of genes to be evaluated in experimental models developed from multiple species, further utilizing the power of comparative genomics.
Important criteria for evaluating any microarray system include the reproducibility of the data generated, the specificity of detection of the targeted gene, and the validity of the results that identify differences in gene expression. The experiments described herein are a first step toward the systematic validation of cross-species microarray analysis, with a focus on the reproducibility of the data generated. The methods described to analyze reproducibility in these experiments may be used to evaluate the reproducibility of any microarray platform. Secondary objectives of these experiments were to compare gene expression profiles from cross-species and same-species hybridisations, and to evaluate the variability among nylon micorarrays from a commercial source.
Results
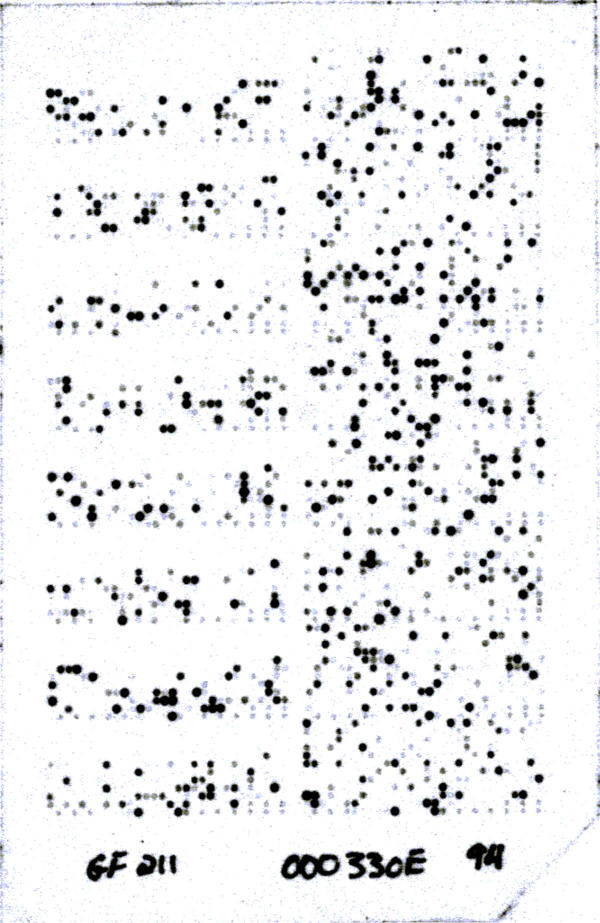
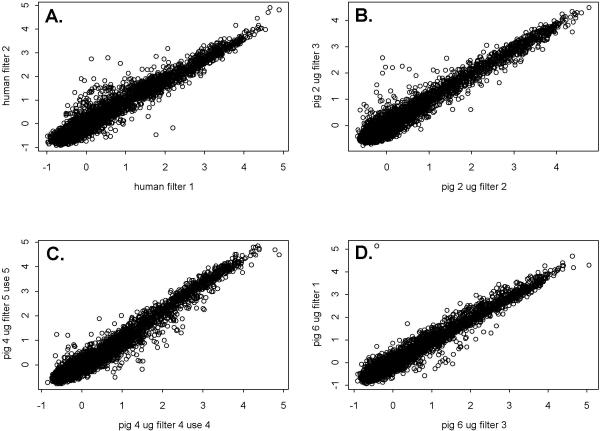
An overview of the experimental design is presented in Table 1, and an example of a microarray image generated by hybridisation of pig skeletal muscle RNA to a human cDNA nylon microarray is shown in Figure 1. The complete dataset is provided as an additional file, see Additional file 1: [data.xls]. Table 2 presents summary statistics for the raw data from each hybridisation. Our primary objective was to investigate the reproducibility of replicated cross-species hybridisations. The distributions of all data were significantly different from normal because of a large number of genes with low hybridisation signals and few genes with high signals. Approximately 48% of genes from pig and human hybridisations, were considered undetectable. Because of this, two correlation coefficients and a Kappa statistic [7], each with different assumptions regarding the distribution of the data set, were calculated (Table 3). Average values of the Pearson and Spearman correlation coefficients for the mean normalized data ranged from 0.96 to 0.97 for both human and pig data. Weighted Kappa values ranged from 0.80 to 0.86 for pig data, and were 0.86 for human data. These statistics indicate reproducibility was high for both pig and human hybridisations. High reproducibility is also evident when comparing the distribution of data from one replicate to another (Figure 2A,2B,2C,2D).
Table 1.
Overview of experimental design
| Filter: | 1 | 2 | 3 | 4 | 5 | 6 |
| 3rd Use | Human, 4 | Pig, 2 | Pig, 6 | Pig, 4 | Pig, 4 | Pig, 4 |
| 4th Use | Pig, 6 | Human, 4 | Pig, 2 | Pig, 4 | Pig, 4 | Pig, 4 |
| 5th Use | Pig, 2 | Pig, 6 | Human, 4 | Pig, 4 | Pig, 4 | Pig, 4 |
A total of 18 hybridizations were done on six nylon cDNA microarray filters (GF211; ResGen). Each filter was stripped and reused a total of five times, and these data are from the third, fourth and fifth use of each filter. Three replicates each of 4 μg human skeletal muscle RNA, and 2 and 6 μg of pig skeletal muscle RNA were hybridized to filters 1 through 3. A total of nine replicates of 4 μg of pig skeletal muscle RNA was hybridized to filters 4 through 6. Each entry shows the species and amount (μg) of total RNA used in the hybridization.
Figure 1.
Microarray image generated from the hybridisation of pig skeletal muscle total RNA to the GF211 human nylon cDNA microarray (ResGen) containing 4,324 human gene and EST sequences.
Table 2.
Summary statistics for each hybridization
| Species | μg of RNA | Filter | Filter Use | Mean | Median | Std Dev | Lower Quartile | Upper Quartile |
| Pig | 2 | 2 | 3 | 68.35 | 15.06 | 149.84 | 11.23 | 36.66 |
| Pig | 2 | 3 | 4 | 65.12 | 15.74 | 132.57 | 11.50 | 40.69 |
| Pig | 2 | 1 | 5 | 72.72 | 16.79 | 155.46 | 13.12 | 36.82 |
| Pig | 6 | 3 | 3 | 99.38 | 21.86 | 206.13 | 14.58 | 70.68 |
| Pig | 6 | 1 | 4 | 90.25 | 21.35 | 183.37 | 14.66 | 63.30 |
| Pig | 6 | 2 | 5 | 93.00 | 21.28 | 189.28 | 15.31 | 61.85 |
| Human | 4 | 1 | 3 | 101.24 | 22.26 | 213.14 | 14.94 | 67.21 |
| Human | 4 | 2 | 4 | 74.21 | 19.40 | 147.96 | 12.59 | 60.95 |
| Human | 4 | 3 | 5 | 82.24 | 20.26 | 166.78 | 13.55 | 57.82 |
| Pig | 4 | 4 | 3 | 72.86 | 15.69 | 167.32 | 12.21 | 31.74 |
| Pig | 4 | 5 | 4 | 73.47 | 15.48 | 159.54 | 11.57 | 38.57 |
| Pig | 4 | 6 | 5 | 208.75 | 30.11 | 518.36 | 19.70 | 87.03 |
| Pig | 4 | 5 | 3 | 98.87 | 26.76 | 196.68 | 18.50 | 64.91 |
| Pig | 4 | 6 | 4 | 74.62 | 16.91 | 159.59 | 12.83 | 38.43 |
| Pig | 4 | 6 | 3 | 82.25 | 15.85 | 190.79 | 11.98 | 35.76 |
| Pig | 4 | 4 | 4 | 73.73 | 16.40 | 149.18 | 11.38 | 51.40 |
| Pig | 4 | 5 | 5 | 97.89 | 17.11 | 215.71 | 12.09 | 54.11 |
| Pig | 4 | 4 | 5 | 75.41 | 19.18 | 167.72 | 15.19 | 35.23 |
The overall mean, median, standard deviation, and quartiles across all genes are shown for each hybridization, based on the raw expression data.
Table 3.
Concordance within replicates of same- and cross-species hybridizations to a human nylon cDNA microarray
| Type of RNA | Pearsona | Spearmanb | Weighted Kappac |
| Human, 4 μg | 0.97 | 0.97 | 0.86 |
| Pig, 2 μg | 0.97 | 0.97 | 0.82 |
| Pig, 4 μg | 0.97 | 0.97 | 0.80 |
| Pig, 6 μg | 0.96 | 0.97 | 0.86 |
aPearson correlation coefficient assumes data are normally distributed. bSpearman correlation coefficient assumes data are symmetrical. cThe weighted Kappa statistic assumes data are ordinal. . Pearson and Spearman correlation coefficients were calculated from median normalized and log transformed data. All genes were categorized according to their normalized expression level (undetectable, 0; low, 0 to 1.3; medium 1.3 to 3.0; or high, >3.0) for calculation of the weighted Kappa statistic. Results are the average of the three pairwise comparisons among three hybridizations of each type of RNA.
Figure 2.
Scatterplots of data generated from two replicate hybridisations of pig or human skeletal muscle RNA to a human cDNA nylon microarray. Data are median normalized and log transformed results from two hybridisations of (A) 4 μg of human RNA, (B) 2 μg of pig RNA, (C) 4 μg of pig RNA, or (D) 6 μg of pig RNA.
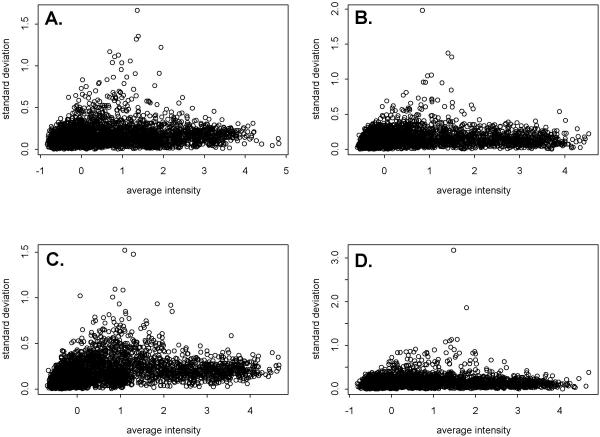
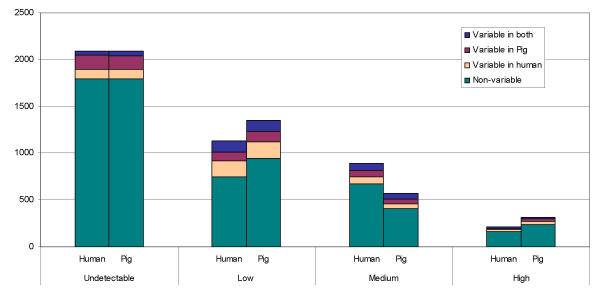
Reproducibility of the data was further evaluated by considering standard deviations for individual genes and identifying genes with the highest variability across replicates. Figure 3 shows the distribution of standard deviations versus average expression over three replicate hybridisations for human and pig (2, 4, and 6 μg) hybridisations. Highly variable genes were defined as those with a standard deviation greater than twice the standard deviation of the population of standard deviations from the human data, or greater than 0.119. A total of 603 variable genes were found in the human data, and 966, 574, and 587 variable genes were identified from hybridisations using 2, 4, or 6 μg pig RNA, respectively. When the variable genes identified from human and from pig (4 μg of RNA) data were compared, 239 genes were common to both. We consider these genes to be highly variable. An additional 335 were variable in pig but not human, while an additional 364 were variable in human but not pig. Variable genes were found among genes of all expression levels for both pig and human data (Figure 4).
Figure 3.
Scatterplots of standard deviations calculated from three replicate hybridisations of pig or human skeletal muscle RNA to a human cDNA nylon microarray. Standard deviations and means for each gene were calculated from median normalized and log transformed results from three hybridisations of (A) 4 μg of human RNA, (B) 2 μg of pig RNA, (C) 4 μg of pig RNA, or (D) 6 μg of pig RNA.
Figure 4.
Distribution of variable genes across expression categories. Genes were categorized according to their average median normalized log transformed intensity (undetectable 0; low, 0–1.3; medium, 1.3–3; or high, ≥ 3). Variable genes were identified as genes with a standard deviation greater than two times the average standard deviation of the human data. The total number of genes in each expression category, and the number of genes variable in pig, human, or both, are shown.
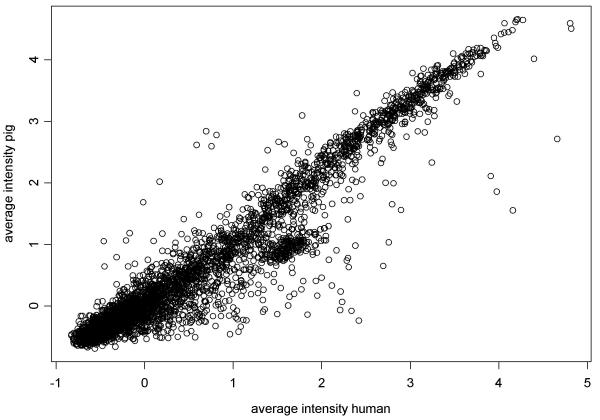
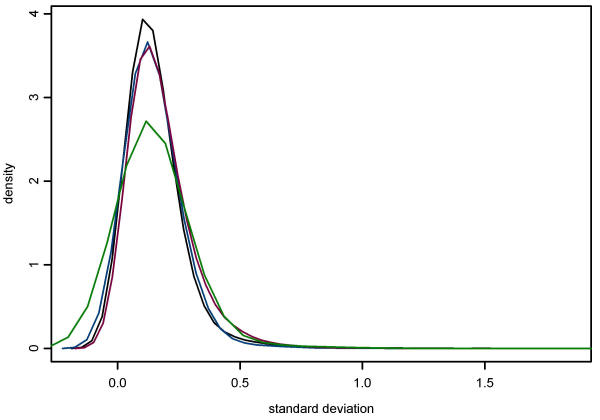
Our second objective was to compare results obtained from the hybridisation of human and pig skeletal muscle RNA to human cDNA microarrays. A comparison of the gene expression profiles from the two species, based on the average of three replicate hybridisations for each, is presented in Figure 5. Concordance among replicates was assessed using pairwise Pearson and Spearman correlation coefficients, and the Kappa statistic. Each of these statistics suggests high concordance between results obtained from human and pig (Table 4). Results of using different cutpoints to categorize data generated similar Kappa statistics, ranging from 0.72 to 0.85 (data not shown). In the examination of the discordance between human and pig results, Bowkers test for symmetry using categorized data was statistically significant (p < 0.001) indicating that, in general, stronger hybridisation signals were detected from human than from pig. Examination of the standard deviations showed no obvious differences among human and pig 2, 4, or 6 μg RNA (Figure 6). However, data from the pig using 6 μg of RNA has several large standard deviations, possibly indicating that this concentration causes more variable results.
Figure 5.
Comparison of gene expression profiles generated from hybridisations of pig and human skeletal muscle RNA with a human cDNA nylon microarray. Data shown are the average median normalized and log transformed intensity of three hybridisations of human and pig skeletal muscle RNA with the GF211 human nylon cDNA microarray (ResGen) containing 4,324 human gene and EST sequences.
Table 4.
Concordance between pig and human hybridizations to a human nylon cDNA microarray
| Comparison | Pearsona | Spearmanb | Weighted Kappac |
| Human versus 2 μg Pig | 0.93 | 0.93 | 0.76 |
| Human versus 4 μg Pig | 0.93 | 0.93 | 0.80 |
| Human versus 6 μg Pig | 0.95 | 0.95 | 0.78 |
aPearson correlation coefficient assumes data are normally distributed. bSpearman correlation coefficient assumes data are symmetrical. cThe weighted Kappa statistic assumes data are ordinal. Pearson and Spearman correlation coefficients were calculated from median normalized and log transformed data. All genes were categorized according to their normalized expression level (undetectable, 0; low, 0 to 1.3; medium 1.3 to 3.0; or high, >3.0) for calculation of the weighted Kappa statistic. Results are the average of the nine pairwise comparisons among three replicates of human and three replicates of pig (2, 4, or 6 μg) skeletal muscle RNA.
Figure 6.
Density plot of the distribution of standard deviations. Standard deviations were calculated from median normalized log transformed data of three replicates each of human, 4 μg RNA (black); pig, 2 μg (blue); pig, 4 μg (red); and pig, 6 μg (green) hybridisations.
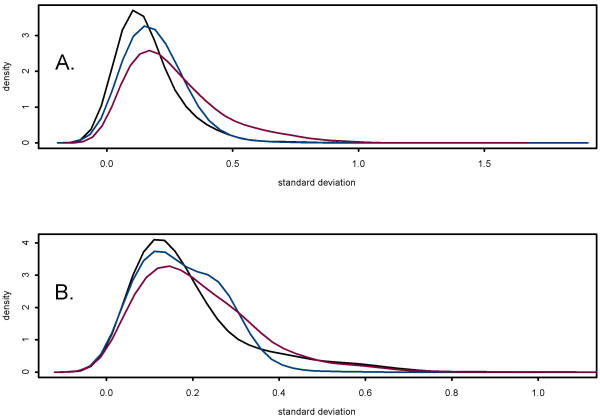
To determine if washing and rehybridizing to the same filter had a significant effect on hybridisation signals, standard deviations were calculated for the third, fourth and fifth use of the filters. These distributions are presented in Figure 7A. No trend toward increasing or decreasing expression among the third, fourth and fifth use of the filters was observed. However, the average hybridisation signals detected from the second replicate on filter 5 and the third replicate on filter 6 were significantly lower and higher, respectively, than the other seven replicates. Although these results may indicate an effect of washing and reuse of the filters, they may also represent variability in reactions to produce labeled probe. Thus, no evidence was found that would suggest washing and reusing filters up to five times systematically increases variability of hybridisation results.
Figure 7.
Density plot of the distribution of standard deviations.(A) Standard deviations were calculated from median normalized log transformed data of three replicates each from hybridisations representing the third (blue), fourth (black), and fifth (red) use of the filters. (B) Standard deviations were calculated from median normalized log transformed data of three replicates each from hybridisations using Filter 4 (black), Filter 5 (blue), and Filter 6 (red).
Additionally, variation in hybridisation signals due to the use of different filters was evaluated (Figure 7B). No evidence for significant filter effects was found, indicating that on average similar results would be obtained from different filters. To investigate variability across filters more closely, standard deviations of within and across filter average hybridisation signals were calculated. This analysis identified a small number of genes that appear to be highly variable across filters. Thus, even though the average filter effect across all genes is small, a small number of genes may produce very different hybridisation signals because of filter differences.
Discussion
Overall, cross-species hybridisations (pig to human) generated reproducible results that were consistent with results generated by same-species hybridisations (human to human) from the same tissue. Although data from replicate hybridisations were highly reproducible on average, a small number (approximately 6%) of genes were identified that produced highly variable results across both human and pig replicates. This observation is significant because it highlights the need for replication in microarray experimentation. The importance of replication in microarray gene expression studies has been addressed by Lee [8]. These authors concluded that more reliable analyses of gene expression data are obtained by pooling data from multiple replicates, and recommended that at least three replicate hybridisations be completed for each experimental treatment. In addition, as we have described, specific genes that generate highly variable data may be singled out from all genes evaluated on a microarray by identifying genes with the greatest standard deviation across replicates. Once these highly variable genes are identified, they may be considered separately in analyses to identify differential gene expression among experimental treatments. In this way, results for highly reproducible genes will not be compromised by a small number of highly variable genes, and differential gene expression observed for highly variable genes may be considered with appropriate caution.
In order to determine if low sequence similarity contributed to increased variation in the pig data, we compared human sequences on the microarray to pig EST sequences. Because similarities between the human and pig sequences may not be found due to different regions of the genes being represented by EST sequences, we obtained the tentative human consensus (THC) sequence from the TIGR Gene Index http://tigrblast.tigr.org/tgi/ that represented the human sequence on the microarray. The THC sequence was used in a BLAST search to identify similar pig EST sequences. A subset of 380 genes that were consistently expressed at high levels in both pig and human were used as controls to determine the sequence similarity of genes that generated strong and reproducible signals. Of these 380 genes, 211 (55%) were similar to pig EST sequences over at least 100 bp. Taken together, sequences of the 211 genes were 84% identical between pig and human over 32,772 bp of sequence. This identity is consistent with estimates of overall similarity between pig and human genomes. The lack of identification of a corresponding pig sequence could indicate that sequence similarity for that gene was low, or that EST sequence for that pig gene has not yet been generated. Of 31 genes that were variable in both pig and human data, 19 had hits to pig EST with overall identity of 83% across 3,658 bp. Two genes (AA456850 and AA282063) that were variable in pig but not human data had significant hits to pig EST with 92% identity over 335 bp. Additionally, specific examples of pig EST with with greater than 90% identity to the human sequence were found within each group of genes investigated (pig EST accession numbers BI183743, BI186313, and BG894921 represent non-variable, variable in both, and variable in pig, respectively). Based on this analysis, there is not a clear correlation between sequence similarity and variability. However, it is difficult to interpret cases where no pig EST is identified. A more thorough investigation of the relationship between sequence similarity and variability of the microarray data will depend on more complete sequence information from the pig.
Our results also demonstrate minimal variation across microarrays, as well as minimal effect of stripping and re-using the GF211 nylon microarray (ResGen). However, it should be recognized that microarrays from only a single source were evaluated. Similar experiments would be needed before the results pertaining to variation across arrays and across multiple array uses could be extended to microarrays produced by other manufacturers or in-house facilities.
These experiments represent a first step toward systematic validation of cross-species microarray hybridisation. However, it should be recognized that other factors, such as specificity of the arrays to detect the targeted gene, validity of results identifying differential gene expression, and multiple sources of variation, should be considered for any microarray platform. The issue of cross-hybridisation of related genes on cDNA microarrays was addressed by Miller [9]. These authors used high-stringency conditions and found that minimal cross-hybridisation occurred among genes with up to 94% sequence identity. Although this work demonstrates that microarray hybridisation can be very specific, the high stringencies would likely prevent cross-species hybridisation. A balance that allows cross-species hybridisation while minimizing cross-hybridisation of related genes will be needed in order to obtain optimal results from cross-species microarray experiments. A limited number of studies have validated differences in gene expression found by cross-species microarray experiments [10-12]. Huang [11] successfully validated differential expression of 15 genes identified by cross-species (mouse on human microarray) hybridisation using reduced stringency. Clearly, validation of results will be even more critical in cross-species microarray experiments because of questions surrounding cross-hybridisation of related genes under conditions of reduced stringency. A final consideration for microarray experimentation is the potential for multiple sources of variation. In our experiment, all hybridisations were done using single pig or human RNA samples. Thus, variation among replicates represents technical variation, including variation in labeling of cDNA and minor variations in hybridisation and washing conditions. Experiments to investigate differential gene expression will also include biological variation among subjects receiving the same treatment (see [13]), and experimental variation caused by the treatments of interest. In our experiment, we chose to only consider technical variation because our primary objective was to evaluate the reproducibility of the data with as little confounding variation as possible.
In summary, our results demonstrate that cross-species microarray data are reproducible. Although other factors need to be investigated to validate the use of cross-species microarray experimentation, our results indicate reproducibility of the data should not be a limitation in cross-species microarray experiments.
Conclusions
Gene expression data generated across replicate hybridisations was highly reproducible for the majority of genes on the microarrays. However, the identification of a small number of genes with variable results emphasizes the need for replication in microarray experiments. A minimum of three replicates of each experimental treatment would facilitate the identification of these highly variable genes. Variability among replicate hybridisations was similar for human and pig, indicating cross-species hybridisation results are expected to be as reliable as same-species hybridisations. Similar expression profiles were generated from hybridisations of human and pig skeletal muscle RNA with human cDNA microarrays. Together, these results support the use of commercially available human microarrays for cross-species analysis of gene expression in the pig.
Methods
Microarray hybridisations
Pig skeletal muscle RNA was obtained from a longissimus dorsi muscle sample. All pig RNA was generated from a single extraction using Trizol reagent (Life Technologies) according to manufacturers' instructions. A single sample of human skeletal muscle RNA was purchased (Clontech). Total RNA was reverse transcribed and labelled with 33P-dCTP in a 20 μl reaction. Initially, 2, 4, or 6 ug of RNA was combined with 2 ug of oligo dT (ResGen) and denatured at 70°C for 10 minutes. The final reaction included 1X First Strand Buffer (Life Technologies), 5 mM DTT (Life Technologies), 1.5 mM dATP, dGTP and dTTP, 1.5 μl Superscript II Reverse Transcriptase (Life Technologies), and 10 μl of 33P-dCTP (ICN, specific activity 3,000 Ci/mmol). The reaction incubated at 37°C for 90 minutes, and the labelled probe was purified using a Bio-Spin 6 Chromatography Column (Bio-Rad).
The GF 211 Human GeneFilters (ResGen) nylon microarrays, containing approximately 4324 human genes of known function were used. Microarrays were pre-hybridized for 2 hours at 42°C with 5 ml of MicroHyb hybridisation solution (ResGen) plus 5 μg denatured Cot-1 DNA (ResGen) and 5 μg of poly dA. The purified and denatured probe was added the hybridisation solution, and hybridisation was carried out 12 to 16 hours at 42°C. Microarrays were washed twice in 2X SSC, 1% SDS at 45°C for 20 minutes, followed by a final wash in 0.5X SSC, 1% SDS at 45°C for 15 minutes. The stringency of the washes were reduced from the recommended 50 and 55°C washes to preserve cross-species hybridisation signals. Data were collected using a Cyclone Storage Phosphor System (Packard Instruments), and quantified using Pathways 3.0 software (ResGen). Data were exported from Pathways 3.0 into SAS [14] for statistical analyses. All microarrays were stripped by pouring boiling 0.5% SDS over them and agitating for one hour. Microarrays were re-used for a total of 5 hybridisations, as recommended by the manufacturer.
Experimental design
A total of six microarrays were used and hybridisations were performed on three consecutive days. Data from days 1, 2 and 3 were the third, fourth and fifth use, respectively, of each microarray. Filters 1, 2 and 3 were hybridized with cDNA reverse transcribed from 2 and 6 μg of pig, and 4 μg of human total RNA, and filters 4, 5 and 6 were hybridized with cDNA reverse transcribed from 4 μg of pig total RNA (see Table 1). Comparisons of 4 μg pig RNA with human or 2 or 6 μg pig RNA (Tables 2 through) used data generated from the third, fourth and fifth uses of filters 4, 5 and 6, respectively.
Statistical methods
Data were normalized by dividing individual intensity levels by the median intensity for the membrane and taking the log. Pairwise Pearson and Spearman correlation coefficients were calculated and averaged over the 9 possible pairs in cross-species comparisons, and three possible pairs in the within species comparisons. Normalization to the median was used because there were a large number of genes with low signals, as well as some outliers. Analyses were performed on a mean normalized dataset and results were similar. We further considered a transformation to an ordinal scale. Each gene was categorized into one of four levels (undetectable 0; low, 0–1.3; medium, 1.3–3; or high, ≥3). We chose these cutpoints to separate the high signals and undetectable signals from the mid-range signals. As these categories were defined arbitrarily, additional cutpoints were examined. This ordinal transformation was performed in order to calculate the kappa statistic. The kappa statistic is a chance corrected measure of agreement, that is the calculation of the statistic takes into account the marginal distributions. The kappa will have lower values than other correlation coefficients when the marginal distributions are unequal, and thus may represent a more realistic assessment of the underlying agreement [7]. Bowkers test for symmetry [14] was used to test the hypothesis that detectable expression from pig and human did not differ systematically.
The variability of each gene was studied by computing the standard deviation of three replicate hybridisation signals for each gene. The distribution of these standard deviations (mean, standard deviation, and range of the 4324 standard deviations) was then examined. Variability across filters was also evaluated by computing the average hybridisation signal for each gene across three replicates, and then calculating the standard error of the means from each filter.
Authors' contributions
Diane Moody is the scientist whose laboratory these experiments were conducted. She developed the cross-species hybridisation protocol and designed the experiment reported in this paper.
Z. Zou is the graduate student who conducted all the experiments and generated the data.
Lauren McIntyre is the statistician who developed the analysis plan, analysed the data and interpreted the results.
All authors participated in the writing of the manuscript.
Supplementary Material
The complete dataset is included as Excel file 'data.xls'. This file includes: gene id, accession number, raw intensity values, mean normalized intensity, median normalized intensity, median normalized log transformed intensity, ordinal transformed intensities, median deviation from the median of the median normalized log transformed intensity, average of median normalized log transformed intensities, standard deviations of median normalized log transformed intensities, standard deviations for filters and filter use number, and identification of variable genes.
Acknowledgments
Acknowledgements
This research was supported in part through the Purdue University Agricultural Research Programs (manuscript identification number 16522) and a grant from the United States Department of Agriculture IFAFS, N0014-94-1-0318 (L.M).
Contributor Information
DE Moody, Email: moodyd@purdue.edu.
Z Zou, Email: chenwei.tseng@mesanetworks.net.
L McIntyre, Email: lmcintyre@purdue.edu.
References
- Schena M, Shalon D, Davis RW, Brown PO. Quantitative monitoring of gene expression patterns with a complementary DNA microarray. Science. 1995;270:467–470. doi: 10.1126/science.270.5235.467. [DOI] [PubMed] [Google Scholar]
- Eisen MB, Spellman PT, Brown PO, Botstein D. Cluster analysis and display of genome-wide expression patterns. Proc Natl Acad Sci USA. 1998;95:14863–14868. doi: 10.1073/pnas.95.25.14863. [DOI] [PMC free article] [PubMed] [Google Scholar]
- Iyer VR, Eisen MB, Ross DT, Schuler G, Moore T, Lee JC, Trent JM, Staudt LM, Hudson J, Jr, Boguski MS, et al. The transcriptional program in the response of human fibroblasts to serum. Science. 1999;283:83–87. doi: 10.1126/science.283.5398.83. [DOI] [PubMed] [Google Scholar]
- Welsh JB, Zarrinkar PP, Sapinoso LM, Kern SG, Behling CA, Monk BJ, Lockhart DJ, Burger RA, Hampton GM. Analysis of gene expression profiles in normal and neoplastic ovarian tissue samples identifies candidate molecular markers of epithelial ovarian cancer. Proc Natl Acad Sci, USA. 2001;98:1176–1181. doi: 10.1073/pnas.98.3.1176. [DOI] [PMC free article] [PubMed] [Google Scholar]
- Davoli R, Zambonelli P, Bigi D, Fontanesi L, Russo V. Analysis of expressed sequence tags of porcine skeletal muscle. Gene. 1991;233:181–188. doi: 10.1016/S0378-1119(99)00141-9. [DOI] [PubMed] [Google Scholar]
- Smith TP, Grosse WM, Freking BA, Roberts AJ, Sone RT, Casas E, Wray JE, White J, Cho J, Fahrenkrug SC, et al. Sequence evaluation of four pooled-tissue normalized bovine cDNA libraries and construction of a gene index for cattle. Genome Research. 2001;11:626–630. doi: 10.1101/gr.170101. [DOI] [PMC free article] [PubMed] [Google Scholar]
- Fleiss J. Statistical Methods for Rates and Proportions. New York, Wiley and Sons. 1981.
- Lee ML, Kuo FC, Whitmore GA, Sklar J. Importance of replication in microarray gene expression studies: statistical methods and evidence from repetitive cDNA hybridizations. Proc Natl Acad Sci USA. 2000;97:9834–9839. doi: 10.1073/pnas.97.18.9834. [DOI] [PMC free article] [PubMed] [Google Scholar]
- Miller NA, Gong Q, Bryan R, Ruvolo M, Turner LA, LaBrie ST. Cross-hybridisation of closely related genes on high-density macroarrays. Biotechniques. 2002;32:620–625. doi: 10.2144/02323pf01. [DOI] [PubMed] [Google Scholar]
- Medhora M, Bousamra M, II, Zhu D, Somberg L, Jacobs ER. Upregulation of collagens detected by gene array in a model of flow-induced pulmonary vascular remodeling. Am J Physiol Heart Circ Physiol. 2002;282:H414–H422. doi: 10.1152/ajpheart.00292.2001. [DOI] [PubMed] [Google Scholar]
- Huang GS, Yang SM, Hong MY, Yang PC, Liu YC. Differential gene expression of livers from ApoE deficient mice. Life Sciences. 2000;68:19–28. doi: 10.1016/S0024-3205(00)00912-7. [DOI] [PubMed] [Google Scholar]
- Cros N, Muller J, Bouju S, Pietu G, Jacquet C, Leger JJ, Marini JF, Dechesne CA. Upregulation of M-creatine kinase and glyceraldehydes-3-phosphate dehydrogenase: two markers of muscle disuse. American J Physiol. 1999;276:R308–R316. doi: 10.1152/ajpregu.1999.276.2.R308. [DOI] [PubMed] [Google Scholar]
- Pritchard CC, Hsu L, Delrow J, Nelson PS. Project normal: defining normal variance in mouse gene expression. Proc Natl Acad Sci, USA. 2001;98:13266–13271. doi: 10.1073/pnas.221465998. [DOI] [PMC free article] [PubMed] [Google Scholar]
- SAS version 8.2. Cary, NC, USA, SAS Institute Inc. 2001.
- Agresti A. Categorical data analysis. New York, NY, Wiley and Sons. 1990.
Associated Data
This section collects any data citations, data availability statements, or supplementary materials included in this article.
Supplementary Materials
The complete dataset is included as Excel file 'data.xls'. This file includes: gene id, accession number, raw intensity values, mean normalized intensity, median normalized intensity, median normalized log transformed intensity, ordinal transformed intensities, median deviation from the median of the median normalized log transformed intensity, average of median normalized log transformed intensities, standard deviations of median normalized log transformed intensities, standard deviations for filters and filter use number, and identification of variable genes.


