Abstract
We present methodologic details and operating characteristics of a procedure with whole blood for the quantitative assessment of intracellular perforin within distinct lymphocyte subsets. Using this method, we analyzed 20 healthy controls and 2 individuals with an inherited deficiency of perforin. The mean ± standard deviation perforin contents of natural killer (NK) cells and cytotoxic T cells of healthy controls were 3,561 ± 1,157 and 500 ± 779 relative number of molecules (rMol) of antiperforin antibody bound per cell, respectively. The NK cell perforin contents of individuals with heterozygous and homozygous perforin deficiency (familial hemophagocytic lymphohistiocytosis) were 2,260 and 212 rMol of antiperforin antibodies per NK cell. While the homozygous deficiency was found to be associated with negligible antiperforin binding, the heterozygous condition was associated with a level of perforin binding that was below the 15th percentile for healthy individuals. Because 83% of this subject's NK cells were shown to bind to antiperforin antibodies by conventional flow cytometry (relative to the normal range of 81% ± 25%), quantitative cytometry may be more sensitive than conventional cytometric methods in identifying cytolytic defects.
The cytotoxic activities of natural killer (NK) cells and cytotoxic T cells (Tc cells) serve to protect the body from infection and cancer by destroying virally infected (2, 19) and neoplastically transformed (5) cells. This process is mediated through a number of independent mechanisms, which include the Fas-Fas ligand, tumor necrosis factor, and lytic granule proteins. The lytic granules contain the protein perforin, which, when released from the cytotoxic effector cell in the vicinity of an aberrant cell, self-assembles into pore-like channels in the target cell membrane (26). This process results in the osmotic lysis of the target cell (15, 17) or in the uptake of the molecules granzyme A and granzyme B by the target cell (6, 21). These granzymes can then activate the process of apoptosis and institute programmed cell death (22) in a perforin-dependent fashion. Perforin, therefore, is an important mediator whose function has been demonstrated in mouse models to be essential in defense against viruses, bacteria, and tumors (7, 9, 24, 25). In humans, homozygous deficiency of perforin results in a progressively fatal dysregulation of the immune system, suggesting also a role for perforin in homeostasis (23). Under these perforin-deficient conditions, NK-cell cytotoxicity is absent (8). Laboratory methods used to evaluate this process usually measure the release of 51Cr from labeled NK-cell-sensitive erythroleukemic (K562) target cells following incubation with the patient's lymphocytes. In this report, we provide details of a method that uses quantitative fluorescence measures of perforin to quantify the cell-associated perforin content of distinct lymphocyte subsets.
MATERIALS AND METHODS
Subjects.
Twenty healthy subjects who denied having acute or chronic illness were included in this study. Also analyzed were two related subjects who were diagnosed with genetic deficiency of perforin. One subject had homozygous deficiency of perforin, and the other was her heterozygous mother. The research conducted here has complied with federal and institutional guidelines on the use of human subjects in research.
Patient history.
Patient A presented at 2 years of age with an acute febrile illness characterized by a temperature to 104°C, lethargy, and a macular rash. She did not have adenopathy or hepatosplenomegaly. Laboratory studies were remarkable for a lymphocytosis with atypical lymphocytes and plasma cells on smear. Her family history was significant for a brother who died of Epstein-Barr virus (EBV)-related lymphoproliferative disease. Immunologic evaluation of patient A showed that she was negative for EBV antibodies and negative by an EBV-specific PCR. Immunologic studies were normal except for reduced NK-cell cytotoxic activity. The episode resolved without specific therapy, and she did well for a year, when she again presented with a similar illness. Studies again showed that she was negative for EBV. At this time she was diagnosed with familial hemophagocytic lymphohistiocytosis (FHL) on the basis of her clinical presentation, family history, and low NK-cell activity (4). She was treated with the etoposide and steroids and referred for an allogeneic bone marrow transplant.
Quantitative fluorescence analysis of intracellular perforin content.
A modification of previously published methods (18) for analysis of intracellular cytokines by flow cytometry was developed for four-color, semiquantitative assessment of the lymphocyte perforin content from whole blood. Heparinized whole blood (300 μl) was fixed with 300 μl of 4% p-formaldehyde for 15 min, followed by the addition of 300 μl of 17.5% bovine serum albumin in phosphate-buffered saline (PBS) for 10 min to stop fixation. The sample was washed two times with PBS and stored overnight at 4°C in PBS-0.1% bovine serum albumin. Fixed samples were then resuspended with 0.1% saponin (Sigma, St. Louis, Mo.) in PBS for 10 min and washed two times in 0.1% saponin. Aliquots (50 μl) were surface stained for 15 min with optimal concentrations of CD8-fluorescein isothiocyanate, energy-coupled dye-labeled anti-CD3-labeled antibody (CD3-ECD), and phycoerythrin-cyanin 5.1-labeled anti-CD56 antibody (CD56-PC5) (Beckman Coulter, Hialeah, Fla.). Isotypic control or phycoerythrin (PE)-labeled antiperforin antibodies (Pharmingen, San Diego, Calif.) were then added for 30 min, followed by two saponin washes and one PBS wash. The samples were resuspended in 0.1% p-formaldehyde and analyzed on an XL-MCL flow cytometer (Beckman Coulter). In select experiments, permeabilized cells were preincubated for 15 min with an excess quantity of unlabeled antiperforin antibodies prior to PE-labeled staining for the assessment of nonspecific binding. Fifty-microliter aliquots of permeabilized whole blood were also incubated with decreasing quantities of PE-labeled antiperforin antibody for the verification of the linearity of binding. Semiquantitative determinations of cell-associated perforin were derived from median fluorescence intensity values. Through the use of QuantiBRITE fluorescence standards (Becton Dickinson, San Jose, Calif.), a standard curve was calculated by plotting the median fluorescence intensity for each standard bead against the known values of the numbers of PE molecules per bead according to the instructions of the manufacturer. Least-squares regression analysis was used to define the equation that fit the curve, and this equation was used to convert median fluorescence intensity values for PE-labeled antiperforin antibody binding to the relative number of molecules (rMol) of antiperforin antibodies per cell. The rMol unit of measure was used because absolute determination of numbers of molecules of perforin would require both verification that one molecule of PE was conjugated to each antibody molecule (1:1 ratio) and knowledge of the stoichiometry of antibody binding to the antigen of interest. Because the manufacturer of the antiperforin antibody targets conjugation to a 1:1 ratio but does not routinely publish the actual data and because the stoichiometry of binding in this system has not yet been determined, the numbers of molecules of perforin expressed are defined relative to the numbers of molecules of antiperforin antibodies bound as determined by the standardized methods reported here. This standardization was carried out in order to increase the precisions and the accuracies of the fluorescence measures by correcting for minor variations in laser intensity and fluorescence compensation that occur over time and to improve the ability to compare the results obtained with different cytometers (20).
NK-cell cytotoxicity assay.
Cytotoxicity against K562 erythroleukemic cell targets was measured in a whole-blood 4-h chromium release assay at four target cell:effector cell ratios. Effector cells were defined as CD3−CD56+ lymphocytes when cells were incubated with optimal dilutions of fluorochrome-labeled antibodies (Beckman Coulter), lysed, and fixed with Q-prep and analyzed by flow cytometry. Results were expressed as percent cytotoxicity at a target cell:effector cell ratio of 1:1 (1, 14).
RESULTS
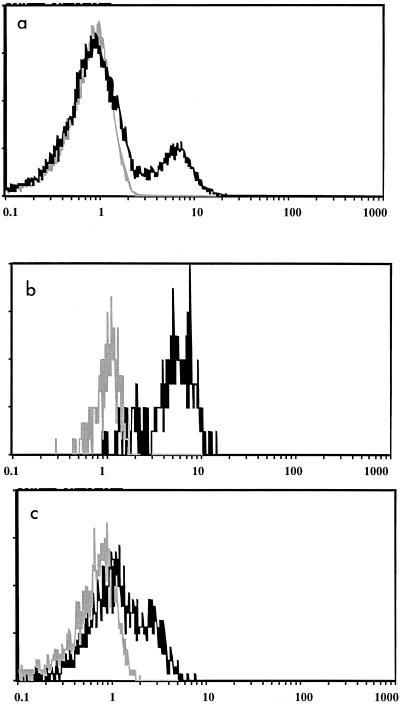
In order to establish the specificity of intracellular staining with the antiperforin antibody, blocking studies were conducted by preincubating permeabilized whole blood with unlabeled antiperforin antibody prior to the addition of PE-labeled antiperforin antibody. A representative example of the results is shown in Fig. 1, which demonstrates that incubation with the antiperforin antibody results in the specific staining of lymphocytes that is completely blocked by the preincubation with unlabeled antiperforin antibody. Also shown (Fig. 1b and c) is the fact that intracellular staining of the NK-cell (CD3−CD56+) and Tc-cell (CD3+CD8+) subsets, which constituted the majority of lymphocyte antiperforin binding, was also specific, being blocked with unlabeled antibody.
FIG. 1.
Specificity of lymphocyte intracellular perforin staining. (a) Staining of lymphocytes incubated with PE-labeled antiperforin antibody alone (black) or following preincubation with unlabeled antiperforin (blocking) antibody (gray); (b) staining of NK cells incubated with PE-labeled antiperforin antibody alone (black) or following preincubation with unlabeled antiperforin (blocking) antibody (gray); (c) staining of cytotoxic T lymphocytes incubated with PE-labeled antiperforin antibody alone (black) or following preincubation with unlabeled perforin (blocking) antibody (gray).
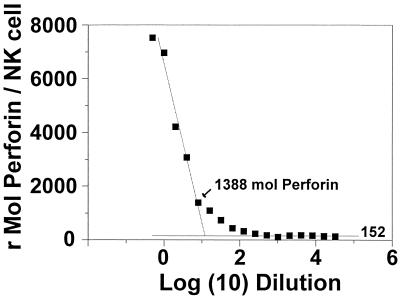
The linear range of antiperforin binding was demonstrated by incubating permeabilized whole blood with decreasing amounts of PE-labeled antibody. The median fluorescence intensities for perforin binding in NK cells were converted to rMol of antiperforin antibodies per NK cell for each dilution. The results for a representative example can be seen in Fig. 2, which demonstrates that serial dilution of antiperforin antibody yielded a linear range of staining for this subject between 1,388 and 6,964 rMol of antiperforin antibodies per NK cell, with a minimal background staining of 152 rMol of antiperforin antibodies per NK cell. Although not entirely evident in Fig. 2 due to the logarithmic scale, maximal binding was near saturation.
FIG. 2.
Binding curve of antiperforin antibody. Aliquots of fixed-permeabilized whole blood were incubated with serial dilutions of PE-labeled antiperforin antibody in 0.1% saponin buffer and analyzed as described in Materials and Methods.
An analysis of the precision of the assay for perforin content determination was conducted by repeated preparation of a single sample. In this analysis the results for a single sample subjected to five separate analyses yielded a coefficient of variation of 9.8%.
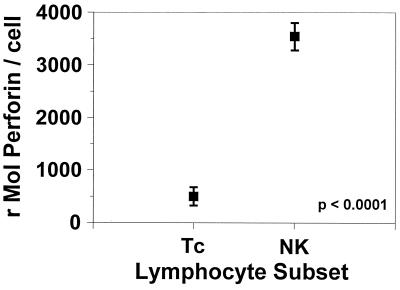
When the perforin contents of NK cells and Tc cells from healthy controls were determined by flow cytometry and compared, it was found that NK cells have a seven times greater ability to specifically bind to the antiperforin antibody than Tc cells, indicating a significantly greater concentration of perforin in NK cells than Tc cells (perforin contents, 500 ± 799 and 3,541 ± 1,157 rMol of antiperforin antibodies per Tc cell and NK cell, respectively [mean ± standard deviation {SD}; P < 0.0001]) (Fig. 3).
FIG. 3.
Perforin contents of Tc cells and NK cells. Quantitative fluorescence measures of antiperforin binding demonstrate a significantly higher antiperforin binding capacity among NK cells relative to that among Tc cells. Data represent means ± standard errors.
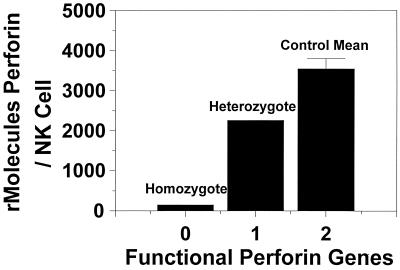
In addition to the analysis of healthy controls, we measured the perforin contents of a child diagnosed with FHL. This condition, which is inherited as an autosomal recessive disorder, results in the nearly complete absence of perforin generation (23). Also tested at this time was the patient's mother, who was a heterozygous carrier of the same defect. As can be seen in Fig. 4, the individual diagnosed with homozygous perforin deficiency had perforin levels consistent with those for background staining (Fig. 2), while the subject's heterozygous mother had an NK-cell perforin content midway between that of the mean for the healthy controls and that of her homozygous daughter.
FIG. 4.
Relationship between NK-cell perforin content and genetic mutation of perforin gene. The subject with FHL (homozygous perforin deficiency) had negligible staining for antiperforin antibody, while her heterozygous mother had a value approximately half of the mean for the controls. Datum points represent the results of single analyses for the perforin-deficient subjects and the mean value for the healthy control group.
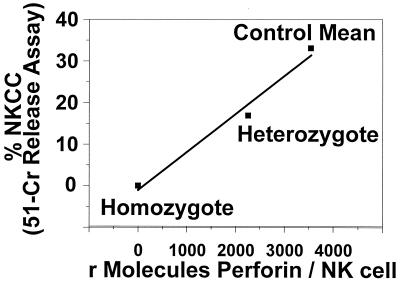
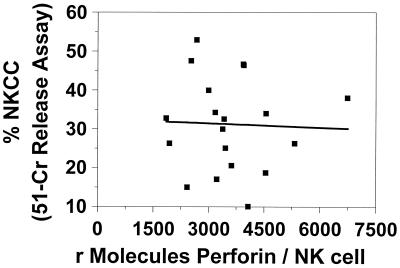
In our final analysis, we explored the relationship between NK-cell cytotoxic activity and the NK-cell perforin contents of healthy controls and subjects with perforin gene defects. In the determination of both intracellular perforin content and NK-cell cytotoxicity, the values for the subject who was heterozygous for perforin deficiency fell midway between the values obtained for the healthy controls and the subject homozygous for the mutation (Fig. 5). The NK-cell cytotoxic activity of the individual with the homozygous perforin defect was 1.4%, while that of her heterozygotic mother was 16.9% (value for controls, 33.1% ± 14.1%). These data suggest that a linear relationship exists between perforin content and NK-cell cytotoxic function when the perforin content is limiting. In contrast, when the perforin content of healthy individuals alone was compared to their NK-cell cytotoxic activity, no direct relationship was seen (Fig. 6).
FIG. 5.
Relationship between intracellular NK-cell perforin content and cytolytic activity. NK-cell cytolytic activity was measured in a whole-blood 51Cr release assay and was found to correlate with the perforin content when the perforin content was limiting. The datum points represent the results of single analyses for the perforin-deficient subjects and the mean value for the healthy control group. NKCC, NK-cell cytotoxicity.
FIG. 6.
NK-cell perforin concentrations do not correlate with NK-cell cytotoxicity (measured by the 51Cr release assay) in healthy controls (n = 19).
DISCUSSION
In this report we describe a protocol for the assessment of the intracellular perforin content using quantitative fluorescence measures. This is based upon the measurement of cell-associated PE fluorescence intensity and its conversion to molecules of protein (bound by antibodies) by using PE quantitation standards (QuantiBRITE). By preblocking with unlabeled antiperforin antibody, we demonstrate that the binding of labeled antibody is specific. The operating characteristics of the system were further characterized by experiments with increasingly limited concentrations of labeled antibody with fixed perforin concentrations (e.g., constant numbers of cells). This is shown in Fig. 2. Although not readily apparent from Fig. 2, when the data are represented with concentration on a linear scale, a plateau is seen. The plateau demonstrates that the concentrations of antibody were in the saturating range. Also demonstrated by this analysis was the fact that the binding for the subject tested was linear from 6,964 to 1,388 rMol of antiperforin antibodies per NK cell. Analysis of the tail of the curve demonstrated that the background fluorescence (likely autofluorescence) of the procedure was equated to 152 ± 19 rMol of antiperforin antibodies per NK cell (mean ± SD) and permitted a determination of the limit of sensitivity of the assay as background fluorescence + 3 SDs, which is equal to 209 rMol of antiperforin antibodies per NK cell.
This procedure was also performed with sera from a series of 20 apparently healthy controls who denied that they had acute or chronic illness. For these subjects, the mean ± SD perforin contents for the NK-cell and Tc-cell subsets were 3,541 ± 1,157 and 500 ± 779 rMol of antiperforin antibodies per cell, respectively. This demonstrated that NK cells have significantly higher stored perforin contents than Tc cells. This finding is in agreement with the concept that NK cells produce perforin constitutively at maximal levels, while the level of perforin transcription by Tc cells increases following stimulation (11-13). Also apparent is the fact that among healthy controls the cellular perforin contents of NK cells are quite variable. The ranges of perforin contents for NK cells and Tc cells were 1,853 to 6,745 and 0 to 2,992 rMol of antiperforin antibodies per cell, respectively.
We also measured the intracellular perforin contents of two additional individuals, one with documented homozygous FHL and her heterozygous parent. This genetic disorder results in the inability of the defective gene to translate functional perforin molecules. As can be seen in Fig. 3, the subject who was homozygous for FHL had negligible perforin expression and the heterozygous parent expressed perforin at a level midway between the mean for the healthy controls and the level for the homozygous subject. These data, which confirm previous observations (10), provide further evidence as to the specificity and linearity of this system.
In addition to perforin content determination, we assessed the NK-cell cytolytic activities of our subjects using 51Cr-labeled K562 cells. In this assay, the subject homozygous for FHL had minimal cytotoxic activity and the heterozygous subject had a value midway between that for the homozygous child and the mean for the healthy controls. This demonstrates that under conditions of limiting perforin contents, the perforin content correlates with cytotoxic potential. Similar plots generated with data for healthy controls only did not yield a strong correlation (r2 = 0.03) and therefore suggest that among healthy controls, perforin content is not the only variable determining cytotoxic activity.
Limitations of this method.
In this procedure it is presumed that antibody binding is saturating, that it is specific, that one antibody molecule is bound per molecule of perforin, and that one molecule of PE is bound per antibody molecule. We have provided evidence to support the first two conditions. Because perforin exists as a nonpolymerized monomer (16), it is reasonable to presume a ratio of one antibody molecule per molecule of perforin at saturation. Although the manufacturers of the antiperforin antibody target their PE:protein ratio at 1:1, the exact ratio is often not readily known. Therefore, we express the number of molecules relative to the actual conjugation ratio of the monoclonal antibody (i.e., rMol of antiperforin per cell).
The determination of perforin content by quantitative fluorescence has certain distinct advantages over conventional methods for assessment of the phenotypes and functions of cytotoxic cells. Phenotyping by conventional flow cytometry yields information on the proportion of cells that bind to antibody relative to the level of binding of an isotype or blocked control. An analysis of healthy controls by this method demonstrated that, relative to the level of binding for the isotype control, the proportion of NK cells that was positive (i.e., that had a level of antibody binding greater than that for the isotype control) for perforin was 81% ± 25% (mean ± SD). A similar analysis of the subject who was heterozygous for perforin deficiency revealed that 83% of her NK cells were positive for perforin. In contrast, when this same sample was analyzed by the quantitative fluorescence method, the perforin content was found to be below the 15th percentile for healthy subjects. This suggests that this method has greater diagnostic sensitivity than conventional cytometry and may have utility as a screening method for perforin defects and in defining familial pedigrees. Such a method would be particularly useful in the majority of cases in which a perforin defect is suspected but is not among the known mutations (3). Furthermore, this nonradioactive, quantitative method yields increased amounts of information pertaining to the cytolytic potential of distinct lymphocyte subsets compared with the amount of information gained from bulk cytotoxicity assays and conventional cytometry. This method will likely have utility in both clinical and research environments.
Acknowledgments
We gratefully acknowledge the expert editorial assistance of Bobbie Jo Nearns, who helped in the preparation of the manuscript. This work was supported by NIH Center Grant 1UD 1-AI 45940; NIMH grants 1 RO3 MH061295, 1P50CA84944, and 5PO1-MH49548; and the Sylvester Comprehensive Cancer Center, Cancer Control Program, Miami, Fla.
REFERENCES
- 1.Baron, G. C., N. G. Klimas, M. A. Fischl, and M. A. Fletcher. 1985. Decreased natural cell-mediated cytotoxicity per effector cell in acquired immunodeficiency syndrome. Diagn. Immunol. 3:197-204. [PubMed] [Google Scholar]
- 2.Biron, C. A., K. S. Byron, and J. L. Sullivan. 1989. Severe herpesvirus infections in an adolescent without natural killer cells. N. Engl. J. Med. 320:1731-1735. [DOI] [PubMed] [Google Scholar]
- 3.Goransdotter Ericson, K., B. Fadeel, S. Nilsson-Ardnor, C. Soderhall, A. Samuelsson, G. Janka, M. Schneider, A. Gurgey, N. Yalman, T. Revesz, R. Egeler, K. Jahnukainen, I. Storm-Mathiesen, A. Haraldsson, J. Poole, G. de Saint Basile, M. Nordenskjold, and J. Henter. 2001. Spectrum of perforin gene mutations in familial hemophagocytic lymphohistiocytosis. Am. J. Hum. Genet. 68:590-597. [DOI] [PMC free article] [PubMed] [Google Scholar]
- 4.Henter, J. I., M. Arico, G. Elinder, S. Imashuku, and G. Janka. 1998. Familial hemophagocytic lymphohistiocytosis. Primary hemophagocytic lymphohistiocytosis. Hematol. Oncol. Clin. N. Am. 12:417-433. [DOI] [PubMed] [Google Scholar]
- 5.Herberman, R. B. 1983. Natural killer cells and tumor immunity. Surv. Immunol. Res. 2:306-308. [DOI] [PubMed] [Google Scholar]
- 6.Hudig, D., T. Haverty, C. Fulcher, D. Redelman, and J. Mendelsohn. 1981. Inhibition of human natural cytotoxicity by macromolecular antiproteases. J. Immunol. 126:1569-1574. [PubMed] [Google Scholar]
- 7.Kagi, D., B. Ledermann, K. Burki, P. Seiler, B. Odermatt, K. J. Olsen, E. R. Podack, R. M. Zinkernagel, and H. Hengartner. 1994. Cytotoxicity mediated by T cells and natural killer cells is greatly impaired in perforin-deficient mice. Nature 369:31-37. [DOI] [PubMed] [Google Scholar]
- 8.Kataoka, Y., S. Todo, Y. Morioka, K. Sugie, Y. Nakamura, J. Yodoi, and S. Imashuku. 1990. Impaired natural killer activity and expression of interleukin-2 receptor antigen in familial erythrophagocytic lymphohistiocytosis. Cancer 65:1937-1941. [DOI] [PubMed] [Google Scholar]
- 9.Kodama, T., K. Takeda, O. Shimozato, Y. Hayakawa, M. Atsuta, K. Kobayashi, M. Ito, H. Yagita, and K. Okumura. 1999. Perforin-dependent NK cell cytotoxicity is sufficient for anti-metastatic effect of IL-12. Eur. J. Immunol. 29:1390-1396. [DOI] [PubMed] [Google Scholar]
- 10.Kogawa, K., S. M. Lee, J. Villanueva, D. Marmer, J. Sumegi, and A. H. Filipovich. 2002. Perforin expression in cytotoxic lymphocytes from patients with hemophagocytic lymphohistiocytosis and their family members. Blood 99:61-66. [DOI] [PubMed] [Google Scholar]
- 11.Koizumi, H., C. C. Liu, L. M. Zheng, S. V. Joag, N. K. Bayne, J. Holoshitz, and J. D. Young. 1991. Expression of perforin and serine esterases by human gamma/delta T cells. J. Exp. Med. 173:499-502. [DOI] [PMC free article] [PubMed] [Google Scholar]
- 12.Liu, C. C., S. Rafii, A. Granelli-Piperno, J. A. Trapani, and J. D. Young. 1989. Perforin and serine esterase gene expression in stimulated human T cells. Kinetics, mitogen requirements, and effects of cyclosporin A. J. Exp. Med. 170:2105-2118. [DOI] [PMC free article] [PubMed] [Google Scholar]
- 13.Nakata, M., A. Kawasaki, M. Azuma, K. Tsuji, H. Matsuda, Y. Shinkai, H. Yagita, and K. Okumura. 1992. Expression of perforin and cytolytic potential of human peripheral blood lymphocyte subpopulations. Int. Immunol. 4:1049-1054. [DOI] [PubMed] [Google Scholar]
- 14.Patarca, R., M. A. Fletcher, and E. R. Podack. 1997. Cytolytic cell functions, p. 296-303. In N. F. Rose, E. D. Macario, and J. D. Folds (ed.), Manual of clinical laboratory immunology, 5th ed. American Society for Microbiology, Washington, D.C.
- 15.Persechini, P. M., J. D. Young, and W. Almers. 1990. Membrane channel formation by the lymphocyte pore-forming protein: comparison between susceptible and resistant target cells. J. Cell Biol. 110:2109-2116. [DOI] [PMC free article] [PubMed] [Google Scholar]
- 16.Podack, E. R., J. D. Young, and Z. A. Cohn. 1985. Isolation and biochemical and functional characterization of perforin 1 from cytolytic T-cell granules. Proc. Natl. Acad. Sci. USA 82:8629-8633. [DOI] [PMC free article] [PubMed] [Google Scholar]
- 17.Poenie, M., R. Y. Tsien, and A. M. Schmitt-Verhulst. 1987. Sequential activation and lethal hit measured by [Ca2+]i in individual cytolytic T cells and targets. EMBO J. 6:2223-2232. [DOI] [PMC free article] [PubMed] [Google Scholar]
- 18.Prussin, C. 1997. Cytokine flow cytometry: understanding cytokine biology at the single-cell level. J. Clin. Immunol. 17:195-204. [DOI] [PubMed] [Google Scholar]
- 19.Ritz, J. 1989. The role of natural killer cells in immune surveillance. N. Engl. J. Med. 320:1748-1749. [DOI] [PubMed] [Google Scholar]
- 20.Schwartz, A., G. E. Marti, R. Poon, J. W. Gratama, and E. Fernandez-Repollet. 1998. Standardizing flow cytometry: a classification system of fluorescence standards used for flow cytometry. Cytometry 33:106-114. [PubMed] [Google Scholar]
- 21.Shi, L., W. K. Nishioka, J. Th'ng, E. M. Bradbury, D. W. Litchfield, and A. H. Greenberg. 1994. Premature p34cdc2 activation required for apoptosis. Science 263:1143-1145. [DOI] [PubMed] [Google Scholar]
- 22.Shresta, S., C. T. Pham, D. A. Thomas, T. A. Graubert, and T. J. Ley. 1998. How do cytotoxic lymphocytes kill their targets? Curr. Opin. Immunol. 10:581-587. [DOI] [PubMed] [Google Scholar]
- 23.Stepp, S. E., R. Dufourcq-Lagelouse, F. Le Deist, S. Bhawan, S. Certain, P. A. Mathew, J. I. Henter, M. Bennett, A. Fischer, G. de Saint Basile, and V. Kumar. 1999. Perforin gene defects in familial hemophagocytic lymphohistiocytosis. Science 286:1957-1959. [DOI] [PubMed] [Google Scholar]
- 24.van den Broek, M. F., D. Kagi, R. M. Zinkernagel, and H. Hengartner. 1995. Perforin dependence of natural killer cell-mediated tumor control in vivo. Eur. J. Immunol. 25:3514-3516. [DOI] [PubMed] [Google Scholar]
- 25.Walsh, C. M., M. Matloubian, C. C. Liu, R. Ueda, C. G. Kurahara, J. L. Christensen, M. T. Huang, J. D. Young, R. Ahmed, and W. R. Clark. 1994. Immune function in mice lacking the perforin gene. Proc. Natl. Acad. Sci. USA 91:10854-10858. [DOI] [PMC free article] [PubMed] [Google Scholar]
- 26.Young, J. D., A. Damiano, M. A. DiNome, L. G. Leong, and Z. A. Cohn. 1987. Dissociation of membrane binding and lytic activities of the lymphocyte pore-forming protein (perforin). J. Exp. Med. 165:1371-1382. [DOI] [PMC free article] [PubMed] [Google Scholar]


