Abstract
I model the behavior of intracellular Ca2+ release with high buffer concentrations. The model uses a spatially discrete array of channel clusters. The channel subunit dynamics is a stochastic representation of the DeYoung-Keizer model. The calculations show that the concentration profile of fast buffer around an open channel is more localized than that of slow buffers. Slow buffers allow for release of larger amounts of Ca2+ from the endoplasmic reticulum and hence bind more Ca2+ than fast buffers with the same dissociation constant and concentration. I find oscillation-like behavior for high slow buffer concentration and low Ca2+ content of the endoplasmic reticulum. High concentration of slow buffer leads to oscillation-like behavior by repetitive wave nucleation for high Ca2+ content of the endoplasmic reticulum. Localization of Ca2+ release by slow buffer, as used in experiments, can be reproduced by the modeling approach.
INTRODUCTION
Ca2+ is used as a second messenger in cell signaling (Tsien and Tsien, 1990; Berridge et al., 1998). Many cells respond with oscillations of the cytosolic Ca2+ concentration to a variety of stimuli (Toescu, 1995; Kummer et al., 2000; Schuster et al., 2001). The rise of the cytosolic Ca2+ concentration is accomplished by influx through the plasma membrane and release of Ca2+ from intracellular stores like the endoplasmic reticulum (ER) into the cytosol. Opening and closing of Ca2+ channels on the ER membrane controls the release. Ca2+ is pumped back from the cytosol into the ER by SERCATPases.
The state of channels changes stochastically. The transition probabilities between the states depend on binding of ligands to the channel. The ligands are Ca2+ and IP3 in the case of the IP3 receptor channel IP3R (Taylor, 1998; Patel et al., 1999). That stochastic behavior manifests itself as spontaneous release events called puffs and the termination of wave propagation by fluctuations (abortive waves) (Sun et al., 1998; Callamaras and Parker, 2000; Marchant and Parker, 2001; Thomas et al., 1999; Bootman et al. 1997).
Channels are spatially grouped in clusters (Parker and Yao, 1991; Sun et al., 1998; Thomas et al., 1998; Mak et al., 2000; Mak and Foskett, 1998). The clusters are arranged irregularly on the ER membrane with a typical spacing of 2–6 μm. As a superstructure on that irregular cluster array, focal sites exist, which are membrane areas with an increased density of clusters (Lechleiter et al., 1991; Callamaras and Parker, 2000; Marchant and Parker, 2001).
Another important element in Ca2+ handling are buffers. Buffers are proteins binding most of the Ca2+ in a cell (up to 99%). They are present in the cytosol as well as the ER. Depending on their diffusion characteristics, buffers are considered as mobile or immobile. The rate constants of Ca2+ binding and dissociation cover a wide range from slow buffers  to fast buffers
Modeling of intracellular Ca2+ dynamics focused in the beginning on models for the channel dynamics (Berridge, 1989; Goldbeter et al., 1990; DeYoung and Keizer, 1992; Tang and Othmer, 1996) and represented cells as a continuous medium. With the focus of experimental research shifting to localized, stochastic events in recent years, modeling work of single cluster profiles and discrete cluster arrays appeared (Smith et al., 1998; Smith et al., 2001; Mitkov et al., 1998; Pearson and Ponce-Dawson, 1998). The stochastic behavior seen in spark and puff formation motivated the introduction of stochastic models (Swillens et al., 1998; Keizer and Smith, 1998; Swillens et al., 1999; Falcke et al., 2000; Bär et al., 2000; Falcke, 2002; Shuai and Jung, 2002) focusing mostly on single clusters (Swillens et al., 1998; Swillens et al., 1999; Shuai and Jung, 2002) or cluster arrays (Keizer and Smith, 1998; Bär et al., 2000; Falcke et al., 2000; Falcke 2003).
Stochastic models are of course needed to describe stochastic events like puffs. However, recent studies showed that there may be further consequences of stochastic channel behavior. Random fluctuations may cause oscillation-like behavior on a wide range of experimentally observed periods although the deterministic dynamic regime is nonoscillatory (Falcke, 2003). Single clusters can show a preferred frequency in their spontaneous behavior in an excitable regime too (Shuai and Jung, 2002). These findings underline the importance of stochastic modeling beyond the obvious experimental manifestations like spontaneous puffs.
All models so far used the approximation of fast buffers and could therefore not consider the impact of slow buffers. However, slow buffers are used as an experimental tool e.g., to isolate single release events (Roberts, 1994; Callamaras and Parker, 2000). Moreover, buffers can control intracellular Ca2+ dynamics by tuning spatial coupling of channel clusters. That determines the average period of oscillations due to wave nucleation (Falcke, 2003; Lukyanenko and Györke, 1999). Wave nucleation is a stochastic process. Hence, it is worthwhile to investigate intracellular Ca2+ dynamics with a stochastic model and high buffer concentrations.
Recently, we introduced a model concept for intracellular Ca2+ handling taking into account the spatially discrete arrangement of channel clusters as well as the stochastic behavior of single channels (Falcke et al., 2000; Falcke, 2003). Based on the time scale separation between the dynamics of the Ca2+ concentration profile and the channels, we used an adiabatic approximation (quasisteady-state approximation) for the diffusion processes. That approach could consider fast buffers only. Here, I supplement that approximation by a two time scale analysis allowing for modeling a system including slow buffers.
I will describe the model and the results of the time scale analysis in the following section. The mathematical details are given in the “Two time scale analysis” section. The simulations show that slow buffers can lead to oscillation-like behavior in different ways. If the buffer binding and unbinding rates are very slow and the cytosolic buffer concentration is high enough to bind most of the Ca2+ in the cell, oscillations occur. The oscillations could be described as a periodic exchange of Ca2+ between the buffers and the ER mediated by IP3R's and the SERCA's. Fast buffers suppress the cooperativity between the release channels needed for that effect. I have shown (Falcke, 2003) that fast buffers can lead to oscillation-like behavior by reducing spatial coupling between clusters. That can be achieved by high concentrations of slow buffers too as shown in this report. Furthermore, I find that localization of release by slow buffers as used in experiments can be modeled with the approach presented here.
MATERIALS AND METHODS
The reaction diffusion equations
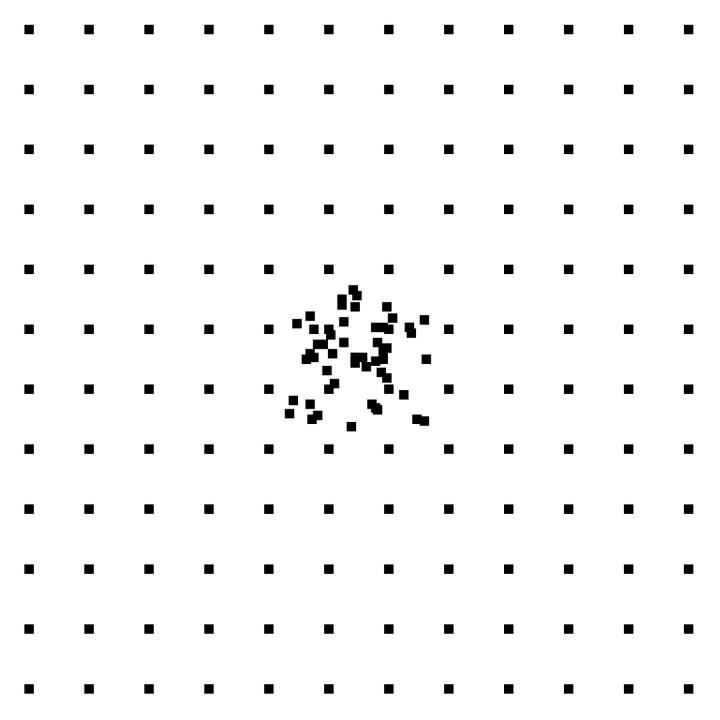
The channel clusters on the ER membrane do not form a regular grid. However, I would like to focus on the stochastic behavior of the channels. Hence, I exclude that frozen irregularity and choose a regular grid with spacing d as the basic cluster arrangement. I put more randomly uniformly distributed clusters in the center of the area to mimic a focal site (Fig. 1). The interior of the cell is modeled as a spatially two dimensional area. The reaction diffusion equations for the Ca2+ concentrations and the buffers with Ca2+ bound are given in the “Two time scale analysis” section. In principle, the approach is the same as for the case with fast variables only (Falcke, 2003) except that the amplitude A (see below) becomes space dependent now. That space dependence is caused by slow buffers. I will focus on describing this expansion of the model here.
FIGURE 1.
Example of cluster array used in some simulations.
I denote the vector formed by the numbers of open channels of all clusters No(t) where the ith component is the number of open channels of the ith cluster. That vector is obtained from the stochastic simulation of the channel dynamics. The simulation of the channel dynamics is identical to that used in Falcke (2003).
The buffers with Ca2+ bound in the cytosol are denoted bi, those in the ER bE,j. I do not consider slow buffers for the time being but will deal with them further below. Immobile buffers are modeled by setting their diffusion coefficient equal to zero. The variables E and c are the concentration of free Ca2+ in the ER and cytosol.
The total Ca2+ concentration is defined as:
 |
(1) |
That total concentration obeys:
 |
(2) |
Here I define the variable A as:
 |
(3) |
obtaining finally:
 |
(4) |
I assume that the dynamics of the different concentrations are sufficiently fast to reach the stationary solution belonging to a certain No(t) before No(t) changes. That assumption is very well fulfilled at the location of an opening channel. It is an approximation for length scales of cluster spacings because it takes ∼100–200 ms for free Ca2+ to diffuse that distance. The consequences are discussed in Falcke (2003). The stationary solution of Eq. 4 with zero flux or periodic boundary conditions is a constant  I use that constant to express the lumenal concentration E by the other concentrations:
 |
(5) |
Finally, I use the concentration profiles to determine the value of A0 according to the total Ca2+ content of the cell expressed as a spatially averaged concentration C0:
 |
(6) |
So far I derived the equations for fast variables only. Additional time and length scales appear, if a slow buffer bslow is used. The binding and dissociation rate constants of slow buffers are much smaller than the constants of fast buffers. That is indicated by writing them as  and
and 
 |
(7) |
I assume that the slow local dynamics do not generate steep gradients. That leads to a  length scale for the slow buffers
  and a diffusion term of order ɛ. Introducing the time scale τ as
  I reach:
 |
(8) |
The slow dynamics cause a dependence of A0 on τ and ξ. As a result of a two time scale analysis, shown in detail in the last section of this article, I obtain:
 |
(9) |
Note that the solution of Eq. 9 is determined up to an arbitrary constant only which is fixed by Eq. 6 with the slow buffer now contributing to the total Ca2+ concentration.
Single cluster profiles
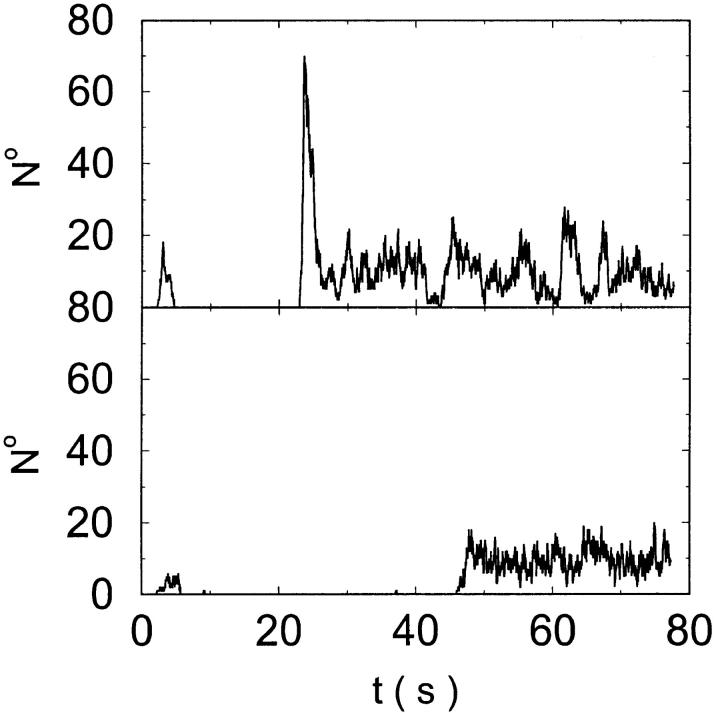
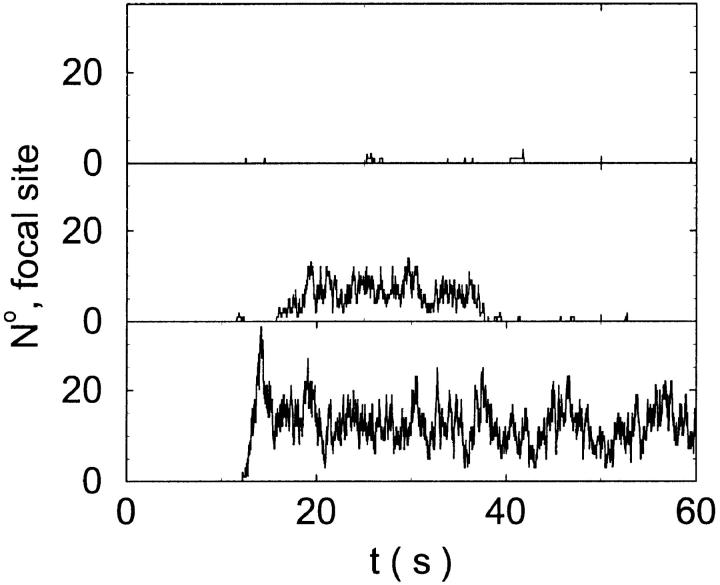
The total number of open channels No for two simulations is shown in Fig. 2. [IP3 ] was kept at 0.06 μM until  and then set to 0.24 μM. A peak in the number of open channels follows the step increase in [IP3] in the case with high slow buffer concentration (Fig. 2, top). That is different from the simulation with high fast buffer concentration where single channel openings do not lead to higher activity for a long time. Finally, the system switches to a state with a maintained activity of ∼10 open channels. We will encounter that typical behavior again when we look at the results in detail.
FIGURE 2.
Global number of open channels No in a simulation of the complete fully coupled model Eqs. 25, 26, 29, and 30 without the single cluster profile approximation. (Top panel) 
 (Bottom panel)
 For both panels:


 ,
, 


 The integration area is 30.72 × 30.72 μm2 and contains 8 × 8 clusters.
The simulations shown in Fig. 2 were done by solving Eqs. 25 and 26, and Eqs. 8, 9, 25, and 26 in the case of Fig. 2, top. The solution of Eq. 25 after each change of No(t) is computationally expensive. A single run of 100 s real time takes several hundred hours of cpu time. That is one of the motivations to approximate the complete solution of concentration fields by the superposition of single cluster profiles. Besides that, the single cluster profiles are a convenient tool to understand what happens during the dynamics.
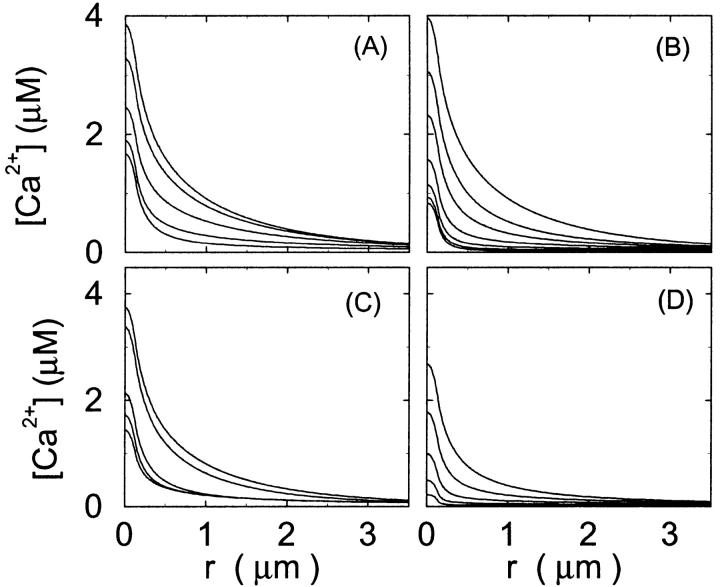
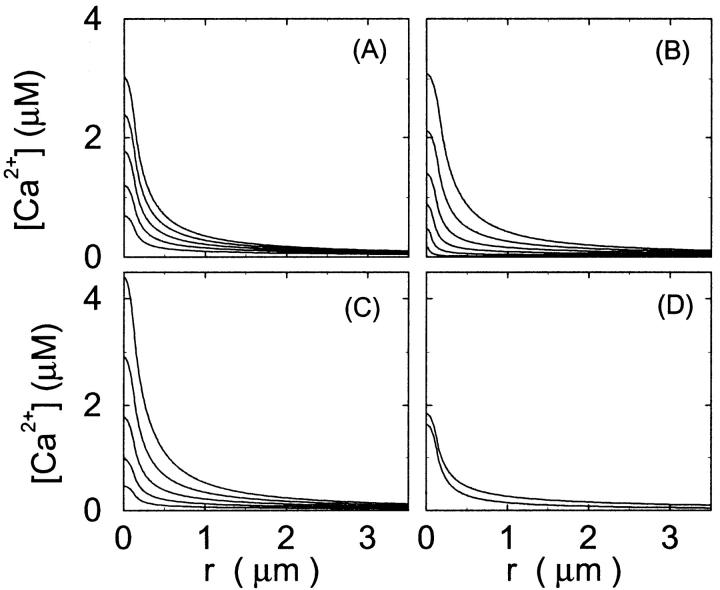
As can be seen in the plots of single cluster concentration profiles shown in Figs. 3 and 4, the Ca2+ concentration around a single cluster with open channels is strongly localized. I take advantage of that to simplify the solution for a large array of clusters by representing the full solution as a superposition of single cluster profiles. I denote the solution vector  with
with  The single cluster profile
  is defined as the stationary solution of Eq. 25 for a single cluster at the position ri in the center of a large area with no flux boundary conditions and
  open channels.
FIGURE 3.
Single cluster profiles of cytosolic Ca2+ for different parameters of the exogenous buffer. Parameters not mentioned are like in Table 1. (A) Lines from bottom to top 
 was kept constant; (B) Lines from bottom to top
  (C) Lines from bottom to top
  Kex is kept constant; (D) Lines from bottom to top
FIGURE 4.
Single cluster profiles of cytosolic Ca2+ for different cluster parameters. Parameters not mentioned are like in Table 1. (A) Lines from bottom to top  (B) Lines from bottom to top
  (C) Lines from bottom to top
  (D) Lines from bottom to top
I split the solution into the base level of concentrations U0, calculated with the current A0 and  , and the contributions of open channels Uc (
 for the ith cluster).
  decays to 0 for large distances to the open cluster. It reads for the ith cluster:
 |
(10) |
 |
A0 enters the differential equations with the very small prefactor of the leak flux Pl only outside a cluster. The contribution of the leak flux to the profile around open channels is negligible. Hence, the spatial variation of A0 there will have almost no impact on Uc. Consequently, I neglect the dependence of A0 on r outside the cluster and calculate  with the value of A0 at the position of the cluster taken as a constant for all r. The variation in the cytosolic concentration resulting from the leak term can be of the order of the base level and hence is not neglected in the calculation of U0. However, diffusion terms resulting from an inhomogeneous base level are negligible compared to the diffusion of A0 and the diffusion resulting from the contribution of open channels. Consequently, the base level U0 is calculated for a given
  as the solution of Eq. 25 with all channels closed and all diffusion coefficients set to zero.
Finally, the superposition of single cluster profiles is formed by adding to the base level the contributions from the open channels:
 |
(11) |
 |
Examples for single cluster profiles are shown in Figs. 3 and 4. They were calculated for a large circular area with a single cluster in the center and no flux boundary conditions. The concentration profiles of single channels or clusters have been investigated in detail in recent years (Stern, 1992; Smith et al., 2001; Smith, 1996; Smith et al., 1996; Bertram et al., 1999; Pape et al., 1995; Naraghi and Neher, 1997; Neher, 1998; Rios et al., 1999; Gonzalez et al., 2000). Hence, I will discuss aspects of importance in the context of this study only.
Fig. 3 illustrates the dependence on buffer parameters of the fast mobile buffer bex. The amplitude of free Ca2+ increases with the dissociation constant of the buffer Kex (Fig. 3 A) because less Ca2+ is bound when Kex increases. High mobility of buffers leads to low peak values of free cytosolic Ca2+ (Fig. 3 B). Buffer molecules with Ca2+ bound can rapidly diffuse away and a large diffusion flux of unoccupied buffer molecules toward the cluster enhances buffering (facilitated diffusion (Keener and Sneyd, 1998)). In Fig. 3 C, we changed the rates  and
and  while keeping Kex constant. The faster the buffer, the lower the peaks of free Ca2+. The fast buffer is not in equilibrium (i.e., the stationary state of binding and unbinding) around a channel mouth. There is an excess of Ca2+-free buffer because of the directions of the diffusion flux for bound and Ca2+-free buffer. Bound buffer diffuses away from the cluster and Ca2+-free buffer toward the cluster. The excess vanishes for infinitely fast buffers, or in other words, more Ca2+ is buffered at the channel mouth for faster binding rates. As the last buffer parameter, I vary the total concentration Bex. Increasing the value of Bex decreases the peak of free Ca2+. Furthermore, localization becomes stronger with increasing buffer concentration beyond the decrease in amplitude. That can be explained by the sink effect of gradients in buffered systems described in (Wagner et al., 1998).
The dependence of the single cluster profiles on some cluster characteristics is shown in Fig. 4. The peak concentration at the center of the cluster depends linearly on Pc for the range shown. The amplitude saturates for very large values of Pc (data not shown). Fig. 4 C deals with the dependence on the total amount of Ca2+ in the cell. In systems with slow buffers, the role of that total amount is taken over by the total amount of Ca2+ not bound to slow buffer. Hence, the change in single cluster profiles we see in Fig. 4 C with decreasing C0 corresponds to the change with increasing binding of Ca2+ to slow buffers. Finally, I change the pump strength by a factor of 5 in Fig. 4 D. The impact on the peak values is negligible. Pumping is more important for the profile values at large distances.
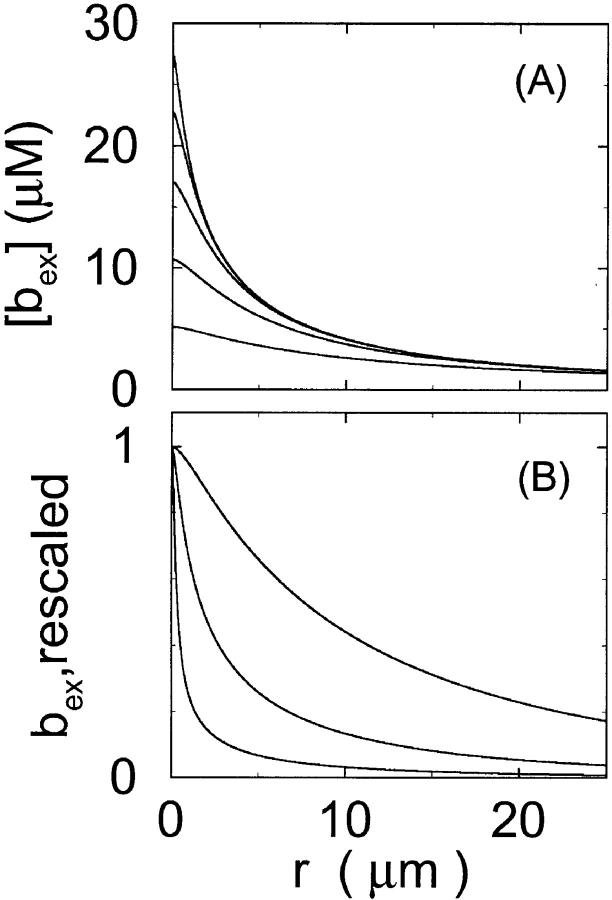
I show the single cluster profile of mobile high affinity buffers in Fig. 5 A. These are the profiles of bex belonging to the Ca2+ profiles in Fig. 3 C. The profiles are not localized on the length scale of cluster distances and hence the superposition would not be a good approximation. I will explain in the next section, how to circumvent that problem. Localization is determined by the diffusion coefficient of the buffer, the KD, and the values of the binding and unbinding rates. The slower the buffer, the less localized is the profile. To compare that feature for different time scales, I rescaled the profile of the simulation with the fastest and the slowest buffer both with their peak values (Fig. 5 B). That clearly shows that slow buffers have less localized profiles than fast ones even for the stationary solution. The slow buffer diffuses farther than the fast one before losing its Ca2+ taken up at the cluster. I included the profile of the fast mobile buffer with a higher KD and a smaller diffusion coefficient into Fig. 5 B too. That profile is sufficiently localized on the length scale of cluster spacing d (5.76 μm). As can be seen in Fig. 5 A too, a fast buffer has a well localized profile, if its KD is comparable to the concentration of free Ca2+ close to the cluster. The buffer profile becomes less localized with decreasing KD.
FIGURE 5.
Profiles of fast buffers. (A) Profiles of bex corresponding to the profiles of free cytosolic Ca2+ in Fig. 3 C. Lines from top to bottom  Kex is kept constant. (B) Lines from high to low values:


 profiles were rescaled by their peak values.
Before I present the results of our simulations, I would like to summarize the procedure of one iteration step. Starting from a given configuration of open clusters No(t), I calculate the complete concentration field by superposition of the single cluster profiles ensuring conservation of the total Ca2+. That concentration field serves for integration of the partial differential equations (PDE) for A0, bslow and for determination of the probabilities for the random transition to the next state of No(t). That state is determined by one step of a stochastic simulation for all channel subunits.
RESULTS
I focus on the action of high concentrations of fast and slow buffers. I start with low Ca2+ content of the ER. I have chosen a volume fraction  of the ER volume and a total concentration of 288 μM Ca2+ in the ER (∼200 μM bound to saturated buffers). The volume ratio may seem rather high and the total Ca2+ concentration rather low. However, stationary buffers essentially provide an increase of the effective volume
  The total Ca2+ content of the ER is approximately
  (V cytosol volume). Hence, the system should behave the same for comparable values of
  that include smaller values of γ−1 and larger values of BEs. I will consider high and very high ER content further below in this section.
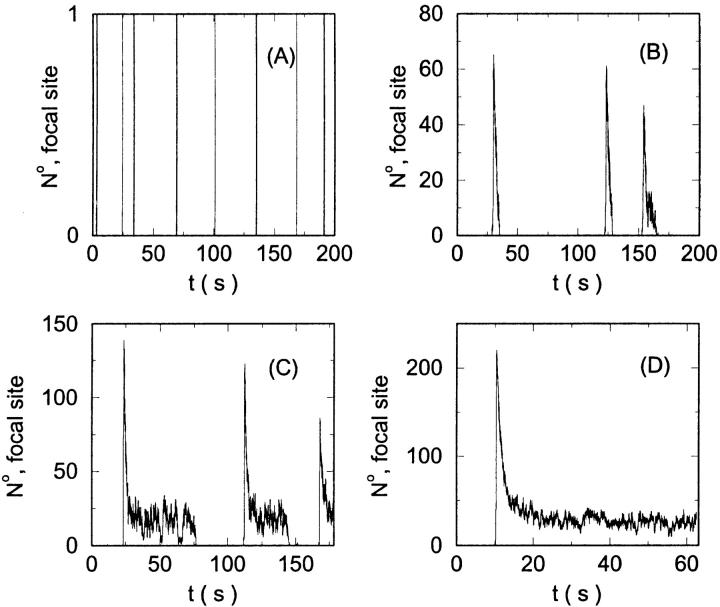
I will use the behavior of the system with low slow buffer concentration as a reference for the simulations with high buffer concentrations. The behavior of that system for different values of [IP3 ] is illustrated in Fig. 6. It shows the number of open channels in the focal site in dependence on time. The initial condition of the simulation was chosen according to the stationary distribution. In addition, the concentration of IP3 was set to 0.05 μM for the first 10 s of the simulation and then to different higher values thus mimicking a quick rise of IP3 like liberation of caged IP3 by UV flashes in experiments. I followed that protocol in all simulations. At very low [IP3], only single, rare opening events are observed (Fig. 6 A). Increasing [IP3 ] leads to brief events involving up to 60 open channels separated by quiescent phases (Fig. 6 B). I call those events spikes. Spikes at the focal site set off a wave spreading through the whole system. Upon a further rise of [IP3], spikes entail extended phases of activity terminating randomly. At high IP3 concentrations, a high activity is maintained permanently.
FIGURE 6.
Number of open channels at the focal site dependent on time with increasing [IP3]. 
 (A)
(A)  (B)
(B)  (C)
(C)  (D)
(D) 
Now I add 400 μM of slow buffer to the system  Here and in all simulations when buffer concentration was increased, I increased C0 too until the cytosolic base level of free calcium is the same as before buffer addition. I choose the case with maintained activity (
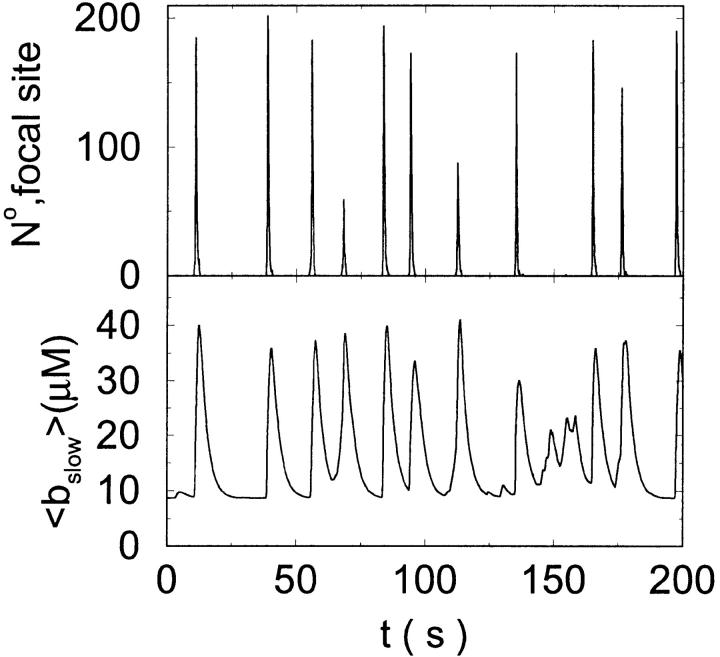
 Fig. 6 D) to demonstrate the action of high slow buffer concentration. The permanent activity turns into repetitive spikes separated by quiescent phases because of the buffer addition (Fig. 7). The explanation for that behavior is found by looking at the amount of buffer bound Ca2+. The slow buffer takes up a large fraction of the total Ca2+ in the cell during an opening spike because of the high concentration of free Ca2+ (Fig. 7, bottom). It keeps Ca2+ bound for several seconds. That amount is not at the disposal of calcium induced calcium release anymore. Consequently, even if spontaneous openings occur while a large fraction of Ca2+ is bound to the slow buffer, the amplitude of the Ca2+ profile is too small to initiate a spike. Furthermore, the large amount of Ca2+ bound to buffer causes a decrease of the base level of free Ca2+ rendering openings less likely.
FIGURE 7.
(Top panel) Number of open channels at the focal site dependent on time. (Bottom panel) Spatially average concentration of Ca2+ bound to slow buffer bslow. Both: 


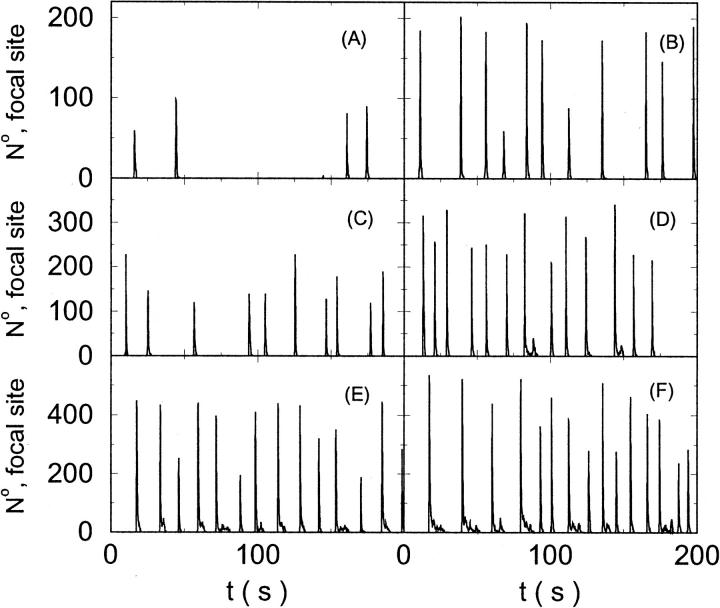
The characteristics of repetitive spiking with high slow buffer concentration depend on [IP3]. As can be seen in Fig. 8, spikes are rare at low [IP3]. The interspike interval is determined by the probability for an event able to ignite a spike. Because I kept the Ca2+ base level constant and the amplitude necessary for a supercritical event in the focal site is small, that probability is essentially the same as with little slow buffer and the same IP3 concentration. Spike amplitude grows and the interspike interval and its variance decrease with increasing [IP3]. However, even at high [IP3], when many channels in the focal site are involved, spikes do not occur completely regularly.
FIGURE 8.
The number of open channels at the focal site dependent on time for different values of [IP3 ] with high concentration of slow buffer. (A)  (B)
(B)  (C)
(C)  (D)
(D)  (E)
(E)  (F)
(F)  (All panels)

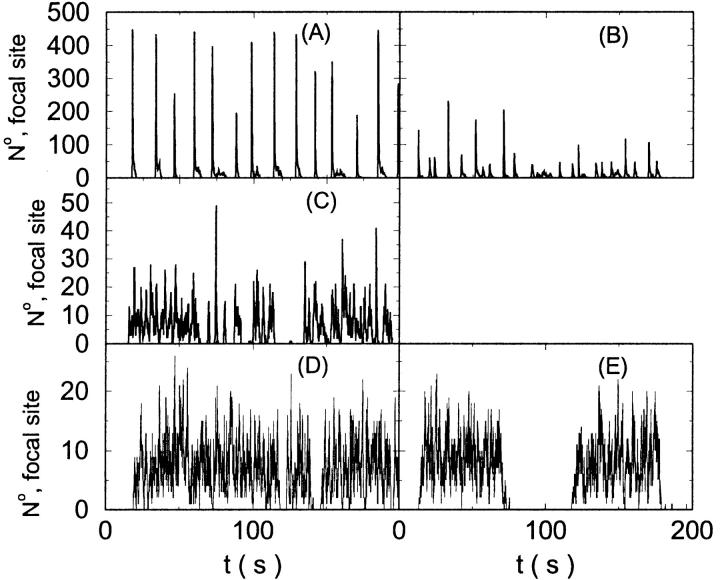
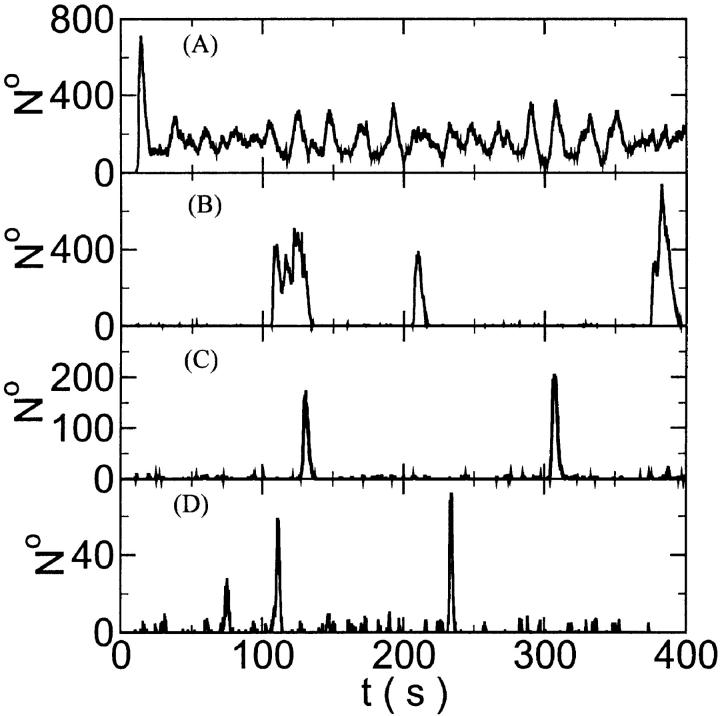
The degree of buffering depends on the buffer binding and dissociation rates. I show in Fig. 9 how the behavior changes with the transition from slow to fast buffers at high [IP3]. Repetitive spikes are observed with slow buffers  The amplitude of the spikes is reduced quickly with increasing buffer rates. At
  already, fast buffer behavior (as described above) is reached and does not qualitatively change by speeding up buffers even to
  Fast buffer behavior is long phases of “low level” activity as opposed to spiking with slow buffers. Note that the “low level” activity is small compared to the peak values of spikes but larger than base level activity.
FIGURE 9.
The number of open channels No dependent on time for different buffer binding and dissociation rates. (All panels) 

 (A)
(A)  (B)
(B)  (C)
(C)  (D)
(D)  , (E)
, (E) 
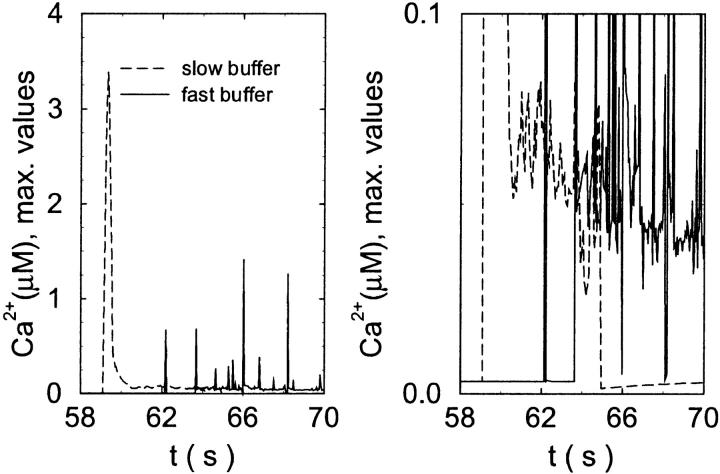
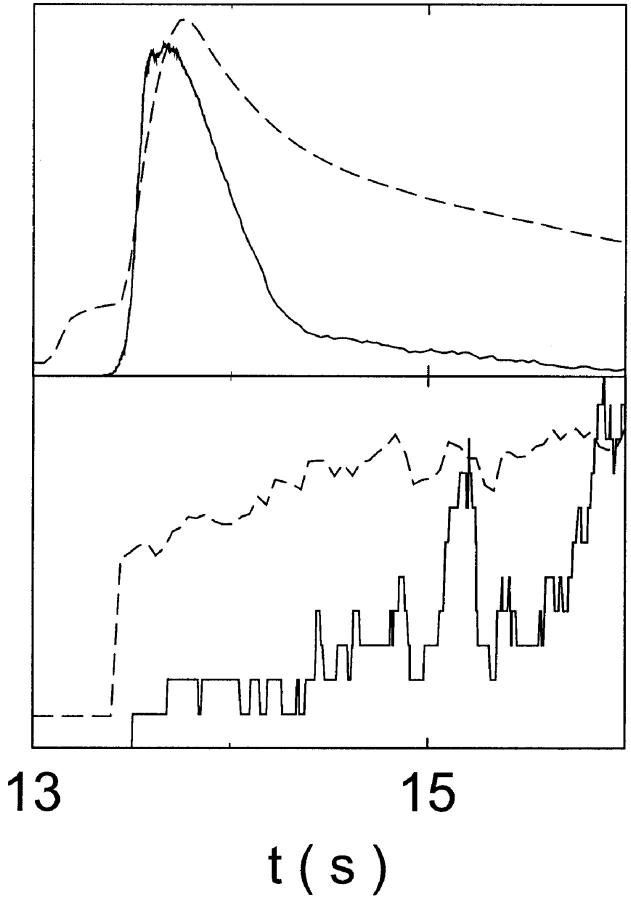
The temporal relation between the number of open channels, the concentration of free Ca2+, and the concentration of buffer bound Ca2+ explains the differential behavior with fast and slow buffering. The maximal values of free Ca2+ reached are much larger with slow buffer than with the fast one (Fig. 10). The Ca2+ amplitude of a single opening event decreases with increasing binding rates as we have seen with the single cluster profiles. Hence, the cooperative effect of facilitating the opening of further channels by the first channel open is diminished with fast buffers. However, that very cooperativity is what boosts the amplitude of spikes with slow buffers. That can be seen in Fig. 11. The number of open channels increases slowly with fast buffer whereas the fast buffer bound Ca2+ reaches high concentrations essentially immediately upon opening of the first channel. The slow buffer with Ca2+ bound reaches its maximum after the peak number of open channels. Slow buffers reduce the amplitude of free Ca2+ close to the cluster only when they have bound a large fraction of the total Ca2+ in the cell. That takes a few seconds. The peak free Ca2+ values of openings at that late time are comparable to those of the fast buffer case (Fig. 10).
FIGURE 10.
Comparison of the time courses of the peak free [Ca2+] for fast (solid line) and slow buffer (dashed line). The right panel is a blowup of small [Ca2+] of the left one. (Both panels) 

 slow
slow 
 fast
fast 

FIGURE 11.
Comparison of the time courses of the number of open channels No (solid line) and buffer bound Ca2+ bslow (dashed line) for slow buffer (top panel,  ) and fast buffer (bottom panel,
  ). No and bslow are given in arbitrary units rescaled for the purpose of comparison. Both


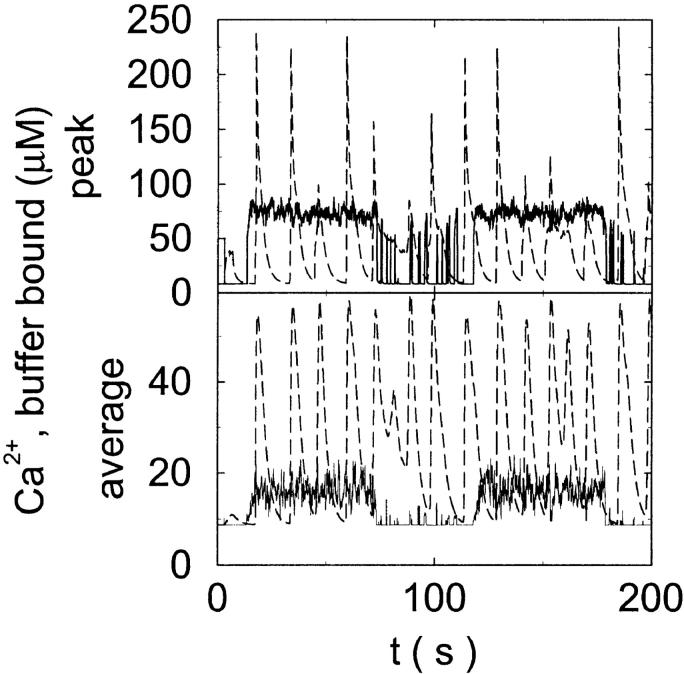
Slow buffers take up more Ca2+ than fast buffers with the same dissociation constant (Fig. 12). One reason is that they form a larger “cloud” of buffer bound Ca2+ around a cluster with open channels (see Fig. 5 C). Additionally, because of the larger initial amplitudes of free Ca2+, more channels open and more Ca2+ is released which then binds to the cytosolic buffer. The large amount of Ca2+ bound to slow buffer cannot be used for Ca2+ induced Ca2+ release anymore, which finally leads to termination of release activity like described for the repetitive spikes above.
FIGURE 12.
Buffer bound Ca2+ bslow with slow (dashed line,  ) and fast (solid line,
  ) buffers. (Top) Peak values. (Bottom) Spatial average. Both


The time scale separation between the fast variables of the model and a buffer with  and
and  is still one order of magnitude. Hence, the two time scale analysis is still valid for that case and the slow buffer equation can be used to integrate buffers with these characteristics. If the slow buffer becomes even faster, another feature of that equation comes into play. The stationary solution of Eqs. 8, 9, and 25 is equal to the exact stationary solution. With fast buffer rates in Eq. 8, that stationary solution is reached within milliseconds. Hence, I can use that equation for the fast buffers too. That was actually done during the transition from slow to fast buffers described above. I circumvent that problem of insufficient localization of fast, high affinity buffers too in that way. That approach is supported by the fact that simulations of the completely coupled system (Fig. 2)—without the single cluster profile superposition—show the same fast buffer behavior as in Fig. 9.
The number of open channels during the maintained release activity with fast buffers depends on the buffer capacity. I show simulations for different values of the dissociation constant in Fig. 13. The high buffer capacity with  suppresses all cooperative effects and only openings of single channels occur. That changes toward larger numbers with increasing Kslow. That finding can be understood immediately because larger Kslow allows for larger cytosolic Ca2+ concentration and hence larger open probability.
FIGURE 13.
Number of open channels No at the focal site dependent on time for different dissociation constants of fast exogenous buffer 
 from top to bottom


All simulations shown until now used a rather low Ca2+ content of the endoplasmic reticulum. Slow buffers in high concentrations change the behavior of a system with large Ca2+ concentration as well. The total Ca2+ content of the ER in the simulations shown in Figs. 14 and 15 is ≈53 mM  These values were chosen to ensure that there are not any effects of ER depletion. Furthermore, we use slow buffer characteristics similar to that of EGTA (
 and
and  ) from now on.
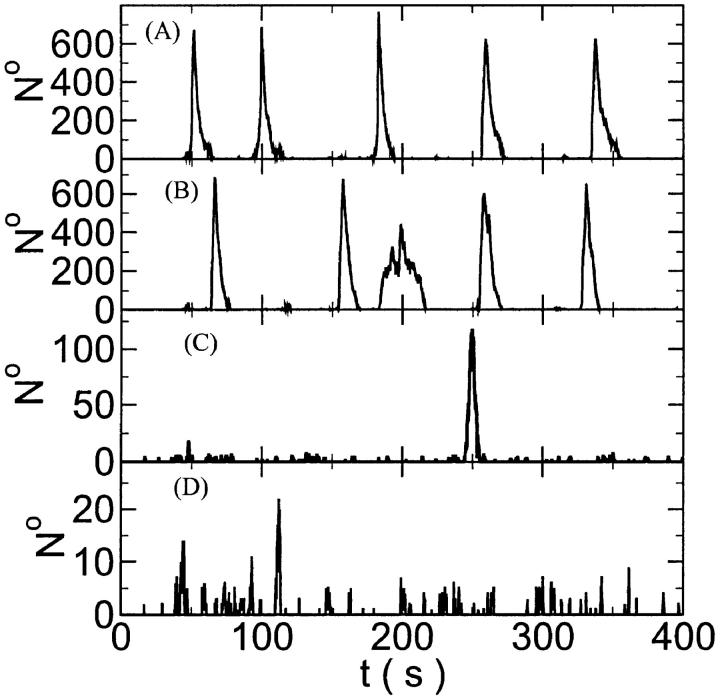
FIGURE 14.
Number of open channels No dependent on time for different concentrations Bslow. (A)  (B)
(B)  (C)
(C)  (D)
(D)  (All panels)


FIGURE 15.
Number of open channels No dependent on time for different concentrations Bslow. (A)  (B)
(B)  (C)
(C)  (D)
(D)  (All panels)


Simulations with these parameters are shown in Figs. 14 and 15. The concentration of slow buffer increases from the top panel to the bottom panel in Figs. 14 and 15. The behavior without slow buffer is very similar for both systems and it is that of Fig. 14 A. Increasing concentration of buffer turns small period oscillations into spikes with long interspike intervals and puff activity only is left at very high values. The mechanism is here a decrease of spatial coupling because of localization of the coupling functions by the slow buffer. The time scale of the intervals between spikes is set by the probability of nucleating a wave and not by any time scale of the channel or buffer dynamics. The nucleation mechanism was investigated in greater detail in Falcke (2003). I find the same pattern as in Falcke (2003) with fast buffer, i.e., the interspike interval increases with decreasing spatial coupling. That mechanism of setting the time scale of the interspike interval is different from the oscillations with low Ca2+ content of the ER and high slow buffer concentration where the dissociation of Ca2+ from the buffer  sets the time scale of the oscillations.
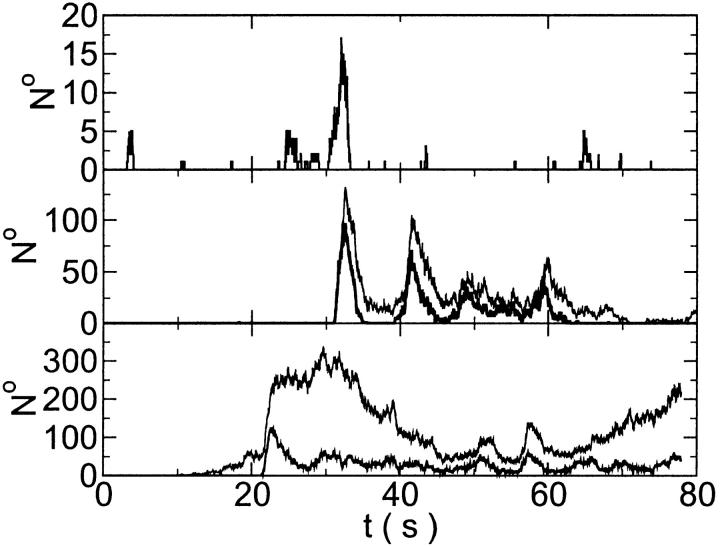
Finally, I would like to show that isolation of focal sites by high buffer concentration can be obtained with realistic values of the Ca2+ content of the ER  Marchant et al. (1999) used 300 μM EGTA plus additional 150 μM Ca2+ to prevent spreading of release from focal sites. I use the buffer constants
 approximately corresponding to the value of
  given in Tsien (1980) and
  from Marchant et al. (1999). Simulation results are shown in Fig. 16. I added different amounts of Ca2+ to the total Ca2+ in the cell. One part of that Ca2+ compensates for the cytosolic Ca2+ buffered by the additional buffer and the other part is taken up by the ER. Localization is essentially complete for the least amount of added Ca2+ (Fig. 16, top panel) but the number of opening channels is strongly diminished too. The effect of additional buffer is compensated for by large amounts of additional Ca2+ in the simulation shown in the bottom panel as can be deduced from the large global number of open channels. A comparison of the simulations in the middle and bottom panel shows that with intermediate amounts of additional Ca2+ localization of activity to the focal site and a few neighboring clusters can be achieved without any essential decrease of the peak values of the number of open channels.
FIGURE 16.
Localization of release activity by slow buffer. Simulations with 
 and
and  and different amounts of added Ca2+: (top) 37 μM; (middle) 110 μM; and (bottom) 160 μM. The thick line shows the number of open channels at the focal site and the thin line the global number of open channels. All panels:


 without added Ca2+:
DISCUSSION
I investigated the impact of high slow buffer concentration on Ca2+ release activity. To that end, I extended a previously presented stochastic model for fast concentration dynamics by a two time scale analysis. The previous model (Falcke, 2003) represented all concentrations by single cluster profiles. Hence, in the case of large concentrations of fast, weakly localized buffers it could not be applied. The extension presented here not only allows for the inclusion of slow buffers but large concentrations of fast buffers with weakly localized concentration profiles too. It completes the superposition approach presented in Falcke et al. (2000) and Falcke (2003) in the sense that all buffer types can now be modeled in that frame work.
I presented a mechanism to generate oscillation-like behavior occurring under the conditions of low Ca2+ content of the ER, high cytosolic slow buffer concentration and high [IP3]. One cycle consists of strong release of Ca2+ from the ER, binding of Ca2+ to slow buffers, termination of Ca2+ release due to (partial) ER depletion, dissociation of Ca2+ from the slow buffer, and uptake by the ER. That mechanism needs slow buffer dynamics to allow for self amplification of Ca2+ release and slow dissociation of Ca2+ from the buffer. It needs high IP3 concentration to provide sufficient release from the ER. And finally, the amount of free buffer sites on slow buffers in the cytosol must be in the same range as the Ca2+ content of the ER or larger to be able to buffer the released Ca2+. These conditions can be perceived as a realization of the ideas underlying the two pool model (Goldbeter et al., 1990; Berridge, 1989) with the ER being one pool and the slow cytosolic buffer the other.
In principle, partial depletion of the ER and slow reuptake are needed for this type of oscillations. Slow reuptake is achieved in the model presented here by slow dissociation of Ca2+ from cytosolic buffers. It could be achieved by using slow reuptake of the ER only in the model too. That would imply that the cytosol experiences a high free Ca2+ concentration for most of the period which could be poisonous for the cell. However, combining slow reuptake and slow buffers should lead to similar results and prevent high cytosolic free Ca2+. The combination of high fast buffer concentration and slow uptake would suppress the Ca2+-mediated cooperativity and hence would not allow for sufficient release to drive the oscillations.
The second way slow buffers can induce oscillations is by reducing spatial coupling between clusters leading from a high activity state or short period oscillations to repetitive wave nucleation (Figs. 14 and 15). Wave nucleation is the cooperative action of several channel clusters to set off a wave traveling through the cell. That mechanism was investigated in detail (Falcke, 2003) but for fast buffers only. I showed with this study that slow buffers can turn short period oscillations into long period wave nucleation too. Higher concentrations of slow buffer were necessary in the simulations here than of fast buffer in the simulations in Falcke (2003) for comparable effects. We have chosen a quite small cluster spacing here (3.44 μm and 3.98 μm) and very high Ca2+ content of the ER to show that the mechanism works even with these unfavorable parameters. Larger cluster spacing and smaller lumenal total Ca2+ would decrease the buffer concentration necessary for repetitive nucleation.
The characteristic feature of repetitive nucleation is that it cannot be explained with time scales of the channel dynamics or buffer. It depends strongly on the spatial coupling characteristics because several clusters are involved in the formation of a supercritical nucleus. The dependence on spatial coupling leads to a decrease of the average nucleation frequency with increasing buffer concentration as shown in Figs. 14 and 15 for slow buffer and in Falcke (2003) for fast buffer. That theoretical result is supported by experimental findings. The decrease of wave frequency with increasing buffer concentration was observed in rat ventricular cardiac myocytes with EGTA as buffer (Lukyanenko and Györke, 1999), which is a slow buffer like I used in the simulation.
My findings bear some similarities and some differences to previous results concerning the effect of buffers on intracellular Ca2+ dynamics in deterministic, spatially homogeneous models reported in Wagner and Keizer (1994) and Sneyd et al. (1998). It was found that increasing buffer capacity slows down the time scale of the dynamics of free Ca2+, reduces spatial coupling by reducing the effective diffusion coefficient, can abolish wave propagation, and decreases oscillation amplitudes of free Ca2+. That agrees in general with my results. However, in our spatially discrete and stochastic model it was found that the period of oscillations increases with increasing buffer concentration starting from a short period state (Figs. 14 and 15). Coordinated global activity disappears for very high buffer concentration and only localized events remain (Figs. 14 and 15, C and D for both). Increasing buffer concentration from a comparable state in the buffered deterministic DeYoung-Keizer model leads to termination of oscillations (the right-hand side Hopf bifurcation shifts to lower IP3 values ((Wagner and Keizer, 1994), Fig. 6). These differences arise from the fact that the deterministic spatially homogeneous models can of course not reproduce nucleation events and fluctuation effects.
I demonstrated that release at focal sites can be isolated by slow buffers in the model, i.e., its coupling to neighboring sites can be suppressed. I used buffer concentrations and rate constants comparable to experimental values for that simulation. The amount of buffer needed to isolate the release at a focal site depends of course on the cluster density and the IP3 concentration. The IP3 concentration used in Fig. 16 was not maximal (the fraction of channels with IP3 bound at at least three subunits is ∼0.5), but simulations like those of Fig. 14 D, and Fig. 15, C and D, show that isolation can be achieved for high IP3 with higher buffer concentration too in the model.
Two time scale analysis
The terms of the local dynamics of slow buffers are assumed to be small compared to other reaction terms of the system. I assume that the slow dynamics cannot create steep gradients because they are smoothed out by diffusion. That leads to a  length scale for the slow buffers and a diffusion term of order ɛ. The complete system of PDEs for all variables reads:
 |
(12) |
 |
 |
 |
 |
 |
 |
 |
 |
 |
 |
 |
 |
The buffers included in the model are (in the Ca2+-bound form): bs cytosolic endogenous stationary buffer, bm cytosolic endogenous mobile buffer, bex cytosolic exogenous mobile buffer, bEm lumenal endogenous mobile buffer, bEs lumenal endogenous stationary buffer. Here I define
 |
(13) |
and the total Ca2+ concentration CT:
 |
(14) |
 |
(15) |
 |
 |
(16) |
I define the long space scale and slow time scale
 |
(17) |
 |
(18) |
 |
(19) |
Introducing these variables in the PDEs leads to:
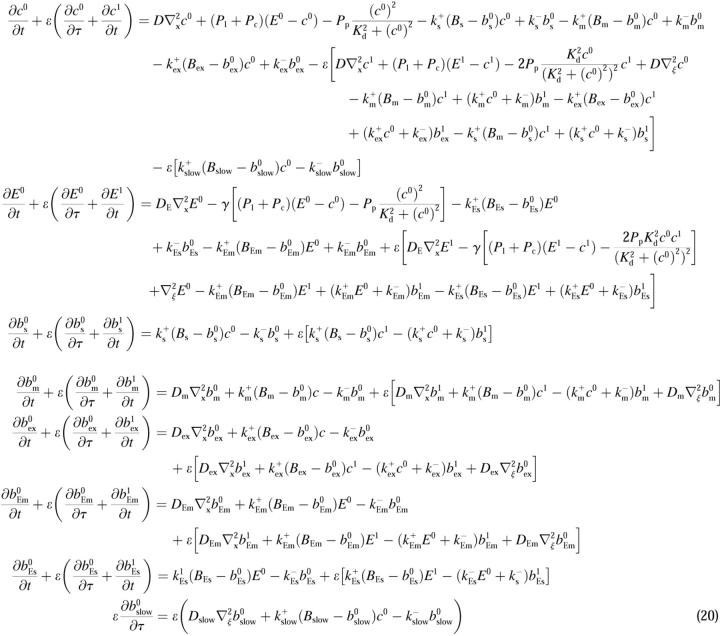 |
 |
(21) |
B 0th order
I assume that the concentration dynamics is faster than the channel dynamics i.e., that on the fast time scale the stationary solution is reached before the state of the cluster changes. The state of the clusters is given by No(t). In a large system, changes of No(t) would occur very rapidly because the time scale would be tsingle/N(tsingle being the time scale for the dynamics of a single cluster). However, because the concentration profiles are localized, I need to be concerned only with the number of clusters within the decay radius.
I solve for the dynamics on the fast time scale starting at Eq. 21:
 |
(22) |
 |
(23) |
Solving for the stationary solution of  uncouples that PDE from the others and leads to:
 |
The general solution of that equation in two spatial dimensions is constant1 + constant2 ln r (with r being the spatial coordinate). Because ln r does not match the boundary conditions (zero flux or periodic) I reach:
 |
I use A0 to replace E0
 |
(24) |
and solve for the stationary solution of the concentrations obeying:
 |
(25) |
 |
 |
 |
 |
 |
The value of A0 is determined by
 |
(26) |
 |
 |
The solution of that integral equation depends on the configuration of open channels No(t).
C 1st order
The terms of Eq. 21 depending on 0th order variables only can be used to obtain a PDE for the dependence of A0 on τ and ξ:
 |
(27) |
 can be rewritten like
 |
(28) |
That separates the part of CT depending on A0 from  leading to:
 |
(29) |
Note that  is positive definite for the buffer parameters I used, so that singularities do not occur. That equation must be solved along with the PDE for
  to determine the dependence on τ and ξ:
 |
(30) |
We can easily verify that the stationary solution  of Eq. 2 agrees with the exact stationary solution of Eq. 16, 30:
A0 depends on No(t). Furthermore, we can split A0 into a spatially constant part and a part depending on ξ by
 |
(31) |
 |
and obtain
 |
(32) |
The slow dynamics of  is:
is:
 |
(33) |
i.e., represents essentially the total binding and release of Ca2+ by the slow buffers. The fast dynamics is given by changes of No(t).
Wagner and Keizer (1994) develop the rapid buffer approximation (RBA) which assumes that the buffer diffusion of mobile buffers is negligible and the stationary buffer concentration of fast buffer is given by  That assumption leads to a discontinuity in the first order corrections to the concentrations if discrete source terms are used. If the RBA is applied, the system of diffusion equation for the concentrations is reduced to a single one for free Ca2+ with a nonlinear diffusion term. Because the source term of that equation has a discontinuity, so does the second spatial derivative. That discontinuity is transferred to the first order corrections in a multiple time scale analysis when the RBA is used. Hence, I did not neglect diffusion of fast buffers here.
I solved all partial differential equations by a multigrid method based on Press et al. (1992). I derived an integration scheme for the stochastic partial differential Eq. 30 according to Honerkamp (1990). I used a spatial discretization of 4 nm to compute single cluster profiles. The time step size in stochastic simulations was chosen so that the probability for a transition in a cluster was ∼1% and hence for all clusters within an interaction radius ∼7%. Because only about one quarter of the transitions changes the open state of channels, that yields ∼2% probability for a transition changing rates of other transitions per time step within the interaction radius. Test runs with one half of that time step and one quarter confirmed the choice. I used random number generators taken from Press et al. (1992). If the integration of Eq. 30 required smaller time steps than the stochastic simulation, the smaller step was used. That may occur if it is used to model fast, weakly localized buffers.
TABLE 1.
Parameters of the model Eq. 12
| Parameter | Value | Unit |
|---|---|---|
| Leak flux coefficient Pl | 0.0002 | s−1 |
| Channel flux coefficient Pc | 650 | s−1 |
Max. number of channels per cluster 
|
25 | |
| Number of additional clusters in focal site NF | 25 | |
| Cluster spacing outside focal sites d | 5.74 | μm |
| Single channel radius Rs | 0.092 | μm |
| Pump flux coefficient Pp | 45 | μM s−1 |
| Pump dissociation coefficient Kd | 0.2 | μM |
Volume ratio 
|
5.4 | |
| Diffusion coefficient D, DE of free Ca2+ | 223 | μm2 s−1 |
| Diffusion coefficient Dm of cytosolic endogenous mobile buffer | 11.26 | μm2 s−1 |
| Diffusion coefficient Dex of cytosolic exogenous buffer | 32.0 | μm2 s−1 |
| Diffusion coefficient Dex of cytosolic slow buffer | 30.0 | μm2 s−1 |
| Diffusion coefficient DEm for lumenal mobile buffer | 10 | μm2 s−1 |
On-rates of fast buffers: 
|
500 | (μM s)−1 |
On-rate of slow buffer: 
|
2 | (μM s)−1 |
Dissociation constants of buffers 
| ||
| Ks | 2 | μM |
| Km | 2 | μM |
| Kex | 0.247 | μM |
| KEs | 5 | μM |
| KEm | 5 | μM |
| Kslow | 0.15 | μM |
| Total concentrations of buffers: | ||
| Bs | 150 | μM |
| Bm | 50 | μM |
| Bex | 40 | μM |
| BEs | 200 | μM |
| BEm | 40 | μM |
| Bslow | 25 | μM |
| Total concentration of Ca2+C0 | 55 | μM |
| Channel subunit parameters (see kinetic scheme) | ||
| a5 | 2.22 | (μM s)−1 |
| b5 | 1.6 | s−1 |
| a6 | 0.2 | (μM s)−1 |
| b6 | 0.066 | s−1 |
| IP3 dissociation constant in subunit state X11 | 0.9434 | μM |
References
- Bär, M., M. Falcke, L. Tsimring, and H. Levine. 2000. Discrete stochastic modeling of calcium channel dynamics. Phys. Rev. Lett. 84:5664–5667. [DOI] [PubMed] [Google Scholar]
- Berridge, M. 1989. Cell signaling through cytoplasmic calcium oscillations. In Cell to Cell Signaling: From Experiments to Theoretical Models. A. Goldbeter, editor. Academic Press, London. 449–459.
- Berridge, M., M. Bootman, and P. Lipp. 1998. Calcium - a life and death signal. Nature. 395:645–648. [DOI] [PubMed] [Google Scholar]
- Bertram, R., G. Smith, and A. Sherman. 1999. Modeling study of the effects of overlapping Ca2+ microdomains on neurotransmitter release. Biophys. J. 76:735–750. [DOI] [PMC free article] [PubMed] [Google Scholar]
- Bootman, M., M. Berridge, and P. Lipp. 1997. Cooking with calcium: The recipes for composing global signals from elementary events. Cell. 91:367–373. [DOI] [PubMed] [Google Scholar]
- Callamaras, N., and I. Parker. 2000. Phasic characteristics of elementary Ca2+ release sites underlies quantal responses to IP3. EMBO J. 19:3608–3617. [DOI] [PMC free article] [PubMed] [Google Scholar]
- DeYoung, G., and J. Keizer. 1992. A single-pool inositol 1,4,5-trisphosphate-receptor-based model for agonist-stimulated oscillations in Ca2+ concentration. Proc. Natl. Acad. Sci. USA. 89:9895–9899. [DOI] [PMC free article] [PubMed] [Google Scholar]
- Falcke, M. 2003. On the role of stochastic channel behavior in intracellular Ca2+ dynamics. Biophys. J. 84:42–56. [DOI] [PMC free article] [PubMed] [Google Scholar]
- Falcke, M., L. Tsimring, and H. Levine. 2000. Stochastic spreading of intracellular Ca2+ release. Phys. Rev. E. 62:2636–2643. [DOI] [PubMed] [Google Scholar]
- Goldbeter, A., G. Dupont, and M. Berridge. 1990. Minimal model for signal induced Ca2+ oscillations and for their frequency encoding through protein phosphorylation. Proc. Natl. Acad. Sci. USA. 87:1461–1465. [DOI] [PMC free article] [PubMed] [Google Scholar]
- Gonzalez, A., W. Kirsch, N. Shirokova, G. Pizarro, I. Pessah, M. Stern, H. Cheng, and E. Rios. 2000. Involvement of multiple intracellular release channels in calcium sparks of skeletal muscle. Proc. Natl. Acad. Sci. USA. 97:4380–4385. [DOI] [PMC free article] [PubMed] [Google Scholar]
- Honerkamp, J. 1990. Stochastische Dynamische Systeme, VCH Verlagsgesellschaft mbH,6940 Weinheim, Germany.
- Keener, J., and J. Sneyd. 1998. Mathematical Physiology, Springer, New York.
- Keizer, J., and G. Smith. 1998. Spark-to-wave transition: saltatory transmission of calcium waves in cardiac myocytes. Biophys. Chem. 72:87–100. [DOI] [PubMed] [Google Scholar]
- Kummer, U., L. Olsen, C. Dixon, A. Green, E. Bornberg-Bauer, and G. Baier. 2000. Switching from simple to complex oscillations in calcium signaling. Biophys. J. 79:1188–1195. [DOI] [PMC free article] [PubMed] [Google Scholar]
- Lechleiter, J., S. Girard, E. Peralta, and D. Clapham. 1991. Spiral calcium wave propagation and annihilation in Xenopus laevis oocytes. Science. 252:123–126. [DOI] [PubMed] [Google Scholar]
- Lukyanenko, V., and S. Györke. 1999. Ca2+ sparks and Ca2+ waves in saponin-permeabilized rat ventricular myocytes. J. Physiol. 521:575–585. [DOI] [PMC free article] [PubMed] [Google Scholar]
- Mak, D., and J. Foskett. 1998. Effects of divalent cations on single-channel conduction properties of Xenopus IP3 receptor, Am. J. Physiol. 275:C179–C188. [DOI] [PubMed] [Google Scholar]
- Mak, D., S. McBride, V. Raghuram, Y. Yue, S. Joseph, and J. Foskett. 2000. Single-channel properties in endoplasmic reticulum membrane of recombinant type 3 inositol trisphosphate receptor. J. Gen. Physiol. 115:241–255. [DOI] [PMC free article] [PubMed] [Google Scholar]
- Marchant, J., and I. Parker. 2001. Role of elementary Ca2+ puffs in generating repetitive Ca2+ oscillations. EMBO J. 20:65–76. [DOI] [PMC free article] [PubMed] [Google Scholar]
- Marchant, J., N. Callamaras, and I. Parker. 1999. Initiation of IP3-mediated Ca2+ waves in Xenopus oocytes. EMBO J. 18:5285–5299. [DOI] [PMC free article] [PubMed] [Google Scholar]
- Mitkov, I., K. Kladko, and J. Pearson. 1998. Tunable pinning of burst waves in extended systems with discrete sources. Phys. Rev. Lett. 81:5453–5456. [Google Scholar]
- Naraghi, M., and E. Neher. 1997. Linearized buffered Ca2+ diffusion in microdomains and its implications for calculation of [Ca2+] at the mouth of a calcium channel. J. Neurosci. 17:6961–6973. [DOI] [PMC free article] [PubMed] [Google Scholar]
- Neher, E. 1998. Usefulness and limitations of linear approximations to the understanding of Ca2+ signals. Cell Calcium. 24:345–357. [DOI] [PubMed] [Google Scholar]
- Pape, P., D. Jong, and W. Chandler. 1995. Calcium release and its voltage dependence in frog cut muscle fibers equilibrated with 20 mM EGTA. J. Gen. Physiol. 106:259–336. [DOI] [PMC free article] [PubMed] [Google Scholar]
- Parker, I., and Y. Yao. 1991. Regenerative release of calcium from functionally discrete subcellular stores by inositol trisphosphate. Proc. R. Soc. Lond. B Biol. Sci. 246:269–274. [DOI] [PubMed] [Google Scholar]
- Patel, S., S. Joseph, and A. Thomas. 1999. Molecular properties of inositol 1,4,5-trisphosphate receptors. Cell Calcium. 25:247–264. [DOI] [PubMed] [Google Scholar]
- Pearson, J., and S. Ponce-Dawson. 1998. Crisis on skid row. Physica A. 257:141–148. [Google Scholar]
- Press. W., S. Teukolsky, W. Vetterling, and B. Flannery. 1992. Numerical recipes in C. 2nd ed, Cambridge University Press, Cambridge.
- Rios, E., M. Stern, A. Gonzalez, and G. Pizarro. 1999. Calcium release flux underlying Ca2+ sparks of frog skeletal muscle. J. Gen. Physiol. 114:31–48. [DOI] [PMC free article] [PubMed] [Google Scholar]
- Roberts, W. 1994. Localization of calcium signals by a mobile calcium buffer in frog saccular hair cells. J. Neurosci. 14:3246–3262. [DOI] [PMC free article] [PubMed] [Google Scholar]
- Schuster, S., M. Mahrl, and T. Höfer. 2001. Modelling of simple and complex calcium oscillations. Eur. J. Biochem. 269:1333–1355. [DOI] [PubMed] [Google Scholar]
- Shuai, J., and P. Jung. 2002. Optimal intracellular calcium signalling. Phys. Rev. Lett. 88:U252–U255. [DOI] [PubMed] [Google Scholar]
- Smith, G. 1996. Analytical steady-state solution to the rapid buffer approximation near an open Ca2+ channel. Biophys. J. 71:3064–3072. [DOI] [PMC free article] [PubMed] [Google Scholar]
- Smith, G., L. Dai, R. Miura, and A. Sherman. 2001. Asymptotic analysis of buffered calcium diffusion near a point source. SIAM J. Appl. Math. 61:1816–1838. [Google Scholar]
- Smith, G., J. Keizer, M. Stern, W. Lederer, and H. Cheng. 1998. A simple numerical model of calcium spark formation and detection in cardiac myocytes. Biophys. J. 75:15–32. [DOI] [PMC free article] [PubMed] [Google Scholar]
- Smith, G., J. Wagner, and J. Keizer. 1996. Validity of the rapid buffer approximation near a point source of calcium ions. Biophys. J. 70:2527–2539. [DOI] [PMC free article] [PubMed] [Google Scholar]
- Sneyd, J., P. Dale, and A. Duffy. 1998. Traveling waves in buffered systems: applications to calcium waves. SIAM J. on Applied Mathematics. 58:1178–1192. [Google Scholar]
- Stern, M. 1992. Buffering of calcium in the vicinity of a channel pore. Cell Calcium. 13:183–192. [DOI] [PubMed] [Google Scholar]
- Sun, X.-P., N. Callamaras, J. Marchant, and I. Parker. 1998. A continuum of insp3-mediated elementary Ca2+ signalling events in Xenopus oocytes. J. Physiol. (Lond.). 509:67–80. [DOI] [PMC free article] [PubMed] [Google Scholar]
- Swillens, S., P. Champeil, L. Combettes, and G. Dupont. 1998. Stochastic simulation of a single inositol 1,4,5-trisphoasphate-sensitive Ca2+ channel reveals repetitive openings during blip-like Ca2+ transients. Cell Calcium. 23:291–302. [DOI] [PubMed] [Google Scholar]
- Swillens, S., G. Dupont, and P. Champeil. 1999. From calcium blips to calcium puffs: Theoretical analysis of the requirements for interchannel communication. Proc. Natl. Acad. Sci. USA. 96:13750–13755. [DOI] [PMC free article] [PubMed] [Google Scholar]
- Tang, Y., and H. Othmer. 1996. Simplification and analysis of models of calcium dynamics based on IP3-sensitive calcium channel kinetics. Biophys. J. 70:246–263. [DOI] [PMC free article] [PubMed] [Google Scholar]
- Taylor, C. 1998. Inositol trisphosphate receptors: Ca2+-modulatd intracellular Ca2+ channels. Biochim. Biophys. Acta. 1436:19–33. [DOI] [PubMed] [Google Scholar]
- Thomas, D., P. Lipp, M. Berridge, and M. Bootman. 1998. Hormone-stimulated elementary Ca2+ signals are not stereotypic, but reflect activation of different size channel clusters and variable recruitment of channels within a cluster. J. Biol. Chem. 273:27130–27136. [DOI] [PubMed] [Google Scholar]
- Thomas, D., P. Lipp, S. Tovey, M. Berridge, W. Li, R. Tsien, and M. Bootman. 1999. Microscopic properties of elementary Ca2+ release sites in non-excitable cells. Curr. Biol. 10:8–15. [DOI] [PubMed] [Google Scholar]
- Toescu, E. 1995. Temporal and spatial heterogeneities of Ca2+ signaling: mechanisms and physiological roles. Am. J. Physiol. 269:G173–G185. [DOI] [PubMed] [Google Scholar]
- Tsien, R. 1980. New Ca2+ indicators and buffers with high selectivity against magnesium and protons: design, synthesis, and properties of prototype structures. Biochemistry. 19:2396–2404. [DOI] [PubMed] [Google Scholar]
- Tsien, R., and R. Tsien. 1990. Calcium channels stores and oscillations. Annu. Rev. Cell Biol. 6:715–760. [DOI] [PubMed] [Google Scholar]
- Wagner, J., and J. Keizer. 1994. Effects of rapid buffers on Ca2+ oscillations and Ca2+ diffusion. Biophys. J. 67:447–456. [DOI] [PMC free article] [PubMed] [Google Scholar]
- Wagner, J., Y.-X. Li, J. Pearson, and J. Keizer. 1998. Simulation of the fertilization Ca2+ wave in Xenopus laevis eggs. Biophys. J. 75:2088–2097. [DOI] [PMC free article] [PubMed] [Google Scholar]


