

Abstract
Based on molecular dynamics simulations, an analysis of structure and dynamics is performed on interfacial water at a liquid crystalline dipalmitoylphosphatidycholine/water system. Water properties relevant for understanding NMR relaxation are emphasized. The first and second rank orientational order parameters of the water O–H bonds were calculated, where the second rank order parameter is in agreement with experimental determined quadrupolar splittings. Also, two different interfacial water regions (bound water regions) are revealed with respect to different signs of the second rank order parameter. The water reorientation correlation function reveals a mixture of fast and slow decaying parts. The fast (ps) part of the correlation function is due to local anisotropic water reorientation whereas the much slower part is due to more complicated processes including lateral diffusion along the interface and chemical exchange between free and bound water molecules. The 100-ns-long molecular dynamics simulation at constant pressure (1 atm) and at a temperature of 50°C of 64 lipid molecules and 64 × 23 water molecules lack a slow water reorientation correlation component in the ns time scale. The 2H2O powder spectrum of the dipalmitoylphosphatidycholine/water system is narrow and consequently, the NMR relaxation time T2 is too short compared to experimental results.
INTRODUCTION
Heavy water NMR relaxation measurements of lipid bilayer systems monitor the physical properties of the lipid hydration shell. It has been shown that these measurements are indicative to the phase of dipalmitoylphosphatidycholine (DPPC)/water systems. The DPPC molecule is displayed in Fig. 1 together with an illustrative molecule configuration taken from the molecular dynamics (MD) simulation. Recorded NMR powder spectra of the gel phase Lβ′, the intermediate rippled phase Pβ′, and the liquid crystalline phase Lα, display different quadrupole splitting and lineshape broadening (Ulmius et al., 1977). Despite the many advantages with heavy water NMR, almost all NMR studies of the interface have been performed by probing structure and dynamics of the phosphorus of the polar headgroup by 31P-NMR or 2H-NMR of the lipid tail (Arnold et al., 1981; Mayer et al., 1990; Bechinger and Seelig, 1991; Dufourc et al., 1992). Previous work have only analyzed quadrupole splittings or the fast dynamics by spin-lattice relaxation measurements (Volke et al., 1994). However, the information content in NMR experiments is much richer and has the potential to characterize interfacial water in much more detail. The gel to liquid crystalline phase transition Lβ′ → Pβ′ → Lα of DPPC and DMPC (dimyristoylphosphatidylcholine) is particularly interesting from the water point of view. Lipid hydration is of great importance in studies of the phase behavior of different lipid/water systems and not least in studies of the repulsive hydration forces between lipid bilayers (LeNeveu et al., 1976; Gawrisch et al., 1992). However, to accomplish such an advanced program one must first develop a water 2H-NMR model which is sensitive enough to probe the changes of water properties at the lipid–water interface. With the guidance of a MD simulation we believe that an adequate NMR model may be developed.
FIGURE 1.

The Lewis structure of the DPPC molecule together with a snapshot from the MD simulation lipid. The arrow points at the middle carbon atom (the reference atom in the z-direction) of the glycerol backbone.
Lipid bilayers have been studied using spectroscopy and atomic scale simulations by several research groups during the last decade. Infrared spectroscopy was used to monitor water penetration of lipid bilayers (Casal, 1989) and MD simulation technique to characterize lipid/water model systems structurally (Alper et al., 1993; Marrink et al., 1993; Pasenkiewicz-Gierula et al., 1997). Monte Carlo simulation methods have also been used to characterize lipid bilayer systems (Jedlovszky and Mezei, 2001). The present analysis is based on a 100-ns-long MD simulation of a DPPC bilayer consisting of 64 lipids with the hydration of 23 waters per lipid. The MD simulation was performed at constant pressure of 1 atm in all directions and at the temperature of 50°C (Lindahl and Edholm, 2001). The simulation reproduces the dynamics and order in the hydrocarbon region of the bilayer. The same setup and force field have been used in other simulations (Lindahl and Edholm, 2000a,b; Marrink et al., 2001) and gives good agreement with most experiments. The force field is based on the bilayer simulations of the Berendsen group; see review by Tieleman et al., (1997), with slight modifications (Berger et al., 1997).
The analysis in this work is carried out along a somewhat new philosophy. We focus on the dynamic and static properties of the interfacial water that are important for developing a model to interpret 2H2O-NMR relaxation data. That is, the aim is to learn about structural and dynamic properties of interfacial water which are relevant from the NMR perspective. Particular emphasis is placed on a comparison between the MD model and the central ideas of a simple NMR relaxation model recently used (Westlund, 2000b) in a reinterpretation of the heavy water powder spectra of DPPC bilayer (Ulmius et al., 1977). Inasmuch as MD simulations give a detailed molecular picture it is sometimes possible to specify the molecular details which are consistent with ideas of NMR relaxation model. In brief, this simple relaxation model interprets the NMR spectra of Lβ′ and Lα phases in terms of four microscopic parameters: a reorientation correlation time of bound water (τb); a lateral diffusion time (τc) characterizing the translational motion of water in the lipid interface; and two order parameters  and
and  . The local water order parameter
  refers to a partially averaged field gradient due to anisotropic water reorientation at the bound site of the lipid water interface. And the second order parameter
  characterizes a static property of water at the interface. The product is related to the quadrupole splitting of the heavy water NMR spectrum. The superscripts dp and Dd refer to the principal frame (p) of the electric field gradient of 2H2O which is along the oxygen–hydrogen bond; the local director (d) which characterizes the water hydration sites at the choline group or at the phosphate oxygen; and finally the director (D) or the normal of the lipid/water interface. This simple relaxation model is based on a more than 20-years-old idea of time scale separation between local water reorientation and lateral diffusion resulting in a partially averaged quadrupole interaction. This model was developed by Wennerström and co-workers in the context of counterion quadrupole NMR in phospholipid/water systems (Wennerström et al., 1979).
NMR spectroscopy indicates that there is a considerable increase in lipid hydration upon passing from the gel to the liquid crystalline phase (Faure et al., 1997). An ordering of water molecules at the interface gives rise to a small nonzero order parameter that may be extracted from the observable quadrupole splitting (Finer and Darke, 1974; Arnold et al., 1983). Other techniques such as Fourier transform infrared spectroscopy (Pohle et al., 1997, 1998) also give information about the hydration of the carbonyl group. Recently, it has also been demonstrated that both the partial molar enthalpy and the chemical potential of the water may be determined (Markova et al., 2000) by water dynamics sorption microcalorimetry.
The ordering of the interfacial water reflects the structure of the lipids because the water reorientation correlation times are much shorter than the corresponding correlation times of the lipid headgroup. The perturbation of water due to the interaction with the lipid headgroups is thus expected to show up in a quadrupole splitting of the NMR spectrum and in a increase of NMR relaxation rates. The latter should be seen in a slower decay of the water reorientation correlation function compared to bulk water. The hydration of a bilayer interface formed by a detergent molecule is different from that of phospholipid bilayers. In a recent heavy water NMR relaxation study, a much shorter lateral diffusion correlation time of τc for water was obtained in the water/DDAO (dodecyldimethylamineoxide) interface than for the water/DPPC interface. This effect of hydration is directly observable in the heavy water powder spectrum of the DDAO system as a dip at the magic angle which is absent for the water/DPPC system (Sparrman and Westlund, 2001).
STRUCTURE AND DYNAMICS OF THE WATER AT THE LIPID INTERFACE
The Cartesian axes parallel to the lipid bilayer are called the x-y-coordinates and the average values of the simulation box size along these axes are 4.1 and 4.7 nm. For the Cartesian axis perpendicular to the lipid bilayer (z-axis), the average box size is 6.4 nm. Fig. 2 displays the relative water density as a function of the z-coordinate. Note that the origin of the z-scale has been chosen at the average z-position of the central carbon atom of the lipid glycerol backbone (see the DPPC molecule in Fig. 1). The hydrated lipid interface is quite thick, as is shown by the water density profile, which is well described by a sigmoid function
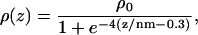 |
(1) |
where ρ0 is the bulk water density. The mean distance from the origin of the z-axis to the center of the bilayer is 1.74 nm. Water penetrates down to the carbonyl groups, which are on average residing at negative z-coordinates. Our results are consistent with other reports indicating that the carbonyl groups are hydrated by one water molecule each (Marrink and Berendsen, 1994; Pasenkiewicz-Gierula et al., 1997; Berger et al., 1997; Jedlovszky and Mezei, 2001).
FIGURE 2.

The water density relative to bulk water (the maximum density in the simulation box) as a function of the z-coordinate. The value z = 0 nm is the average z-position of the middle carbon of the glycerol backbone, defined in Fig. 1. This means that we have the center of the membrane at z = −1.74 nm. The water density profile is only shown up to z = 1.3 nm.
The water order parameters
Important structural properties of the interfacial water may be expressed in terms of orientational order parameters. These order parameters are defined as an ensemble average of Wigner rotation matrix elements (Brink and Satchler, 1993), which are functions of the Euler angles ΩDp ≡ (αD→p, βD→p, γD→p) that specify the orientation of the principal frame (p), which is the water O→H vector, relative to the director frame (D), which is the z-axis (approximately the interface normal). An alternative more suitable for dielectric relaxation studies is to consider the orientation of the water dipole relative to the interface normal.
Consider first the rank one orientational order parameters. The results from the simulations show that only one of the order parameters is nonzero, namely 〈cos(βDp)〉. That is,  for m = −1, 1, which is reasonable for symmetry reasons. Fig. 3 displays the nonzero first rank water order parameter
  as a function of the z-distance from the lipid interface. The order parameter values have been calculated as averages over time and over all water molecules, with their oxygen atom within successive 0.01-nm thick layers, and plotted versus the z-axis position. Inside the hydrophobic region of the membrane the order parameters becomes noisy because of a very small water concentration. The cumulative water order parameter, defined as the average order parameter over a successively increasing number of slabs, is displayed as a full line in Fig. 3. This cumulative order parameter reaches asymptotically the characteristic average order parameter of a lipid bilayer interface which may be extracted from NMR experiments. Similar profiles have been reported by Jedlovszky and Mezei (2001) and Alper and co-workers (Alper et al., 1993), but for the water dipole vector.
FIGURE 3.

The rank 1 water (O–H) order parameter in the interfacial region. The solid line indicates the cumulative rank 1 order parameter, where zO is a dummy variable that describes the z-coordinate of the water oxygen atom. We only show the rank 1 order parameter up to z = 1.3 nm.
The second rank order parameters are more interesting from the NMR point of view and are defined in analogy with the rank one parameters as  . This structural characterization of the water interface is directly related to the quadrupole splitting in the heavy water NMR-spectrum. In the secular approximation the observed quadrupole splittings of the 2H2O-water NMR spectrum is proportional to the order parameter
  , which has been calculated in slabs at different distances z in the same way as described above for the first rank order parameter. Only
  is nonzero, i.e.,
 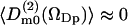 for m = ±1, ±2, which again is expected for symmetry reasons. Fig. 4 displays
  as a function of z, together with the cumulative order parameter (by analogy with the rank one cumulative order parameter). Notice that there are two regions with different sign of
  . This result has not, to the best of our knowledge, been reported before. It has, however, been suggested that the order parameters of water molecules in micro-heterogeneous systems may differ in sign (Halle and Wennerström, 1981; Arnold et al., 1983). From the 2H2O-NMR point of view we think it is important to identify these two interfacial regions thus based on the sign of the water orientational order parameter
  . We denote the regions with negative and positive order parameters,
  and
and  , respectively, whereas the region with unperturbed free water is denoted F. Before we continue, let us shortly comment on our usage of the terms “perturbed water” and “bound water” that are commonly used in NMR contexts. In this article, perturbed water refers to water molecules characterized by a nonzero orientational order parameter (see Fig. 4). This definition almost coincides with a definition based on the water density (see Fig. 2). That is, one could define perturbed water as water residing in the interface with a water density less than the bulk density. In NMR relaxation models, bound water is perturbed water in some respect; for instance, a nonzero quadrupole splitting, or/and the much longer correlation times of the stochastic time-dependent quadrupole interaction. Another important concept is the hydration shell. It refers to the radial distribution function g(r) and is thus not directly characterizing the hydrated lipid interface but rather the water structure around a selected atom: O, P, or N (see later section, The Hydration Sphere of the Phosphate Group and its Order Parameters).
FIGURE 4.

The rank 2 water (O–H) order parameter in the interfacial region. The solid line indicate the cumulative rank 2 order parameter, where zO is a dummy variable that describe the z-coordinate of the water oxygen atom.
According to Fig. 4, the  region is located between z-coordinates −0.9 and 0.4 nm (with z = 0 at the glycerol backbone; see Fig. 1), whereas the
  region is located further out from the lipid core, between 0.4 and 1.1 nm. From Fig. 2 we may notice that the
  region has a relative water density that is less than ∼0.6 and that the free water region starts first at a relative water density of 0.98. The fraction of water in the
  region is
  , which corresponds to six water molecules per lipid, whereas the water molecule fraction with positive order parameter is more than twice as large,
  , corresponding to 11 water molecules per lipid. The average order parameters determined for these two regions separately are
  and
and  . Then the total fraction of perturbed water molecules is
  , which corresponds to 17 water molecules out of 23 per lipid. A quadrupole splitting that one would expect to observe in a heavy water NMR spectra can then be calculated as a weighted sum
  which becomes
  . This value is the same, within the statistical error, as the value
  that we obtained from the cumulative order parameter in Fig. 4. The latter value of
  corresponds to a quadrupolar splitting of a heavy water powder spectrum of
  Hz, using the quadrupolar coupling constant of water χ = 220 kHz (see Appendix) and the relation
 |
(2) |
This value of the water quadrupole splitting is in excellent agreement with experimental values (Ulmius et al., 1977; Arnold et al., 1983; Gawrisch et al., 1992), thus indicating that the MD simulation model gives an excellent static description of the interfacial water.
Notice also that Eq. 2 is quite sensitive for changes in the relative size of the two fractions  and
and  of perturbed water. A small decrease in the fraction of water with positive order parameter results in an increase in the water quadrupole splitting, because the total order parameter is negative. A small structural change of the lipid interface is thus transferred into changes in the hydration population
  and
and  which show up in a change in the quadrupole splitting of the 2H2O-NMR spectrum.
If a nonzero order parameter  is taken as the criterion of water molecules being perturbed or bound, we obtain the fraction of bound water as PB = 0.725 and an approximate number of 17 perturbed water molecules per lipid molecule. In an early NMR article, Finer and Darke (1974) distinguished two types of bound water for lecithin. Firstly, an inner hydration shell (
 , or 1 out of 23 water molecules per lipid) which was characterized by a quadrupole splitting of ΔνQ = 6.9 kHz (according to Eq. 2 it corresponds to an order parameter
  ). The second type of bound water molecules, referred to as the main hydration shell (
 , or 11 out of 23), is characterized by a much smaller quadrupole splitting, ΔνQ = 0.37 kHz (Finer and Darke, 1974). The trapped water, characterized by ΔνQ = 0 kHz, is thus a comparably larger fraction (11 out of 23) than our fraction of free water molecules (PF = 0.275). In some other articles (Arnold et al., 1983) it is claimed that the first five water molecules added to the DPPC bilayer have a quadrupole splitting of ∼1.2 kHz and form an inner hydration shell. Additional water have a significant lower quadrupole splitting whereas Borle and Seelig (1983) suggested a lipid hydration number of 10–11. Notice that one cannot determine the lipid hydration shell from NMR experimental work inasmuch as the g(r) of any atom is not determined. In this context, the concept hydration shell used by Finer and Dark is referring to what we denote perturbed or bound water.
Alper and co-workers (Alper et al., 1993) found in an MD simulation of a monolayer that the average number of coordinated waters was 17 for the choline group and ∼5.5 for the phosphate group. These results support the view that 17–23 water molecules form the hydration shell of the PC headgroup and that the perturbed water of the interface is quite extended in thickness (Alper et al., 1993). It is not simple to relate the calculated water order parameter profile to phosphate or choline hydration. An analysis of the distribution of the phosphate and choline groups in different slabs is rather broad. This is partly a consequence of the headgroup dipole lying rather flat down in the membrane interface. This means that the hydration of the choline groups and phosphate groups of different lipids contribute to same slab of water order parameter. In a later section, The Hydration Sphere of the Phosphate Group and its Order Parameters, we present an analysis of the water order parameter focusing on hydration of the phosphate group.
Water dynamics and chemical exchange
The reorientation dynamics of water is complicated and composed of fast local reorientation and slower reorientation that is coupled to translational diffusion. The reorientation of lipids and water molecules has not been analyzed in detail in previous MD simulation studies. The reason for this is probably that the relation between the reorientation correlation functions of the MD simulation and spectroscopically measurable quantities is not straightforward. In this section we present an approach to this problem and how to relate NMR relaxation times to reorientation correlation functions obtained from MD simulation models. In a recent article, we calculated the ESR spectra of a nitroxide spin-probe residing in a bilayer using this model. In that study the order parameter of a 6-PC spin probe was well described but it was also noticed that the reorientation motion of the MD simulation seems to be too fast. The ESR spectra turned out to be in the motional narrowing regime, whereas one would expect from experimental studies a slow motion spectra (Håkansson et al., 2001). The translational diffusion coefficients calculated from mean square displacements or velocity autocorrelation functions are reasonably well described. For a corresponding analysis of lipids dynamics, see Lindahl and Edholm (2001).
Water trajectories
The three-dimensional translational motion of water at the lipid interface is highly anisotropic because of the interaction with lipid headgroups. It is convenient, for the development of NMR relaxation models, to distinguish between the in-and-out motion (in the z-direction) and the lateral or parallel-to-the-lipid-interface motion (in the x-y plane). The translation is coupled to rotation and it is not obvious that there is a time-scale separation that makes a decoupling possible. However, the interpretation of NMR relaxation is usually performed in terms of simple models with lateral diffusion in the parallel direction and a chemical exchange model describing the perpendicular motion. We illustrate this decomposition of the motion for two different water trajectories.
Fig. 5 A displays the z-coordinate of a water molecule starting at a distance from the interface which is characteristic for a positive order parameter  . The dotted lines at z = 0.4 nm and z = 1.1 nm in Fig. 5 A indicate the borders between the
  regions and between bound and free water. The motion of the water molecule in the membrane plane is displayed in Fig. 5 B. In this trajectory the water molecule spends ∼80 ps inside an area corresponding to the area per lipid headgroup, which is ∼0.62 nm2 in this simulation and is also found from x-ray studies (Nagle, 1993; Nagle et al., 1996). During a time interval of ∼440 ps, this water molecule visited the unperturbed region once and turned back to the region from which it started. After ∼300 ps this water molecule has moved laterally over a distance corresponding to ∼2–3 lipid molecules. This indicates that lateral motion along the membrane interface is correlated to the perpendicular (in-and-out) motions.
FIGURE 5.

(A) z-coordinate of a water molecule with initial z = 0.481 nm vs. time during 440 ps of the simulation. (B) The projection of the trajectory of the water molecule in the membrane (x-y) plane. The arrow indicates 420 ps.
Fig. 6 A displays the z-coordinate of another type of water molecule starting in the  region. In Fig. 6 B the x-y trajectory is displayed. Water molecules in the
  region remain at the same depth in the interface considerably longer; in this case, actually as long as ∼1 ns, which illustrates the qualitative differences between water molecules at different depths of the hydrated lipid interface.
FIGURE 6.
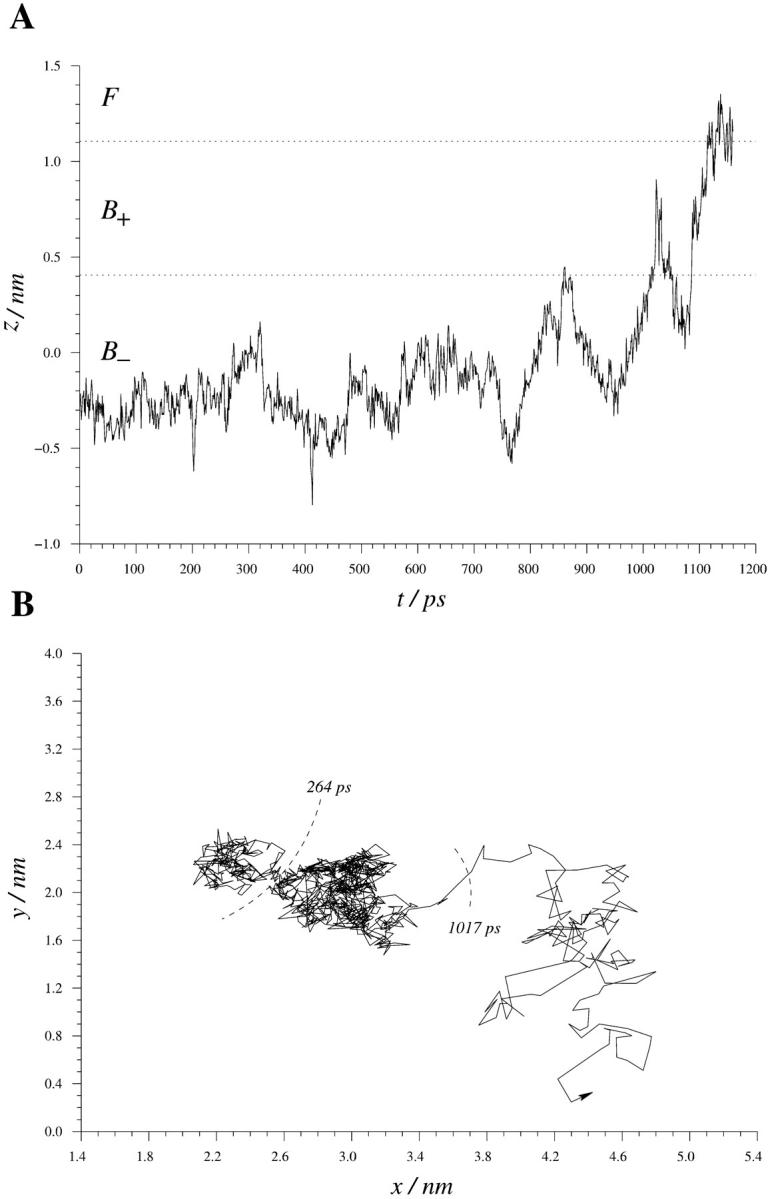
(A) z-coordinate of a water molecule with initial z = −0.282 nm vs. time during 1160 ps of the simulation. (B) The projection of the trajectory of the water molecule in the membrane (x-y) plane. The arrow indicates 1160 ps.
These two examples are typical and suggest a fast local reorientation when the water molecule changes hydration site at the same DPPC molecule. The lateral motion, when water molecules move between different lipid molecules, is slower and accompanied with a vertical or chemical-exchange-like motion.
Let us for a moment anticipate the discussion about a simple two-site NMR model (Westlund, 2000b) and confront this picture of interfacial water with the NMR model. In the simple two-site NMR model the local reorientation of interfacial water includes all processes that modulate the quadrupolar interaction in a time scale of a couple of ps. This anisotropic water motion is mainly a local reorientation at one hydration site, but it also includes water reorientation, because water molecules visit different hydration sites at the same DPPC molecule. Finally, water diffusion perpendicular to the bilayer also introduces fast water reorientation. Eventually, a fast reorientation of the polar headgroup also must be included in the set of motions causing this local partial average quadrupole interaction. Consequently, a fairly complicated and composed process is responsible for the water reorientation that results in the fast decay of the quadrupolar interaction correlation function and to the partial average water order parameter  (compare with a later section, The Water Reorientation Correlation Functions and the Local Order Parameter
  ).
).
Lateral water diffusion
A self-diffusion coefficient can be extracted from a plot of the mean square displacement versus time. At long times this becomes linear and the diffusion coefficient is proportional to the slope. The translation of water is affected by the water/lipid interactions, and the water translation is made relative to the simulation box, so no correction due to bilayer motions is done. Fig. 7 A displays the mean square displacement 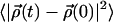 of water in the x-y plane (membrane plane) versus time for water residing in the free and two bound regions of the interface: F, B+, and B−. A comparison between free F water, which is residing at a distance larger than 1.1 nm from the glycerol backbone, and bound water, shows that the motion is more restricted close to the membrane interface. The self-diffusion coefficient of F water was estimated to 6 × 10⁻⁹ m2/s from the linear part of Fig. 7 A. This value do not differ dramatically from other MD simulations (Raghavan et al., 1992; Alper et al., 1993). It is also comparable with the experimental value of 3.6 × 10⁻⁹ m2/s, found by Mills (1973). Wassall (1996) found that the average water diffusion is approximately a factor -10 smaller in a phospholipid system than in bulk water. From Fig. 7 A, it is seen that interfacial water diffuses more slowly in the x-y plane than bulk water. It is expected that the water diffusion coefficient of bound water is lower then for free water. This is because the diffusion coefficient for the lipids are much smaller then the bulk water diffusion coefficient (Vaz and Almeida, 1991). It is seen in Fig. 7 A that it takes at most 200 ps to reach times such that the mean square displacement is linear in time.
FIGURE 7.

(A) The mean square displacement in the membrane (x-y) plane of the water molecules versus time in the three regions F,  , and
, and  . (B) The normalized distribution of the lifetime of water molecules in each of the regions.
Chemical exchange
Chemical exchange is a simple dynamic model often used in NMR theory to describe translation between two or more different chemical environments. In the case of two sites, A and B, the model can be described by the mean residence times in the two states, τA and τB. They are related to the population fractions PA and PB through the relations 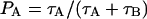 and
and 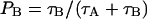 . This model is easy to include into the equation of motion for the spin density operator. We choose to study the mean lifetimes of water in three regions using a 0.2-nm thick buffer zone at the boundaries between the regions. A water molecule must leave this buffer zone before it is counted as having entered the new region. This way of counting removes some of the events when water molecules leave a region and then return to the original region within too short a time. We counted the number of water molecules and their residence time in the three regions and divided the total time with the number of molecules in each region to obtain an average residence time. The water residence times calculated in this way for the three regions F, B+, and B− were ∼20, 30, and 60 ps, respectively. These rather short residence times are consistent with the probability distribution of the lifetimes that are displayed in Fig. 7 B. The distribution functions are similar in shape with the main difference being in the small fraction of molecules with long residence times. The distributions for B− and B+ water have their peaks shifted slightly toward longer times and do fall off faster compared to the distribution of the free water. These findings are in agreement with reported residence times of less than 20 ps (Alper et al., 1993).
The water trajectories suggest a three-site chemical exchange model, where the mean lifetimes in each site are determined above and the population fractions where determined in a previous section, The Water Order Parameters. On the NMR time scale all exchange rates are in the fast exchange regime. The chemical exchange model becomes:
 |
(3) |
where all three sites exchange.
The water reorientation correlation functions and the local order parameter Smdp
The water reorientation correlation functions, Cn(t), are of fundamental importance in NMR relaxation theory for oriented systems. They are defined in terms of second rank Wigner rotation matrix elements,
 |
(4) |
where the Euler angles  describe the orientation of the principal frame of the quadrupolar interaction (p), i.e., along the O–2H bond, relative to the director of the bilayer (D).
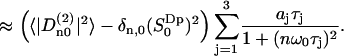
Fig. 8 displays, for 200 ps, the average correlation function  because the respective Cn(t) are very much the same. Also ln(Cn(t)) are displayed, but only for n = 0, 1, and 2, inasmuch as Cn(t) = C|n|(t). The initial values of the correlation functions are close to Cn(0)=1/5 and the long time limit, Cn(∞), yields the square of the order parameter,
  . After subtracting the order parameter squared, the remaining part of the correlation functions, ΔCn(t), decays to zero and can be fitted to a sum of exponentials. Within the statistical uncertainty, three exponents can be identified:
 |
(5) |
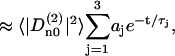 |
where 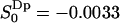 and the constants aj are normalized to give
  . The weight parameters aj and correlation times τj obtained from the fitting procedure are listed in Table 1. The apparent integral correlation time τtot is found from
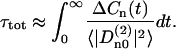 |
(6) |
FIGURE 8.

Time autocorrelation functions for water in the simulation box, independent of position.  ps (see Table 1).
TABLE 1.
EFG correlation functions parameters including standard deviations
| Parameters | n = 0 | n = 1 | n = 2 |
|---|---|---|---|
| a1 | 0.746 ± 0.005 | 0.704 ± 0.004 | 0.724 ± 0.004 |
| a2 | 0.221 ± 0.004 | 0.242 ± 0.004 | 0.219 ± 0.004 |
| a3 | 0.0332 ± 0.0007 | 0.0536 ± 0.0009 | 0.0567 ± 0.0010 |
| τ1/ps | 0.619 ± 0.008 | 0.568 ± 0.006 | 0.590 ± 0.007 |
| τ2/ps | 5.64 ± 0.11 | 4.29 ± 0.08 | 4.88 ± 0.10 |
| τ3/ps | 79.1 ± 1.7 | 41.2 ± 0.7 | 44.6 ± 0.7 |
 |
0.1988 | 0.1997 | 0.2010 |
| τtot/ps | 4.33 ± 0.09 | 3.65 ± 0.06 | 4.02 ± 0.07 |
All three water correlation functions show a fast initial decay and then a much slower decay at longer times. This pattern is more clearly observable in the ln(Cn(t)) plots in Fig. 8. This type of analysis is, however, not directly applicable to NMR relaxation models inasmuch as ΔCn(t) is an average over all water molecules, including interfacial as well as bulk water. For the model description, we need separate correlation functions for water molecules in the different regions and a chemical exchange process that switches between the type of decay characteristic for the different regions.
One should notice that the two-site NMR dynamic model does not include the chemical exchange process as a modulation of the spin-lattice coupling but only as an averaging process over two different sites characterized by different relaxation properties. From the MD simulation it is clear that the translational motion of water introduces an extra modulation of a local averaged quadrupole interaction. This is also clear from the variation of the order parameter with distance from the interface (compare to Fig. 4).
The time correlation function,  , of bound water may be calculated from the MD trajectories by considering only water trajectories as long as the water molecules reside within the bound region. These trajectories are then truncated when the water molecule leaves the interface region. This means that the correlation function only describes the local water reorientation in the B region at the bound sites. This description is only valid for short times. At longer times the reorientation correlation function also decays due to the lateral diffusion along the interface. The change of the decay uncovers the size of the partially averaged quadrupole interaction. This may be expressed by a partial order parameter
  . The real order parameter may be written as
  , assuming time scale separation.
The correlation functions  (n = 0,1,2) are displayed in Fig. 9 C. These exhibit rapid decay to a constant value, frequently called the partial averaged plateau value ((Sdp(B))2) in NMR relaxation theory. Note also that the correlation functions have a similar decay, irrespective of n, and thus behave as in an isotropic system. The sum of correlation functions
  is shown as a solid line in Fig. 9 C. Similar to Eq. 5, the averaged correlation function is then fitted to a sum of exponentials:
 |
(7) |
where the parameters of a three-exponential fit are listed in Table 2 and the total integral correlation time is 5.7 ± 0.2 ps.
FIGURE 9.

Time autocorrelation function for the reorientation of water in: (A) the  region (
 ps), (B)
  region (
 ps), (C) the B region (τB = 5.6 ps), and (D) the F region (τF = 0.74 ps). Remark that the average of the water is taken only as long as the water remains inside the respective region.
TABLE 2.
The averaged water correlation function in the B-region
| Parameters | j = 1 | j = 2 | j = 3 |
|---|---|---|---|
| aj | 0.465 ± 0.004 | 0.373 ± 0.003 | 0.113 ± 0.001 |
| τj/ps | 0.270 ± 0.005 | 3.23 ± 0.03 | 35.3 ± 0.3 |
The simple NMR model (Westlund, 2000b) uses a time correlation function,
 |
(8) |
here assuming that 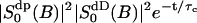 is negligible. This shows with suitable values for the parameters τb and τc a fast initial decay and a much slower decay at longer times. From the parameters of Table 2 we may estimate the short relaxation time τb ≈ 1.6 ps, and a local order parameter
 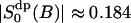 . The long relaxation time τc in the MD simulation is ∼110 ps. From the estimate of
  we obtain a second order parameter
  . These values is put into Table 3 and are compared with the best fit value of the simple NMR model. The relaxation time τc, which describes the effect of translational diffusion along the interface, is still three orders of magnitude shorter than the best-fit value of Westlund (2000b) which is in the range τc ≈ 60–150 ns. On the other hand, the order parameter of the NMR relaxation model is
 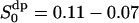 , which is only slightly smaller than the calculated value above.
TABLE 3.
Model parameters of the liquid crystalline phase
| Model parameters | MD simulation | Previous study† |
|---|---|---|
| PB | 0.725 | 0.75 |
 |
0.0247* | 0.042 |
 |
0.184* | 0.115 |
 |
0.00455 | 0.00483 |
| τc/ns | 0.11* | 60 |
| τb/ps | 1.6* | 50 |
| τF/ps | 0.74 | 5 |
| T1/ms | 354 | 31 |
| T2/ms | 354 | 6 |
| ΔνQ/Hz | 540 | 595 |
| T/K | 323 | 322 |
| nD | 23 | 15 |
These MD parameters are determined with respect to the simple NMR model (Westlund, 2000b). Remark that the other MD parameters are model-independent.
Data set 1 (Westlund, 2000b) calculated for a 100-MHz NMR magnet. Note that T1 is corrected and T2 is calculated, with respect to the original article.
A slightly more detailed picture emerges when the two types of bound water are considered separately. One would then expect that water molecules deeply buried in the interface should display a slower reorientation compared to the  waters with positive order parameters. Fig. 9, A and B displays the reorientation correlation functions for water of regions
  and
and  calculated by sampling the water, orientational only as long as the water molecule remains within the relevant region. Again, we obtain an initial decay that does not depend on whether the water molecules are in
 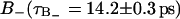 or
or 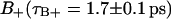 region. Finally, in Fig. 9 D, we show the bulk water reorientation correlation function from which we can calculate the correlation time τF = 0.74 ± 0.02 ps.
DPPC HEADGROUP STRUCTURE AND DYNAMICS
The restricted reorientation of the hydrated DPPC headgroup
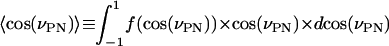
Fig. 10 displays the orientational distribution function f(cos(ν)) of three cosines of vectors describing the DPPC headgroup orientation. The angle νPN is the angle between the normal of the bilayer and the vector starting at the phosphorus atom (P) pointing toward the nitrogen atom (N) of the choline group. The P→N vector points to a good approximation in the direction of the headgroup dipole. The other two angles, νCP and νCN, are defined as the angles between the membrane normal and the vectors joining the middle carbon atom (C) of the glycerol backbone (see Fig. 1) and the phosphorus and nitrogen atoms, respectively.
FIGURE 10.

The normalized distribution of the cosine of the angle between the membrane normal (z-axis) and some DPPC headgroup vectors. C stands for the carbon defined in Fig. 1, P for the phosphorus atom and N for the nitrogen atom.
The distribution function f(cos(νPN)) is broad, which indicates great flexibility. But there is much less phase space perpendicular to the membrane so that, despite this, we get an average value of
 |
(9) |
 |
This indicates a headgroup dipole that essentially lies flat down in the membrane plane. This agrees with most other MD simulations and experiments. A much less smooth and more narrow cos(ν) distribution was obtained in the MD study of Raghavan and co-workers (1992), where they report an average angle νPN of ∼68°. The average value of 60° was obtained by Macdonald and co-workers (1991).
The hydration sphere of the phosphate group and its order parameters
Fig. 11 shows the number, N(RPO), of water oxygen atoms (O) found in a sphere of radius, RPO, centered at the DPPC phosphate atom (P) together with the radial distribution function, g(RPO). The number of water oxygens can be found according to 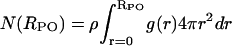 , where ρ is the average water density in a region ± 1 nm, along the z-axis, from the center of the phosphorus. The radial distribution is in agreement with previous results obtained from MD simulations (Raghavan et al., 1992; Alper et al., 1993; Marrink and Berendsen, 1994; Pasenkiewicz-Gierula et al., 1997). The first minimum of the radial distribution function, RPO ≈ 0.45 nm, indicates a first hydration shell. A second shell is extended to the region RPO ≈ 0.69 nm. The first hydration shell contains approximately five water molecules, whereas there are approximately 16 in the second shell.
FIGURE 11.

The solid line is the pair correlation function between water oxygens (O) and the phosphorus atom (P) of the lipids. The dotted line is the total number of water oxygens inside a sphere with radius RPO centered on a lipid phosphorus atom. Note that the number is scaled down by a factor of 10, with respect to its original values, to fit the plot window.
The water order parameter was calculated for water molecules with their oxygen atom within a radial distance of 0.45 nm from a DPPC phosphate atom. These hydration spheres include ∼89% of the total  volume. Fig. 12 displays the water order parameters
  and
and  of these water molecules as a function of the cosine of the angle between z-axis and the P→N vector (cos(νPN)). The first rank order parameter given by
  roughly follows the broad DPPC dipole orientation distribution. The second rank order parameter is approximately given by
 |
(10) |
This indicates that the second rank water order parameter changes sign depending on the orientation of the dipole of the polar headgroup (P→N vector). The water molecules hydrating the phosphate group thus contribute to the  region when the PN dipole has a large component along the normal, whereas the contribution to the
  region is related to the dipole having a large component along the interface.
FIGURE 12.

The O–H water order parameters,  , for waters with the oxygen within a sphere of radius 0.45 nm from a lipid phosphorus atom as a function of the cosine of the angle between z-axis and the P→N vector (cos(νPN)).
The reorientation correlation function of the P→N vector
Results of the previous section indicate that water order parameters reflect the orientation of the P→N vector of the DPPC headgroup they hydrate. We may thus also expect that the reorientation of the headgroup will relate to the water orientation correlation functions. The order parameters of the lipid P→N vector are given by 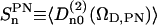 , where ΩD,PN(t) are the Euler angles relating the orientation of the z-axis (approximately the director frame (D) of the bilayer) to the P→N vector. From MD simulation, the order parameter values obtained are:
  and finally
  , which indicate a uniaxial system. The reorientation correlation functions,
 |
(11) |
are displayed in Fig. 13 and the long-time limit values are in agreement with the square of the order parameters. The initial values,  , in Fig. 13 are 0.227 for n = −2,2; 0.191 for n = −1,1; and 0.165 for n = 0 and the relaxation times calculated as integral correlation times τn are τ0 = 750 ± 6 ps; τ1 = 881 ± 6 ps; and τ2 = 1233 ± 16 ps. These values indicates that for NMR we need a restrictive reorientational diffusion model to mimic these correlation functions.
FIGURE 13.

Time autocorrelation functions,  , for the DPPC P→N vector as calculated from the simulation. The integral correlation times, τk, related to the correlation functions,
  , are τ0 = 750 ps, τ1 = 881 ps, and τ2 = 1233 ps.
2H2O-NMR powder spectrum obtained from the MD simulation
The observed quadrupole splitting in a heavy water powder spectrum relates to the water orientation order parameter  by Eq. 2. The water reorientation correlation functions calculated from the MD simulations also allow us to calculate the spin relaxation times and the 2H2O lineshape.
NMR relaxation rates are expressed in terms of spectral densities defined as the real part of the Fourier-Laplace transform of the electric field gradient correlation functions. Using Eqs. 5 and 17 to approximate the spectral densities, we obtain:
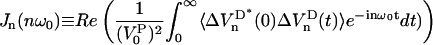 |
(12) |
 |
The NMR relaxation times T1 and T2 are obtained in the Redfield theory as:
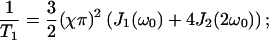 |
(13) |
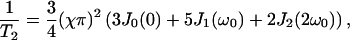 |
(14) |
with χ = 220 kHz.
Table 1 clearly shows that the water NMR relaxation falls in the extreme narrowing regime  for all available magnetic field strength. Therefore, we may put 1 + (nω0τj)2 ≈ 1 in Eq. 12. The NMR relaxation times are thus equal and we get T1 = T2 = 354 ± 7 ms. This indicates that the water reorientation in the MD simulation is far too fast or that the simulations are lacking a dynamic process on the ns time scale. But the latter is expected because the system is small and cannot incorporate slow dynamics. Notice that the MD parameters in Table 3 for the simple NMR model, described by a correlation function Eq. 8, end in relaxation times T1 = T2 = 205 ms. This value differs from 354 ms but it is mainly because the correlation function is not well described by this simple model. From the analysis of the experimental relaxation times, T1 = 280 ms and T2 = 4 ms (personal communication with Tobias Sparrman, at the Biophysical Chemistry in Umeå), a slow dynamic with a correlation time of τc approximately larger than 60 ns, is expected at an NMR field strength of 400 MHz proton frequency. This is because nonextreme narrowing conditions remove the spectral dip (Westlund, 2000a,b; Sparrman and Westlund, 2001).
2H2O-NMR powder spectra calculated from the model correlation function of water in the previous study (Westlund, 2000b) conform very well to experimental spectra and are rather broad without a dip. As expected, the heavy water lineshape in Fig. 14, calculated from the MD parameters in Table 3, show two sharp peaks symmetrically split on each side of the Larmor frequency ω0. The quadrupole splitting is in good agreement with experimental studies but the line broadening is too small. As a result of extreme narrowing conditions in the MD simulation, Fig. 14 displays a dip at the magic angle. In Table 3 the NMR parameters obtained from the MD simulation are listed together with the best fit parameters of the NMR model (Westlund, 2000b).
FIGURE 14.

Powder 2H2O NMR spectrum as calculated from the MD simulation using the Redfield theory. The variable f is the NMR frequency relative to the Larmor frequency.
CONCLUSIONS AND DISCUSSIONS
The aim of this work is to present an analysis of lipid hydration including a description of water order and dynamics based on an MD simulation of a bilayer formed by 64 DPPC molecules. We have described water dynamics and orientational order parameters which are studied by heavy water NMR relaxation and lineshape experiments.
The water order parameter distribution within the lipid–water interface reveals two types of interfacial water
The second rank order parameter  has a different sign in two regions of the hydrated lipid interface. The fraction and order parameter in the negative region (approximately below 60% of bulk density) is
  , with an order parameter
 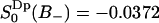 , whereas for water in the positive region,
  ,
, 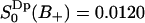 . Using
  as the criteria for perturbed (bound) water, the interface has ∼17 perturbed water molecules per lipid. The water molecules with positive order parameters tend to hydrate lipid headgroups with their dipole rather flat in the membrane plane (angles in the range 58–122° with the membrane normal), whereas waters with negative order parameters hydrate headgroups with their dipole oriented more along the interface normal. This result should be clear from an intuitive point of view if we assume that the carbonyl and phosphate groups are the attraction of the hydrogens of the water molecules and recall the mathematical expression for the order parameter,
 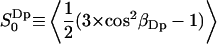 . The temperature dependence of the quadrupole splitting in the liquid crystalline phase may be explained by a model including the relative probability for a PN dipole orientation along the bilayer normal. An increase in the quadrupole splitting with temperature in the Lα phase of DPPC and a marked decrease in the Lβ has been observed (Arnold et al., 1983; personal communication with Tobias Sparrman). The MD simulation results indicate that the increased quadrupole splitting may be due to a relative increase of the population of PN dipole orientations along the interface normal (see Fig. 12 and Eq. 2).
Water lateral and perpendicular diffusion is complicated and not simply separable as assumed in chemical exchange models
The water translational motion was decomposed into chemical-exchange-like motions in and out of the interface, and lateral diffusion perpendicular to the normal thus projected along DPPC surface. The analysis of these motions suggests that water molecules with negative order parameter (in the  region) diffuse considerably slower than water molecules with a positive order parameter (in the
  region). A three-site chemical exchange model may be suggested for NMR analysis.
Water reorientation shows a fast initial decay when the water molecules stay localized and a slowly decaying part which is associated with lateral motion along the water–lipid interface
The water reorientation correlation function can be divided into a fast and a slow part. It is not a simple two-exponential decay, but it is possible to distinguish a fast initial decay causing a partially averaged quadrupole interaction and defined by the plateau value of the correlation function. The time scale of the residual decay is considerable faster in the MD simulation than is expected from NMR experimental spectral analysis. However, the MD simulation supports a time scale separation between local water reorientation and lateral diffusion motion. The latter motion is complicated and comprises lateral motion between different sites on the same DPPC headgroup as well as reorientation due to lateral motions between different DPPC molecules. This process is relatively slow and is a characteristic of the lipid–water interface. The initial fast decay of the water reorientation correlation function seems to be the same for the two types of interfacial water we have studied. This supports the idea that this relatively fast decay of the water reorientation correlation function is not very sensitive to the actual lipid interface. T1 measurements should thus be less sensitive to the water/lipid interface than lineshape analysis, inasmuch as the latter is much more sensitive to slow dynamics. The calculated 2H2O-NMR powder spectrum based on the MD simulation model results in a too-narrow spectrum and thus shows a dip at the magic angle. Extreme narrowing condition prevails in the MD simulation model, and therefore T1 = T2 = 0.35 s. There are clearly motions in the lipid bilayer/water systems that occur at time and spatial scales that are outside what can be reached with present MD simulations. Still, the appropriate NMR experiments are sensitive to them. Although the present simulation (which is among the longest of a bilayer) does cover dynamics in the 10-ns region, it is still limited to periodic systems of the 4–5 nm size. Larger-scale motions such as diffusion over curved surfaces and bilayer undulations (Lindahl and Edholm, 2000a) will contribute with additional slow relaxation. These might explain the slow modes observed in experiment, although it has not yet been possible to model for long enough times in MD.
Acknowledgments
We thank the Swedish National Research Council and the Faculty of Technical and Natural Science of Umeå University. Dr. Gerhard Gröbner is gratefully acknowledged for many valuable references and Tobias Sparrman for stimulating discussions and providing new experimental data on the 2H2O DPPC system.
This work was supported with computing resources by the Swedish Council for Planning and Coordination of Research and the Parallelldatorcentrum, Royal Institute of Technology.
APPENDIX: BASIC NMR THEORY FOR THE 2H NUCLEUS
In NMR the strongest interaction is between the static magnetic field vector B0 = (0,0,Bz) and the nuclear magnetic dipole. This is described by the Zeeman Hamiltonian  , where
  . The interaction between the nuclear spin and the molecular surrounding is described by the spin-lattice Hamiltonian which in this case is dominated by an electric quadrupole interaction. We assume that the electric field gradient (EFG) points along the O–H bond which is taken as z-axis in the local principal (p) frame. Describing the spin operators as rank 2 irreducible spherical tensor operators
  , the quadrupole Hamiltonian may then be written as:
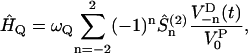 |
(15) |
where 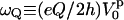 . Here, Q is the electric quadrupole moment, whereas
  is directly related to the EFG and may be expressed in terms of the second derivative of the electrostatic potential, V(z), in the principal frame as
  . We may combine the quadrupole moment and the EFG into the constant
  which for deuterium in water takes the value 220 kHz (Halle and Wennerström, 1981).
The time evolution of the spin-density operator  can, in this semiclassical approximation, be written as
 |
(16) |
where 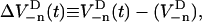
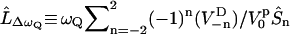 , and
, and 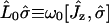 . The rank 2 spin superoperators
  are defined from the commutator
  . If we assume that
  , the rotation from
  to
to  can be written
 |
(17) |
where the Euler angles are  . One should remark that all time dependence in the right side of Eq. 17 is in the Wigner rotation elements. From Eq. 17 we then get that
 |
(18) |
where the order parameter is defined as  .
.
Erik Lindahl's present address is Dept. of Structural Biology, Stanford University, Stanford CA 94305, USA.
References
- Alper, H. E., D. Bassolino-Klimas, and T. R. Stouch. 1993. The limiting behaviour of water hydrating a phospholipid monolayer: A computer simulation study. J. Chem. Phys. 99:5547–5559. [Google Scholar]
- Arnold, K., E. Löbel, F. Volke, and K. Gawrisch. 1981. 31P-NMR investigations of phospholipids. Studia Biophysica. 82:207–214. [Google Scholar]
- Arnold, K., L. Pratsch, and K. Gawrisch. 1983. Effect of poly(ethylene glycol) on phospholipid hydration and polarity of the external phase. Biochim. Biophys. Acta. 728:121–128. [DOI] [PubMed] [Google Scholar]
- Bechinger, B., and J. Seelig. 1991. Conformational changes of the phospatidylcholine headgroup due to the membrane dehydration. A 2H-NMR study. Chem. Phys. Lipid. 58:1–5. [DOI] [PubMed] [Google Scholar]
- Berger, O., O. Edholm, and F. Jähnig. 1997. Molecular dynamics simulations of a fluid bilayer of dipalmitoylphosphatidylcholine at full hydration, constant pressure, and constant temperature. Biophys. J. 72:2002–2013. [DOI] [PMC free article] [PubMed] [Google Scholar]
- Brink, D. M., and G. R. Satchler. 1993. Angular Momentum. Clarendon Press, Oxford, UK.
- Borle, F., and J. Seelig. 1983. Hydration of Escherichia coli lipids. Deuterium T1 relaxation time studies of phosphatidylglycerol, phosphatidyl-ethanolamine and phosphatidylcholine. Biochim. Biophys. Acta. 735:131–136. [DOI] [PubMed] [Google Scholar]
- Casal, H. L. 1989. Infrared spectroscopic determination of water penetration in lipid bilayer membranes. J. Phys. Chem. 93:4328–4330. [Google Scholar]
- Dufourc, E. J., C. Mayer, J. Stohrer, G. Althhoff, and G. Kothe. 1992. Dynamics of phosphate headgroups in biomembranes. Comprehensive analysis using phosphorus-31 nuclear magnetic resonance lineshape and relaxation time measurements. Biophys. J. 61:42–57. [DOI] [PMC free article] [PubMed] [Google Scholar]
- Faure, C., L. Bonakdar, and E. J. Dufourc. 1997. Determination of DMPC hydration in the Lα and Lβ′ phases by 2H solid state NMR D2O. FEBS Lett. 405:263–266. [DOI] [PubMed] [Google Scholar]
- Finer, E. G., and A. Darke. 1974. Phospholipid hydration studied by deuteron magnetic resonance spectroscopy. Chem. Phys. Lipids. 12:1–16. [DOI] [PubMed] [Google Scholar]
- Gawrisch, K., D. Ruston, J. Zimmerberg, A. Paregian, R. P. Rand, and N. Fuller. 1992. Membrane dipole potentials, hydration forces and the ordering of water at membrane surfaces. Biophys. J. 61:1213–1223. [DOI] [PMC free article] [PubMed] [Google Scholar]
- Halle, B., and H. Wennerström. 1981. Interpretation of magnetic resonance data from water nuclei in heterogeneous systems. J. Chem. Phys. 75:1928–1942. [Google Scholar]
- Håkansson, P., P. O. Westlund, E. Lindahl, and O. Edholm. 2001. A direct simulation of EPR slow-motion spectra of spin labelled phospholipids in liquid crystalline bilayers based on a molecular dynamics simulation of the lipid dynamics. Phys. Chem. Chem. Phys. 3:5311–5319. [Google Scholar]
- Jedlovszky, P., and M. Mezei. 2001. Orientational order of water molecules across a fully hydrated DMPC bilayer: a Monte Carlo simulation study. J. Phys. Chem. B. 105:3614–3623. [Google Scholar]
- LeNeveu, D. M., R. P. Rand, and V. A. Parsegian. 1976. Measurement of forces between lecithin bilayers. Nature. 259:601–603. [DOI] [PubMed] [Google Scholar]
- Lindahl, E., and O. Edholm. 2000a. Mesoscopic undulations and thickness fluctuations in lipid bilayers from molecular dynamics simulations. Biophys. J. 79:426–433. [DOI] [PMC free article] [PubMed] [Google Scholar]
- Lindahl, E., and O. Edholm. 2000b. Spatial and energetic/entropic decomposition of surface tension in lipid bilayers from molecular dynamics simulations. J. Chem. Phys. 113:3882–3893. [Google Scholar]
- Lindahl, E., and O. Edholm. 2001. Molecular dynamics simulation of NMR relaxation rates and slow dynamics in lipid bilayers. J. Chem. Phys. 115:4938–4950. [Google Scholar]
- Macdonald, P. M., J. Leisen, and F. M. Marassi. 1991. Response of phosphatidylcholine in the gel and liquid-crystalline states to membrane surface charges. Biochemistry. 30:3558–3566. [DOI] [PubMed] [Google Scholar]
- Markova, N., E. Sparr, L. Wadsö, and H. Wennerström. 2000. A calorimetric study of phospholipid hydration. Simultaneous monitoring of enthalpy and free energy. J. Phys. Chem. B. 104:8053–8060. [Google Scholar]
- Marrink, S.-J., and H. J. C. Berendsen. 1994. Simulation of water transport through a lipid membrane. J. Phys. Chem. 98:4155–4168. [Google Scholar]
- Marrink, S.-J., M. Berkowitz, and H. J. C. Berendsen. 1993. Molecular dynamics simulation of membrane/water interface: the ordering of water and its relation to the hydration force. Langmuir. 9:3122–3131. [Google Scholar]
- Marrink, S.-J., E. Lindahl, O. Edholm, and A. E. Mark. 2001. Simulation of the spontaneous aggregation of phospholipids into bilayers. J. Am. Chem. Soc. 123:8638–8639. [DOI] [PubMed] [Google Scholar]
- Mayer, C., G. Gröbner, G. Müller, K. Weisz, and G. Kothe. 1990. Orientation dependent deuteron spin-lattice relaxation times in bilayer membranes: characterization of overall lipid motion. Chem. Phys. Lett. 165:155–161. [Google Scholar]
- Mills, R. 1973. Self-diffusion in normal and heavy water. J. Phys. Chem. 77:685–688. [Google Scholar]
- Nagle, J. F. 1993. Area/lipid of bilayers from NMR. Biophys. J. 64:1476–1481. [DOI] [PMC free article] [PubMed] [Google Scholar]
- Nagle, J. F., R. Zhang, S. Tristram-Nagle, W. Sun, H. I. Petrache, and R. M. Suter. 1996. X-ray structure determination of fully hydrated Lα phase dipalmitoylphosphatidylcholine bilayers. Biophys. J. 70:1419–1431. [DOI] [PMC free article] [PubMed] [Google Scholar]
- Pasenkiewicz-Gierula, M., Y. Takaoka, H. Miyagawa, K. Kitamura, and A. Kusumi. 1997. Hydrogen bonding of water to phosphatidylcholine in the membrane as studied by molecular dynamics simulation: location, geometry, and lipid-lipid bridging via hydrogen-bonded water. J. Phys. Chem. 101:3677–3691. [Google Scholar]
- Pohle, W., C. Selle, H. Fritzsche, and H. Binder. 1998. Fourier transform infrared spectroscopy as a probe for the study of the hydration of lipid self-assemblies. I. Methodology and general phenomena. Biospectroscopy. 4:267–280. [DOI] [PubMed] [Google Scholar]
- Pohle, W., C. Selle, H. Fritzsche, and M. Bohl. 1997. Comparative FTIR spectroscopy study upon the hydration of lecithins and cephalins. J. Mol. Struct. 408–409:273–277. [Google Scholar]
- Raghavan, K., M. R. Reddy, and M. L. Berkowitz. 1992. A molecular dynamics study of the structure and dynamics of water between dilauroylphosphatidylethanolamine bilayers. Langmuir. 8:233–240. [Google Scholar]
- Sparrman, T., and P. O. Westlund. 2001. 2H NMR relaxation and line shape analysis of water in a lamellar liquid crystalline phase formed by Dodecyldimethylamineoxide (DDAO) and 2H2O. J. Phys. Chem. 105:12524–12528. [Google Scholar]
- Tieleman, D. P., S. J. Marrink, and H. J. C. Berendsen. 1997. A computer perspective of membranes: molecular dynamics studies of lipid bilayer systems. Biochim. Biophys. Acta. 1331:235–270. [DOI] [PubMed] [Google Scholar]
- Ulmius, J., H. Wennerström, G. Lindblom, and G. Arvidson. 1977. Deuteron nuclear magnetic resonance studies of phase equilibria in a lecithin-water system. Biochemistry. 16:5742–5745. [DOI] [PubMed] [Google Scholar]
- Vaz, W. L., and P. F. Almeida. 1991. Microscopic versus macroscopic diffusion in one-component fluid phase lipid bilayer membranes. Biophys. J. 60:1553–1554. [DOI] [PMC free article] [PubMed] [Google Scholar]
- Volke, F., S. Eisenblätter, J. Galle, and G. Klose. 1994. Dynamic properties of water at phosphatidylcholine lipid-bilayer surfaces as seen by deuterium and pulsed field gradient proton NMR. Chem. Phys. Lipids. 70:121–131. [DOI] [PubMed] [Google Scholar]
- Wassall, S. R. 1996. Pulsed field gradient-spin echo NMR studies of water diffusion in a phospholipid model membrane. Biophys. J. 71:2724–2732. [DOI] [PMC free article] [PubMed] [Google Scholar]
- Wennerström, H., B. Lindman, O. Söderman, T. Drakenberg, and J. B. Rosenholm. 1979. 13C magnetic relaxation in micellar solutions. Influence of aggregate motion on T1. J. Am. Chem. Soc. 101:6860–6864. [Google Scholar]
- Westlund, P. O. 2000a. A dip in powder deuterium NMR lineshapes. J. Magn. Reson. 145:364–366. [DOI] [PubMed] [Google Scholar]
- Westlund, P. O. 2000b. Line shape analysis of NMR powder spectra of 2H2O in lipid bilayer systems. J. Phys. Chem. 104:6059–6064. [Google Scholar]