Abstract
Dystrophin-deficient muscle fibers from mdx mice are believed to suffer from increased calcium entry and elevated submembranous calcium level, the actual source and functional consequences of which remain obscure. Here we compare the properties of the dihydropyridine receptor as voltage sensor and calcium channel in control and mdx muscle fibers, using the silicone-voltage clamp technique. In control fibers charge movement followed a two-state Boltzmann distribution with values for maximal charge, midpoint voltage, and steepness of 23 ± 2 nC/μF, −37 ± 3 mV, and 13 ± 1 mV (n = 7). Essentially identical values were obtained in mdx fibers and the time course of charge recovery from inactivation was also similar in the two populations (τ ≈ 6 s). In control fibers the voltage dependence of the slow calcium current elicited by 100-ms–long pulses gave values for maximal conductance, apparent reversal potential, half-activation potential, and steepness factor of 156 ± 15 S/F, 65.5 ± 2.9 mV, −0.76 ± 1.2 mV, and 6.2 ± 0.5 mV (n = 17). In mdx fibers, the half-activation potential of the calcium current was slightly more negative (−6.2 ± 1.2 mV, n = 16). Also, when using longer pulses, the time constant of calcium current decay was found to be significantly larger (by a factor of 1.5–2) in mdx than in control fibers. These changes in calcium current properties are unlikely to be primarily responsible for a dramatic alteration of intracellular calcium homeostasis. They may be speculated to result, at least in part, from remodeling of the submembranous cytoskeleton network due to the absence of dystrophin.
INTRODUCTION
In skeletal muscle, plasma membrane depolarization triggers sarcoplasmic reticulum (SR) calcium release through the interaction of the t-tubule membrane dihydropyridine (DHP) receptors with the ryanodine receptors present in the adjacent SR membrane, at the level of the triadic junction. Since 1973 (Schneider and Chandler) a considerable amount of work has focused on detailed analysis of intramembrane charge movement which mostly reflects voltage-driven conformational changes in the DHP receptors (for review, see Rios and Pizarro, 1991). DHP receptors operate both as voltage sensors for the coupling process and as L-type calcium channels and thus represent a key regulator of intracellular calcium concentration in skeletal muscle. Conversely, several lines of work showed that both intramembrane charge movement and calcium current are susceptible to the intracellular [Ca2+] level: in frog skeletal muscle, intramembrane charge movement is enhanced by caffeine-induced increase in intracellular [Ca2+] (Shirokova and Rios, 1996), and attenuated by intracellular perfusion of the fast calcium buffer BAPTA (Stroffekova and Heiny, 1997). The calcium current amplitude is also increased by caffeine, decreased by BAPTA, and by the Ca2+ release channel blocker ruthenium red (Feldmeyer et al., 1993). In contrast, in mouse cultured myotubes, data from Balog and Gallant (1999) are consistent with increased SR Ca2+ release being associated to a decrease in the sarcolemmal L-type current. The fundamental role of the DHP receptor in intracellular Ca2+ regulation as well as the possibility that its function may be affected by intracellular Ca2+ is of strong interest within the context of some muscular pathologies. In particular, in the mdx mouse which is commonly used as a model of Duchenne muscular dystrophy, there has been controversial data about the possibility that a defective intracellular calcium homeostasis from unclear origin, leading to a chronically elevated [Ca2+] level, is involved in the process of muscle degeneration (for review, see Gillis, 1999). Data from our laboratory suggest that an increased [Ca2+] level is restricted to the subplasma membrane compartment while the global cytosolic [Ca2+] remains unaffected (Collet et al., 1999; Mallouk et al., 2000). An increased submembranous Ca2+ level could be expected either to be related to a defective operating of the DHP receptors or to modify the standard function of these receptors. The general goal of the present study was thus to compare some of the basic properties of charge movement and calcium current in control and mdx fibers. So far, there is no published data concerning the slow L-type calcium current in mdx muscle fibers, and one cannot exclude the possibility that it may be affected in the pathologic condition. Concerning charge movement, Hollingworth et al. (1990a) showed that the total amount of charge moved between −70 and −30 mV was not significantly different between control and mdx fibers from mice aged 8–10 months. Our aim was to complement these data by characterizing the complete voltage dependence of charge movement activation, the kinetic properties of the charge displacement, and the time course of charge movement repriming from the inactivated state. Experiments were specifically performed on muscle fibers from young (<2 months) control and mdx mice because intense muscle degeneration occurs in the mdx mouse within that period (Carnwath and Shotton, 1987; DiMario et al., 1991). An abstract of this work was presented at the 2002 Biophysical Society meeting (Jacquemond et al., 2002).
METHODS
Isolation and preparation of the muscle fibers
All experiments were performed on single skeletal fibers isolated from the flexor digitorum brevis muscles of wild-type (C57BL/10ScSn) and mdx (C57BL/10mdx) male mice aged 3–8 weeks unless otherwise specified in text. All experiments were performed in accordance with the guidelines of the French Ministry of Agriculture (87/848) and of the European Community (86/609/EEC). Details of procedures for isolation of single fibers and partial insulation of fibers with silicone grease, were as described previously (Collet et al., 1999; Jacquemond, 1997). In brief, mice were killed by cervical dislocation after halothane anesthesia. The muscles were removed and treated with Collagenase (Sigma type 1, Sigma-Aldrich, Saint Quentin Fallavier, France) for 60–75 min at 37°C in the presence of Tyrode as external solution. Single fibers were then obtained by triturating the muscles within the experimental chamber. The major part of a single fiber was electrically insulated with silicone grease so that whole-cell voltage clamp could be achieved on a short portion (50- to 100-μm long) of the fiber extremity. Unless otherwise specified in text, a solution containing 50 mM EGTA diluted in the intracellular-like solution was pressure microinjected within the silicone insulated portion of the fibers. A minimum delay of 20 min was then allowed before voltage-clamping the fibers. All experiments were performed at room temperature (20–22°C), in the presence of a tetraethylammonium (TEA)-containing solution as extracellular medium (see Solutions).
Electrophysiology
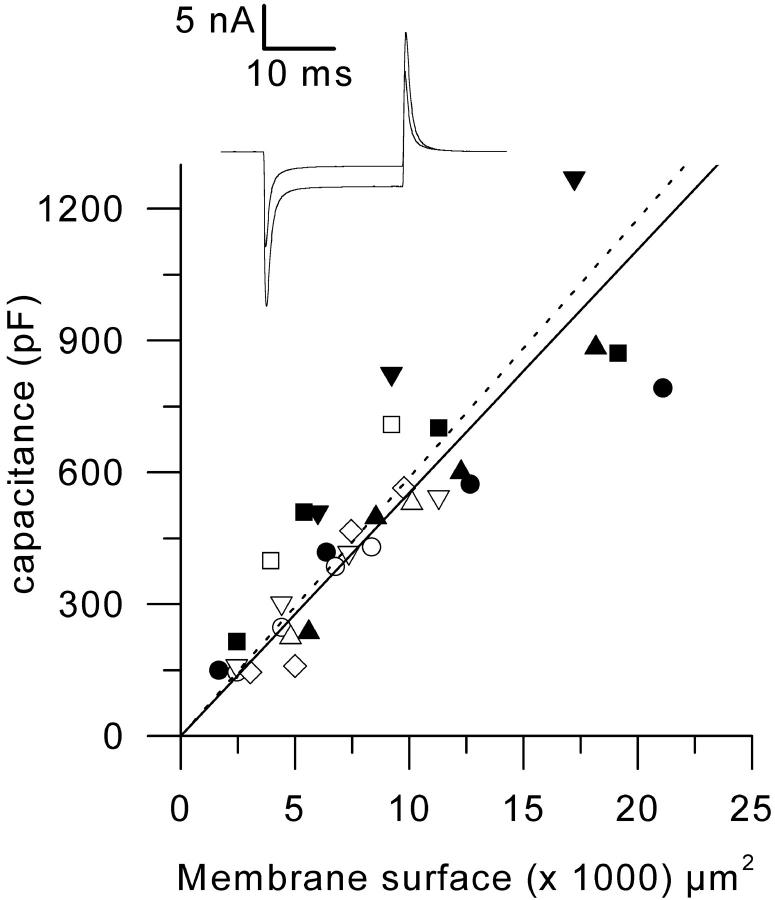
An RK-400 patch-clamp amplifier (Bio-Logic, Claix, France) was used in whole-cell configuration. Command voltage pulse generation and data acquisition were done using commercial software (Biopatch Acquire, Bio-Logic) driving an A/D, D/A converter (Lab Master DMA Board, Scientific Solutions Inc., Solon, OH). Analog compensation was systematically used to decrease the effective series resistance. Voltage-clamp was performed with a microelectrode filled with the internal-like solution (see Solutions). Microelectrode resistance was within 1–3 MΩ. The tip of the microelectrode was inserted through the silicone, within the insulated part of the fiber. Membrane depolarizations were always applied from a holding command potential of −100 mV. The mean measured capacitance was 614 ± 40 pF (n = 45) for control fibers and 685 ± 40 pF (n = 53) for mdx fibers. The mean input resistance calculated from the steady change in membrane current elicited by a 20-mV hyperpolarizing command step of 20-ms duration was 19.4 ± 1.2 MΩ (n = 45) and 18.8 ± 0.9 MΩ (n = 53), for control and mdx fibers, respectively. In a few experiments capacitance measurements were taken from the same fiber, the length of the silicone-free portion of which was varied. For this, a single fiber partially embedded within silicone was voltage-clamped and the free portion of the fiber was then reduced by covering it with some more silicone. The same process was repeated two to three times. At each step, the length of the silicone-free portion was measured and small hyperpolarizing pulses were given to measure the capacitance. In Fig. 1, the inset shows examples of changes in membrane current elicited by a 20-mV hyperpolarizing pulse at two different lengths of the silicone-free portion of the same fiber. The graph shows the dependence of the measured capacitance upon the estimated surface of the silicone-free portion of fiber in control (solid symbols) and in mdx fibers (open symbols). The surface was calculated from the measured length and width of the free portion of fiber, assuming it to be a cylinder. Each symbol corresponds to a different fiber. Data points, obtained in the same fiber, were fitted by a straight line to zero. The mean slope in control and mdx fibers was 5.5 ± 0.8 μF/cm2 (n = 4) and 5.9 ± 0.5 μF/cm2 (n = 5), respectively, indicating a similar surface-to-t-tubule membrane ratio in the two populations of fibers. Membrane potential measurements (results presented in Fig. 7) were performed as previously described (Collet et al., 1999) using a high-input impedance voltage amplifier (VF-1800, Bio-Logic). In the present case, however, the microelectrode was filled with our standard intracellular solution, to improve the stability of the recordings over a long period of time. In addition, the tip of the microelectrode was inserted within the near-end region of the silicone-embedded portion of the fiber, in the vicinity of the silicone-free portion, to avoid any drop in membrane resistance consecutive to the impalement.
FIGURE 1.
Dependence of the membrane capacitance upon the estimated surface membrane area in four control fibers (solid symbols) and in five mdx fibers (open symbols). Each symbol corresponds to a different fiber. Superimposed continuous and dashed lines correspond to the mean slope obtained from individual fits to data from control and mdx fibers, respectively. Inset shows an example of changes in membrane current elicited by a 20-mV hyperpolarizing pulse at two different lengths of silicone-free portion of the same control fiber: corresponding estimated membrane surface area and measured capacitance were 19,000 μm2 and 820 pF, and 5400 μm2 and 510 pF, respectively.
FIGURE 7.
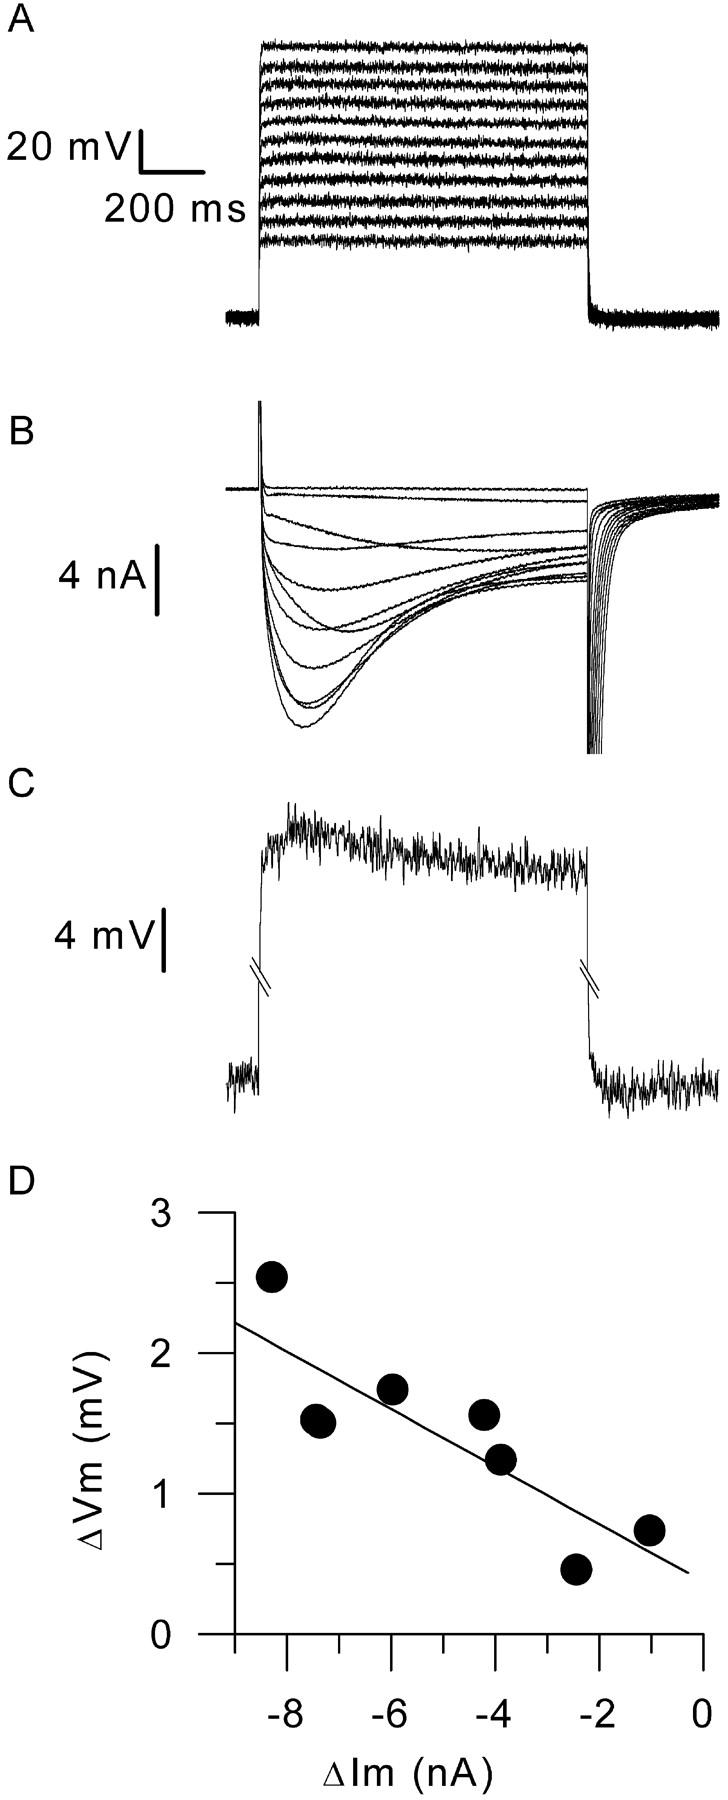
Measurements of membrane potential in a fiber depolarized by 1-s-long voltage-clamp pulses to various levels in the presence of 2.5 mM extracellular calcium. (A) Membrane potential measured with an additional microelectrode upon application of command voltage steps to values ranging between −60 and +40 mV. (B) Corresponding membrane current traces. (C) Enlarged view of the bottom and of the top of the membrane potential trace during the voltage-clamp step that elicited the largest inward calcium potential. Trace was smoothed 20×. (D) Dependence of the change in membrane current measured between the peak calcium current and the current at the end of the pulse, upon the corresponding measured change in membrane current.
Measurement and calculation of intramembrane charge movement
Charge movement currents were calculated using conventional procedures consisting of subtracting scaled control current records from the current elicited by test depolarizing pulses of identical duration and of various amplitudes. Control current records were measured in response to a series of 10–15 pulses taken at regular times throughout each experiment; in most cases hyperpolarizing pulses of 20-mV amplitude from the −100-mV holding potential were used. Only for the experiments designed to study the recovery of charge movement from inactivation, were the control current records obtained in response to depolarizing pulses that were of 40-mV amplitude from a holding potential of 0 mV. In all cases, the control current records from a given series were then averaged to produce a mean control current record. The mean control current record that was the closest in time to a given test pulse (or a series of test pulses) was then scaled by the ratio of the amplitude of each test pulse to the amplitude of the control pulses, and added to (or subtracted from, when depolarizing control pulses were used) the corresponding test current record. In some experiments, control records were taken immediately before and after a series of test pulses; in that case, the average of the previous and subsequent control currents was used to correct the test current records. In seven fibers we tested the presence of nonlinear charge in the control currents by applying −20 mV short pulses from holding potentials of both −100 mV and −130 mV. In average, the mean measured capacitance was 594 ± 104 pF and 524 ± 89 pF at −100 mV and −130 mV, respectively. The corresponding mean ratio of the capacitance measured at −130 mV to that measured at −100 mV was 0.9 ± 0.03. So it seems that there was a small amount of nonlinear charge moved in our negative controls taken from −100 mV. As a consequence, charge movement measured in response to test pulses may have been slightly underestimated. This, however, should not affect the main conclusions from this series of measurements.
Test records were in some cases further corrected for sloping baseline using previously described procedures (Horowicz and Schneider, 1981). Data points during the first ms of the onset and offset of the pulse were usually neglected to eliminate errors of subtraction. The amount of charge moved during a depolarizing pulse was measured by integrating the corrected test current records from 1 ms after the onset of the pulse to the end of the pulse (“on” charge) and from 1 ms after the offset of the pulse to the end of the record (“off” charge). To enable the comparison of different fibers with different silicone-free portions the calculated charge was normalized to the capacitance of the fiber. The steady-state voltage distribution of the normalized charge (Q(V)) was fitted by a two-state Boltzmann distribution:
 |
(1) |
with Qmax, V0.5, and k corresponding to the maximal available charge, voltage of equal charge distribution between the two states, and effective valence of the moving charges, respectively. The voltage dependence of the kinetics of charge transfer was obtained by fitting a single exponential function to the decaying phase of the “on” or “off” charge movement current. Voltage dependence of the time constant τ was fitted by a single barrier Eyring rate model assuming both first- and second-order terms to be present in the rate constant-vs.-voltage function (Brum and Rios, 1987):
 |
(2) |
where τmax is the time constant at the voltage of equal charge distribution, and a is the factor for the second-order term, with other parameters having their usual meaning.
Measurement of calcium current
Calcium current recording was performed in the presence of 2.5 mM extracellular calcium (see Solutions). In one series of measurements, we used voltage-clamp test depolarizations of 100-ms duration applied with a 10-mV increment from a holding potential of −100 mV, the amplitude of the first depolarization being 20 mV. Depolarizations were applied every 30 s. Each and every test depolarization was preceded by a series of three or four control depolarizations of either 10-mV or 20-mV amplitude and 100-ms duration. The average membrane current from these control pulses was appropriately scaled and subtracted from the corresponding test membrane current. In some cases the average membrane current elicited by a series of 15–20 depolarizations of 20-mV amplitude and 100-ms duration, taken before a series of test pulses to various potentials, was used for the correction. The voltage dependence of the calcium current density curves was fitted with the following equation:
 |
(3) |
where I(V) is the mean density of the current measured over the last 20 ms of the depolarization to the command potential V, Gmax is the maximum conductance, Vrev is the apparent reversal potential, V0.5 is the half-activation potential, and k is a steepness factor. The voltage dependence of the normalized conductance was obtained by dividing the I(V) data points by Gmax(V − Vrev).
In another set of experiments, membrane test depolarizations of 1.5-s duration to various levels were applied. In this case, only the linear leak component of the current was removed by subtracting the appropriately scaled value of the steady current measured during a +10-mV voltage step applied before the test pulse.
Solutions
Tyrode solution contained (in mM): 140 NaCl, 5 KCl, 2.5 CaCl2, 2 MgCl2, and 10 HEPES adjusted to pH 7.20 with NaOH. For charge movement recording, the external solution contained (mM) 140 TEA-methanesulfonate, 4.5 MgCl2, 1 4-aminopyridine, 1 anthracene-9-carboxylic acid, 10 TEA-HEPES, and 0.002 tetrodotoxin, pH 7.20. We wish to mention that, although the use of this zero-calcium–containing extracellular solution proved to be a judicious choice for obtaining clean charge movement records, most fibers did not tolerate well the absence of calcium for long periods of time. In many cases, this was found to be quite limiting when testing protocols that required stable conditions for more than ∼30 min. For calcium current recording, the same solution was used except that 2.5 mM CaCl2 and 2 mM MgCl2 were present. For barium current recording, the solution contained 2.5 mM BaCl2 and no calcium. The internal-like solution contained (in mM): 120 K-glutamate, 5 Na2-ATP, 5.5 MgCl2, 5 Na2-phosphocreatine, and 5 HEPES adjusted to pH 7.20 with K-OH. In some experiments the cell under study was continuously superfused with the extracellular solution using a thin polyethylene capillary perfusion system operated by gravity. This allowed us to rapidly change the composition of the solution bathing the voltage-clamped portion of cell.
Statistics
Least-squares fits were performed using a Marquardt-Levenberg algorithm routine included in Microcal Origin (Microcal Software Inc., Northampton, MA). Data values are presented as means ± SE. Statistical significance was determined using a Student's t-test assuming significance for p < 0.05.
RESULTS
Intramembrane charge movement in control and mdx fibers
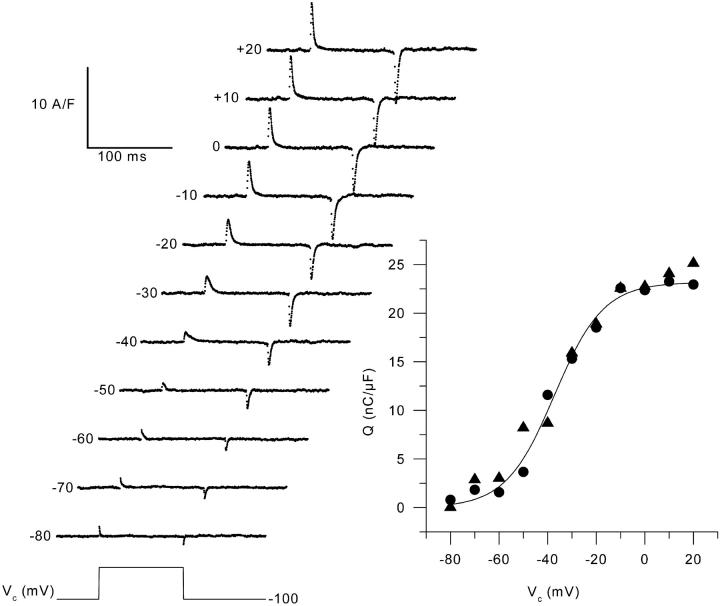
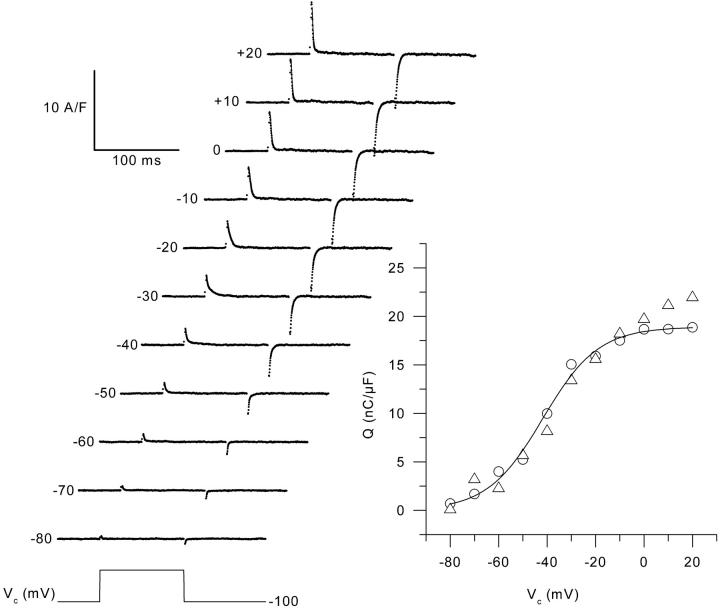
The left panel of Fig. 2 presents a series of charge movement records obtained from a control muscle fiber in response to 100-ms-long depolarizing command pulses to various levels (Vc), from the holding command potential of −100 mV. Results show that our conditions enabled the recording of membrane currents having all expected properties of charge movement currents with no substantial contribution from residual contaminating ionic currents. Asymmetric membrane currents were clearly detected from ∼−70 mV and their amplitude increased with the command potential up to ∼−10 mV. The right panel in Fig. 2 shows the voltage distribution of the “on” and “off” charge measured in this same fiber. There was quite good “on-off” equality over the explored voltage range. The superimposed curve shows the result from fitting the Boltzmann distribution to the “on” charge data points. This gave values for Qmax, V0.5, and k of 23 nC/μF, −37 mV, and 10 mV, respectively. Fig. 3 is designed on the exact same format as Fig. 2 but it presents data obtained from an mdx muscle fiber. Results show the absence of any strong qualitative difference between these and the control records shown in Fig. 2. In the right panel of Fig. 3, the curve superimposed to the data points corresponds to the result from the fit to the “on” charge which gave values for Qmax, V0.5, and k of 19 nC/μF, −42 mV, and 11.5 mV, respectively. Fig. 4 shows the mean voltage distribution of the “on” charge measured from seven control (A) and nine mdx muscle fibers (B). For all values of membrane potentials, there was no significant difference between control and mdx fibers in terms of amount of charge moved. The mean values for Qmax, V0.5, and k obtained from fits to each individual series of data points from control and mdx fibers were 22.8 ± 1.7 and 23.7 ± 2.6 nC/μF, −37.0 ± 3.0 and −37.1 ± 3.2 mV, 12.8 ± 1.2, and 13.0 ± 1.8 mV, respectively.
FIGURE 2.
Charge movement records from a control muscle fiber in response to 100-ms-long depolarizing command pulses from a holding command potential of −100 mV to the indicated values. The solid lines superimposed on the decay of the “on” charge correspond to the results from fitting a single exponential function. For depolarizations between −80 mV to +20 mV, values for the time constant of decay were 0.8, 2.3, 2.5, 3.1, 7.6, 5, 3.6, 2.8, 2.6, 2.4, and 2.1 ms, respectively. The graph shows the steady-state voltage distribution of the “on” (solid circles) and “off” (solid triangles) charge, calculated from the records shown on the left. The solid line corresponds to the result from fitting the two-state Boltzmann distribution to the “on” charge data points.
FIGURE 3.
Charge movement records from an mdx muscle fiber in response to 100-ms-long depolarizing command pulses from a holding command potential of −100 mV to the indicated values. The solid lines superimposed on the decay of the “on” charge correspond to the results from fitting a single exponential function. For depolarizations between −80 mV to +20 mV, values for the time constant of decay were 0.8, 1.2, 1.4, 2, 2.4, 5.1, 3.7, 2.6, 1.8, 1.5, and 1.4 ms, respectively. The graph shows the steady-state voltage distribution of the “on” (open circles) and “off” (open triangles) charge, calculated from the records shown on the left. The solid line corresponds to the result from fitting the two-state Boltzmann distribution to the “on” charge data points.
FIGURE 4.
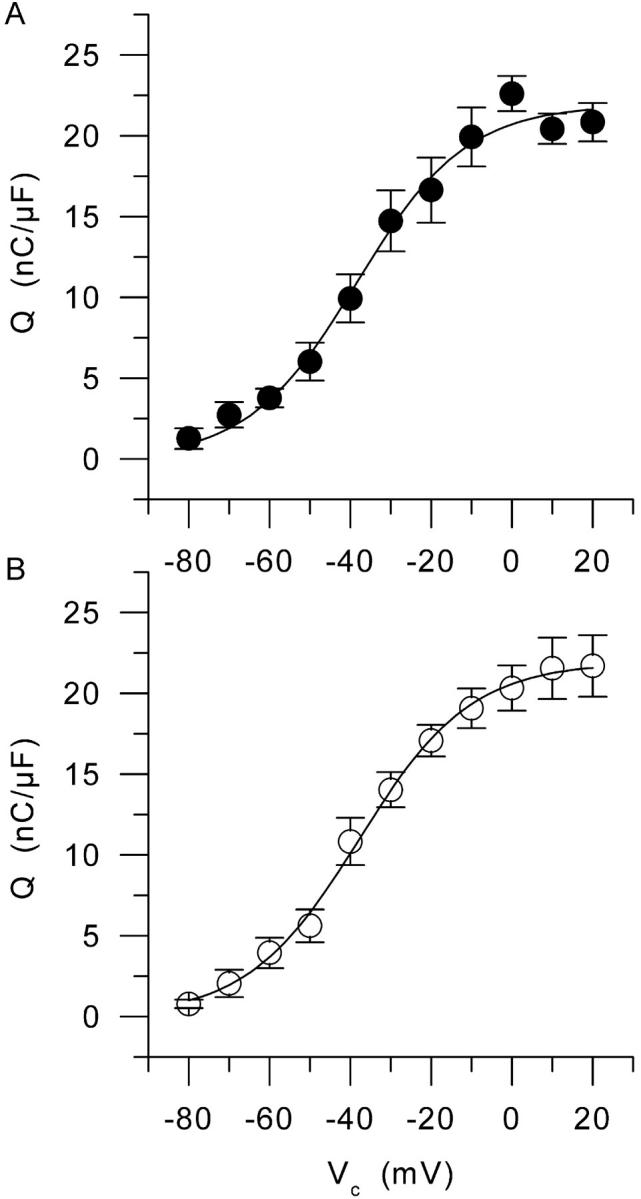
Mean voltage distribution of the “on” charge from (A) seven control fibers and (B) nine mdx muscle fibers. Superimposed solid lines correspond to the result from fitting the two-state Boltzmann distribution to the mean data points. In control and in mdx, this gave values for Qmax, V0.5, and k of 21.9 nC/μF, −38 mV, and 13.5 mV, and 21.9 nC/μF, −38 mV, and 13.8 mV, respectively.
In Fig. 2 and Fig. 3, the result from fitting a single exponential function to the decaying phase of the “on” charge is shown as a solid curve superimposed to each series of data points. In both the control and the mdx fiber, the time constant of decay increased upon depolarizing the membrane within the −100 to ∼−30 mV range, and then decreased for higher values of depolarization. For instance, at −70, −30, and 0 mV, values for τ were 2.3 ms, 5.0 ms, and 2.6 ms in the control fiber (Fig. 2), and 1.2 ms, 5.1 ms, and 2.6 ms in the mdx fiber (Fig. 3), respectively. Fig. 5 shows the mean values of the time constant of charge decay vs. membrane potential in control (top graph) and mdx fibers (bottom graph). Data points at −100 mV were obtained by fitting the “off” part of the currents. In both populations, the dependence of the time constant upon membrane potential was bell-shaped, with the time constant reaching a maximum for membrane potential values of ∼−40 and −30 mV. The mean maximum values for the time constant of charge decay and for the corresponding midvoltages obtained from individual fits to the data points from each fiber were 5.7 ± 0.8 ms and −30.5 ± 3.9 mV (n = 6) in control fibers, and 5.3 ± 0.7 ms and −31.6 ± 3.4 mV (n = 6) in mdx fibers, respectively. In Fig. 5, the solid curve shown on each graph corresponds to the result from fitting the one barrier Eyring rate model to the mean values of the time constant of charge decay (see Methods). In control, the fit gave values of 4.4 ms, −33 mV, and 6.3 mV for τmax, V0.5, and k respectively. In mdx, values for τmax, V0.5, and k from the fit were 4.8 ms, −32 mV, and 7.6 mV, respectively.
FIGURE 5.
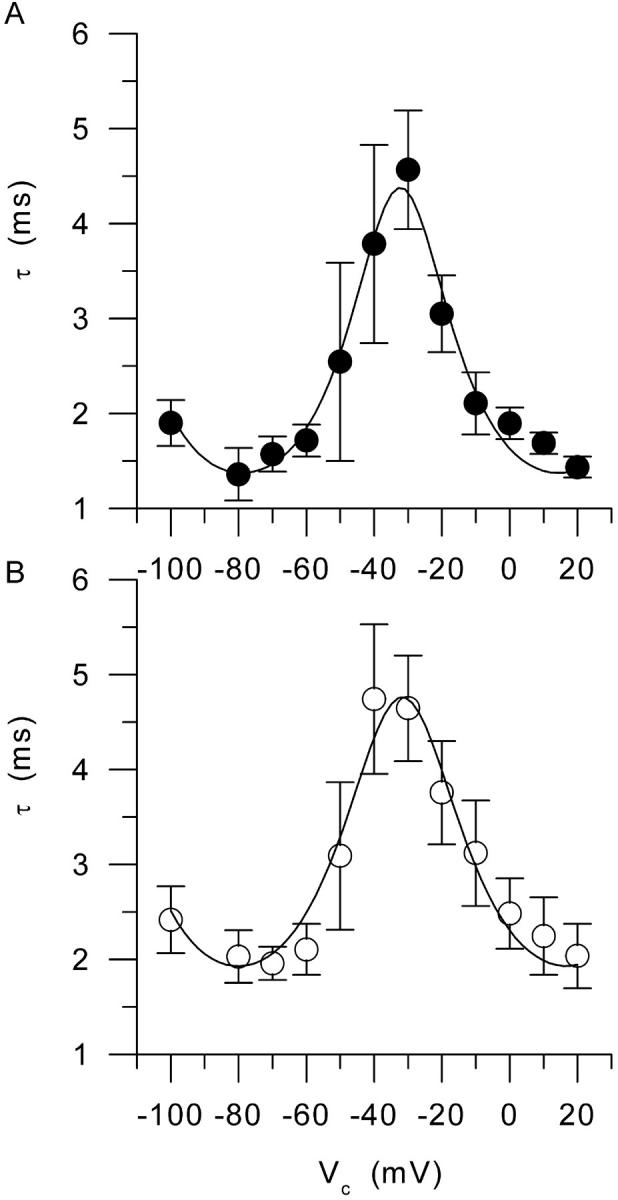
Voltage dependence of the time constant of charge movement decay in (A) control and (B) mdx fibers. In each graph, the superimposed line corresponds to the result from fitting the one-barrier Eyring rate model to the mean values (see text for details).
Inasmuch as mdx skeletal muscles are suspected to exhibit an elevated subsarcolemmal [Ca2+] level (Mallouk et al., 2000), we questioned the possibility of whether or not the intracellular EGTA used in the above described experiments may have prevented the detection of a potential modification of charge movement properties in this preparation. Therefore, a series of measurements was taken from mdx muscle fibers that were not loaded intracellularly with EGTA. Under these conditions, analysis of the voltage dependence of charge movement from four mdx fibers gave mean Boltzmann fit parameters of 24.2 ± 4.5 nC/μF, −29.6 ± 4.6 mV, and 15.3 ± 1.0 mV for Qmax, V0.5, and k respectively, not significantly different from the parameters obtained in the presence of intracellular EGTA.
Time course of charge movement recovery from the inactivated state
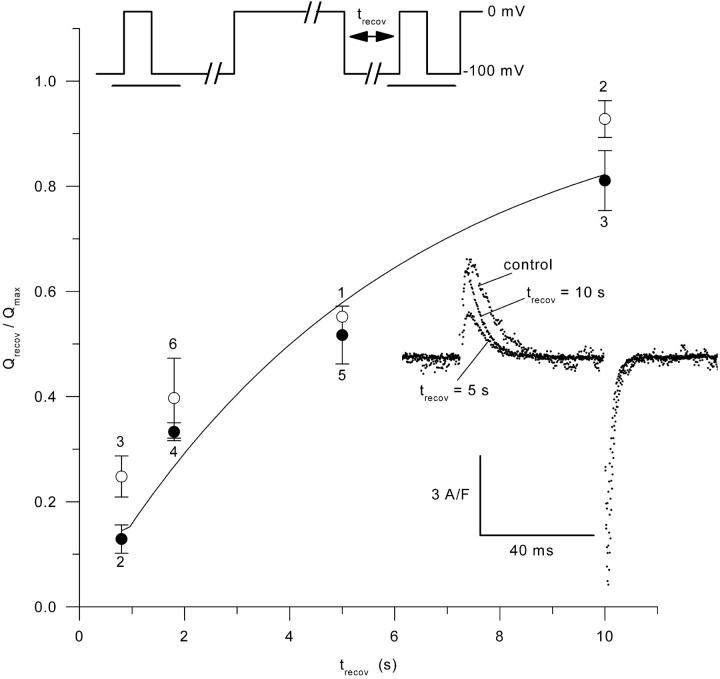
Inasmuch as subsarcolemmal [Ca2+] is a potent modulator of the inactivation of L-type calcium channels in various muscular preparations (for review, see McDonald et al., 1994), it was of interest to compare the transition between activated and inactivated states of the voltage sensors in control and mdx fibers. The pulse protocol shown on the top of Fig. 6 was used to study the time course of charge movement repriming from the inactivated state: after a 50-ms–long test pulse to 0 mV, fibers were repolarized at −100 mV for 100 ms and then depolarized to 0 mV for 30 s. The fibers were then repolarized to −100 mV for variable recovery times (trecov) followed by a second test pulse of 50-ms duration to 0 mV. Charge movement recovery was assessed from the ratio of the amount of “on” charge moved by the two test pulses. An illustrative example of charge movement traces before sustained depolarization, and after a 5- and a 10-s recovery time following sustained depolarization, are shown as Inset in Fig. 6. Traces were obtained from a control fiber. The dependence of the relative mean amount of reprimed charge upon the recovery time is shown on the graph of Fig. 6 for control (solid circles) and mdx fibers (open circles). There was no significant difference between control and mdx fibers for any of the recovery time tested. An exponential fit to the control and mdx data points gave time constants values of 6.0 s and 4.6 s, respectively. The solid curve superimposed to the data points corresponds to the result from fitting a single exponential function to all data points, including both control and mdx fibers, which gave a time constant of 5.1 s.
FIGURE 6.
Time course of charge movement recovery from the inactivated state in control (solid circles) and in mdx fibers (open circles). The number of fibers is indicated above or underneath each corresponding data point. The pulse protocol that was used is shown on the top of the graph: periods of time during which the corresponding membrane current was sampled are shown underlined. The graph shows the dependence of the amount of charge measured in response to a 50-ms duration pulse to 0 mV that followed a prolonged depolarized period, vs. the recovery time (trecov) that was allowed after the end of the prolonged depolarization. The amount of charge (Qrecov) was expressed relative to the value measured in response to the same test depolarization applied before the prolonged depolarizing period (Qmax). The solid line superimposed on the data points corresponds to the result from fitting a single exponential function to all data points. The inset shows illustrative charge movement records obtained in control and after a 5- and 10-s recovery time following the prolonged depolarization.
Calcium current in control and mdx fibers
When using a single microelectrode to voltage-clamp a restricted, but still relatively large, portion of a muscle cell as performed here, the voltage drop across residual series resistance during ionic current activation may cause the membrane potential to differ significantly from the applied command potential. Fig. 7 shows results from an experiment designed to probe the corresponding membrane voltage distortion under the conditions used here for calcium current measurements. For this, the silicone-free portion of a fiber was voltage-clamped in the presence of the 2.5-mM calcium-containing solution (see Solutions) and the membrane potential was measured with an additional microelectrode (see Methods). The experiment was performed on a fiber isolated from a Swiss OF1 adult mouse. To make the test under quite extreme conditions, a relatively important portion of fiber was left silicone-free, the capacitance and input resistance of which were 2 nF and 5 MΩ, respectively. Results should thus give an upper limit to the accuracy of membrane voltage control under the present experimental conditions. Fig. 7, A and B shows records of the changes in membrane potential and in membrane current elicited upon application of 1-s–long command voltage steps ranging between −60 mV and +40 mV, respectively. In Fig. 7 B, traces clearly show the typical slow activation and inactivation time course of the L-type calcium current. In Fig. 7 A, the simultaneously recorded membrane potential traces show no clear sign of strong nonlinearity during the pulses. This is looked at more closely in Fig. 7 C, which shows an enlarged view of the bottom portion and of the top portion of the membrane potential trace during the voltage-clamp step to −10 mV, which elicited the largest inward current. It shows that during the pulse the change in membrane potential was indeed larger at the time of the peak current than at the end of the pulse, the difference being, however, relatively small, ∼2.5 mV. Fig. 7 D shows the dependence of the change in membrane potential measured between the peak calcium current and the current at the end of the pulse, upon the corresponding measured change in membrane current. The superimposed continuous line corresponds to the result of a linear fit giving a slope of 205 kΩ. Overall, these results indicate that the voltage error due to residual series resistance is reasonably modest under our experimental conditions.
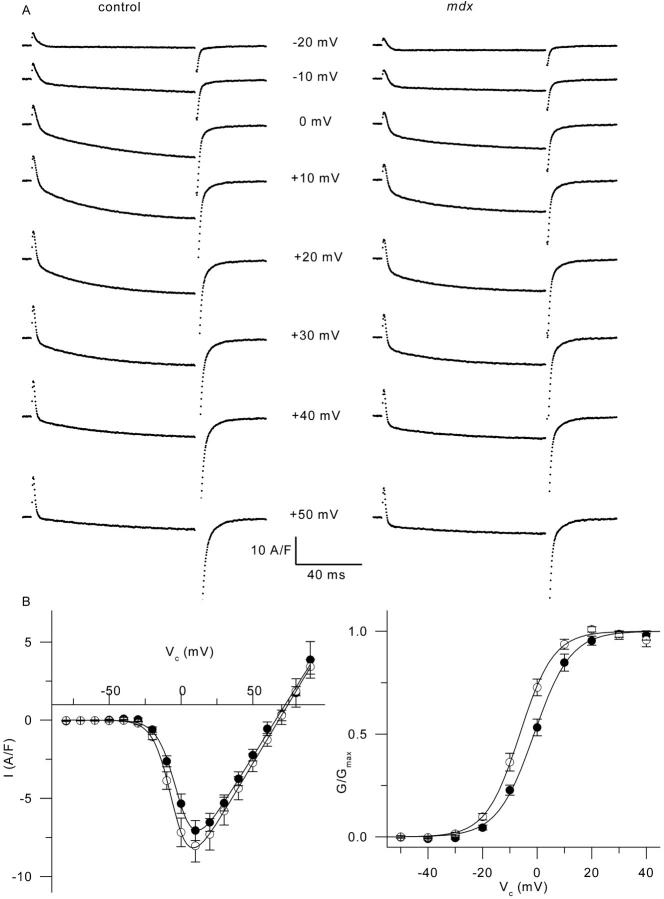
In control and in mdx fibers, we first examined the properties of the calcium current using relatively short depolarizing pulses that allow very stable recording conditions. In Fig. 8, A shows membrane current traces obtained in response to depolarizations of 100-ms duration to various levels in a control (left series of traces) and in an mdx muscle fiber (right series of traces). Traces were corrected for the linear components as described in Methods. At −10 mV, the “on” charge movement at the onset of the pulse was clearly followed by a small inward current. The maximal amplitude of this current increased for depolarizations to 0 and +10 mV, reaching a value of −14 A/F and −11 A/F at the end of the +10-mV pulse in the control fiber and in the mdx fiber, respectively. For higher values of membrane depolarization, the amplitude of the current decreased. In response to 100-ms depolarizations, the mean maximal amplitude of this current, measured as the mean current during the last 20 ms of the pulse, was −7.1 ± 0.6 A/F (n = 17) and −8 ± 1 A/F (n = 16) at +10 mV, in control and mdx fibers, respectively. In Fig. 8 B the left graph presents the mean voltage dependence of the current amplitude in control (solid circles) and in mdx fibers (open circles). The current-voltage relationship from each fiber was fitted using Eq. 3: mean values for Gmax, Vrev, V0.5, and k were 156 ± 15 S/F, 65.5 ± 2.9 mV, −0.76 ± 1.2 mV, and 6.2 ± 0.5 mV (n = 17), and 150 ± 18 S/F, 67.3 ± 2.7 mV, −6.2 ± 1.2 mV, and 5.7 ± 0.2 mV (n = 16) in control and mdx fibers, respectively. Mean values for V0.5 in control and mdx fibers were significantly different (p = 0.003). The right panel of Fig. 8 B illustrates the leftward shift of the voltage dependence of the calcium conductance in mdx fibers as compared to control fibers: a normalized G(V) curve was obtained from each fiber by dividing the I/V curve by Gmax(V − Vrev) (using the values of Gmax and Vrev obtained from the corresponding fit of the I/V curve). The graph shows the voltage dependence of the mean normalized conductance in control (solid circles) and in mdx fibers (open circles).
FIGURE 8.
Calcium current in control and mdx fibers. (A) The left and right panels show calcium current traces obtained in response to depolarizations to the indicated values of command potential, from a control and an mdx fiber, respectively. Large tail currents after the end of the pulses were truncated for best viewing of the current during the pulse. (B) The left graph shows the mean voltage dependence of the current amplitude in control (solid circles) and in mdx fibers (open circles). Current amplitude corresponds to the mean value over the last 20 ms of the pulses. For potential values between −80 mV and +50 mV, data points correspond to the mean value from 17 control and 16 mdx fibers; for membrane potentials more positive than +60 mV, at least eight control and 12 mdx values were available. The solid curve superimposed to each series of data points corresponds to the result from fitting Eq. 3 to the mean data points in control and in mdx fibers: corresponding values for Gmax, Vrev, V0.5, and k were 147 S/F, 66 mV, −1.5 mV, 6.5 mV, and 154 S/F, 68 mV, −5 mV, and 6.4 mV, respectively. The graph on the right shows the corresponding mean voltage dependence of the normalized calcium conductance in control (solid circles) and in mdx fibers (open circles). The result from fitting the mean data points with a Boltzmann function gave values for V0.5 and k of −1.1 mV and 6.7 mV, and −6.4 mV and 6.2 mV, in control and mdx fibers, respectively.
Barium currents through calcium channels
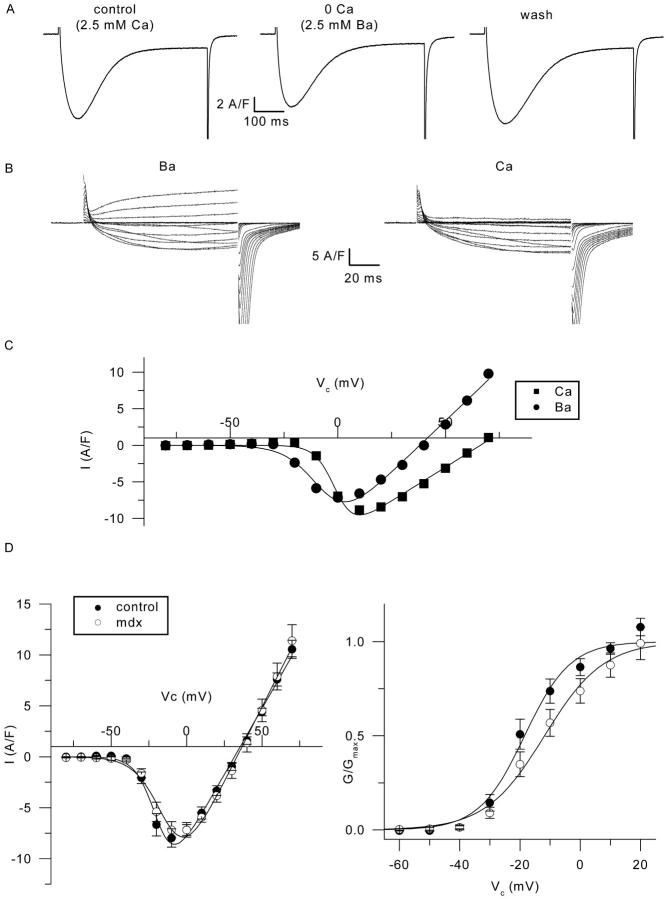
In a few experiments, we also examined the properties of the slow inward current in control and in mdx muscle fibers using barium as charge carrier. Fig. 9 A shows that substituting extracellular calcium by barium does not have any strong effect on the kinetics of the slow inward current, which is clearly different from what has been observed in frog muscle where the kinetics are accelerated under similar conditions (Almers and Palade, 1981; Blaineau et al., 1993). Fig. 9 B shows membrane current traces obtained in response to 100-ms-long depolarizations of increasing amplitude, recorded in the same fiber superfused either with the barium-containing solution (left) or with the calcium-containing solution (right). Fig. 9 C shows the corresponding voltage dependence of the current amplitude measured at the end of the pulses, in the presence of calcium (squares) and in the presence of barium (circles). The leftward shift of the voltage dependence of the peak current is in agreement with previous studies on frog skeletal muscle fibers, and accordingly is likely to result from surface charge effects (Cota and Stefani, 1984). The fact that the barium current reverses at more negative potentials than the calcium current suggests that the channel selectivity is higher for calcium than for barium (see, for instance, the review by McDonald et al., 1994). In Fig. 9 D, the left panel shows the mean current-to-voltage relationships obtained in the presence of extracellular barium from seven control fibers (solid circles) and six mdx fibers (open circles), in response to 100-ms-long depolarizations. Fitting the current voltage relationship from each fiber using Eq. 3 gave mean values for Gmax, Vrev, V0.5, and k of 260 ± 20 S/F, 31.7 ± 1.7 mV, −18.5 ± 2.4 mV, and 6.2 ± 0.7 mV, and 296 ± 19 S/F, 34.3 ± 3.3 mV, −11.5 ± 3.4 mV, and 8.6 ± 1.2 mV in control and mdx fibers, respectively. There was no significant difference in any parameter between the two batches (p ≥ 0.11). The right panel of Fig. 9 D shows the corresponding voltage dependence of the barium conductance in control and in mdx fibers.
FIGURE 9.
Barium currents through calcium channels in control and in mdx muscle fibers. (A) Effect of equimolar substitution of extracellular calcium by barium on the membrane current elicited by a 0.5-s-long depolarizing command pulse to 0 mV in a control fiber. (B) Membrane current traces recorded in response to depolarizing command pulses to values ranging between −80 and +70 mV in a control fiber bathed in the presence of extracellular barium (left) and after substituting barium for calcium (right). (C) Corresponding voltage dependence of the amplitude of the current measured at the end of the pulse in the presence of calcium (solid squares), and barium (solid circles). The solid curve superimposed to each series of data points corresponds to the result from fitting Eq. 3: corresponding values for Gmax, Vrev, V0.5, and k were 185.2 S/F, 66.1 mV, −0.78 mV, 4.5 mV, and 281.9 S/F, 38.0 mV, −6.5 mV, and 7.5 mV in the presence of calcium and barium, respectively. (D) (Left) Mean current-to-voltage relationship of the barium current obtained from seven control fibers (solid circles) and six mdx fibers (open circles). The solid curve superimposed on each series of data points corresponds to the result from fitting Eq. 3 to the mean data points in control and in mdx fibers: corresponding values for Gmax, Vrev, V0.5, and k were 259 S/F, 31.7 mV, −18.6 mV, 6.5 mV, and 294 S/F, 33.3 mV, −12.1 mV, and 8.9 mV, respectively. (Right) This shows the corresponding mean voltage dependence of the normalized barium conductance. The result from fitting the mean data points with a Boltzmann function gave values for V0.5 and k of −18.5 mV and 7.5 mV, and −11.9 mV and 9.7 mV in control and mdx fibers, respectively.
Calcium currents in response to long (1.5-s) depolarizations
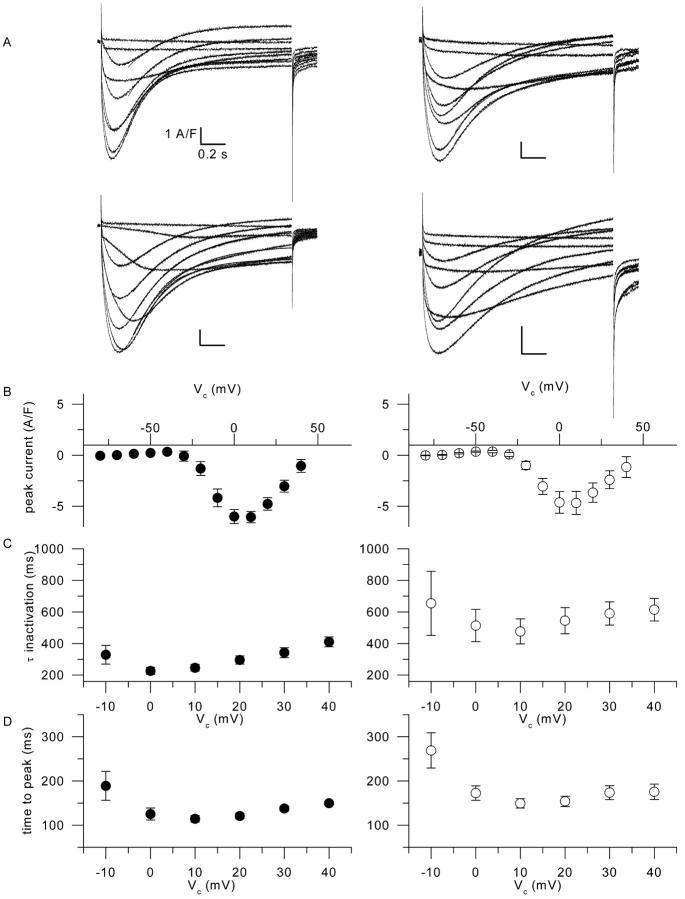
Fig. 10 A shows membrane current traces obtained in response to membrane depolarizations ranging between −40 and +40 mV with a 10-mV increment, in two control fibers (left series of traces) and in two mdx fibers (right series of traces). These two sets of control and mdx traces were selected to illustrate the variability of the time course of the calcium current in the two populations. Overall, it shows that during such long-lasting depolarizations, the time course of the current measured in control and in mdx fibers exhibited qualitatively similar properties, with, in particular, a very slow decay rate as classically described in this preparation. It may be noticed that for the most depolarized levels, the end-pulse current tended to be outward both in control and in mdx fibers. We believe this to result from slight errors in the leak correction although we cannot completely rule out the possible contribution of residual slow outward contaminating potassium currents. In all four series of traces, for command potential values more depolarized than −20 mV, the decaying phase of the current was fitted with a single exponential function. The result of the fit is shown, in each case, superimposed on the corresponding trace. In Fig. 10 A, values for the time constant of decay in the two control fibers ranged within 170–300 ms (top series of traces), and 260–410 ms (bottom series of traces). In the two mdx fibers values for the time constant ranged within 320–540 ms (top series of traces) and 520–1300 ms (bottom series of traces). Panels B, C, and D in Fig. 10 show the voltage dependence of the mean peak current, mean time constant of current decay, and mean time to peak of the current in control (solid circles, n = 6) and in mdx fibers (open circles, n = 8), measured from experiments performed under these same conditions, respectively. Mean values for the peak current were not significantly different between the two populations (p ≥ 0.33), though it may be noticed that the scattering was larger in the mdx batch. In the control fibers the voltage dependence of the time constant of current decay was clearly U-shaped. In mdx, the U-shape was less obvious but the scattering of the data was definitely larger than in control. Between 0 and +40 mV, mean values for the time constant of decay were, nevertheless, significantly larger in mdx fibers than in control fibers (p ≤ 0.04). Finally, Fig. 10 D shows that the mean values for the time to peak of the current were also larger in mdx than in control fibers, the difference being, however, significant only for command voltage values of +10 and +20 mV (p ≤ 0.04).
FIGURE 10.
Calcium current in control and in mdx fibers in response to 1.5-s-long depolarizations. (A) Calcium current records obtained in response to 1.5-s-long depolarizing pulses to values between −40 and +40 mV in two control fibers (left traces) and in two mdx fibers (right traces). Superimposed curves correspond to the result from fitting a single exponential function to the decaying phase of the current. (B) Mean voltage dependence of the peak current amplitude from six control fibers (left) and eight mdx fibers (right) obtained under the same conditions as in A. (C) corresponding mean values for the time constant of calcium current inactivation in control fibers (left) and in mdx fibers (right). (D) Corresponding mean values for the time to peak of the calcium current.
Fig. 11 illustrates results from a series of measurements designed to get insights into the voltage dependence of calcium current inactivation in control and in mdx muscle fibers. For this, a 1.5-s-long prepulse of increasing amplitude was followed by a 200-ms repolarization to −100 mV, and a subsequent test pulse to −10 mV was applied to test the remaining availability of the channels. Fig. 11 B shows example current traces for seven different prepulse amplitudes in a control fiber. Fig. 11 C shows the mean values for fractional inactivation of the current in control fibers (solid circles, n = 6) and in mdx fibers (open circles, n = 4). Again, no striking difference could be detected in the mdx fibers as compared to control, the potential at half-maximum inactivation potential being ∼−20 mV in both populations.
FIGURE 11.
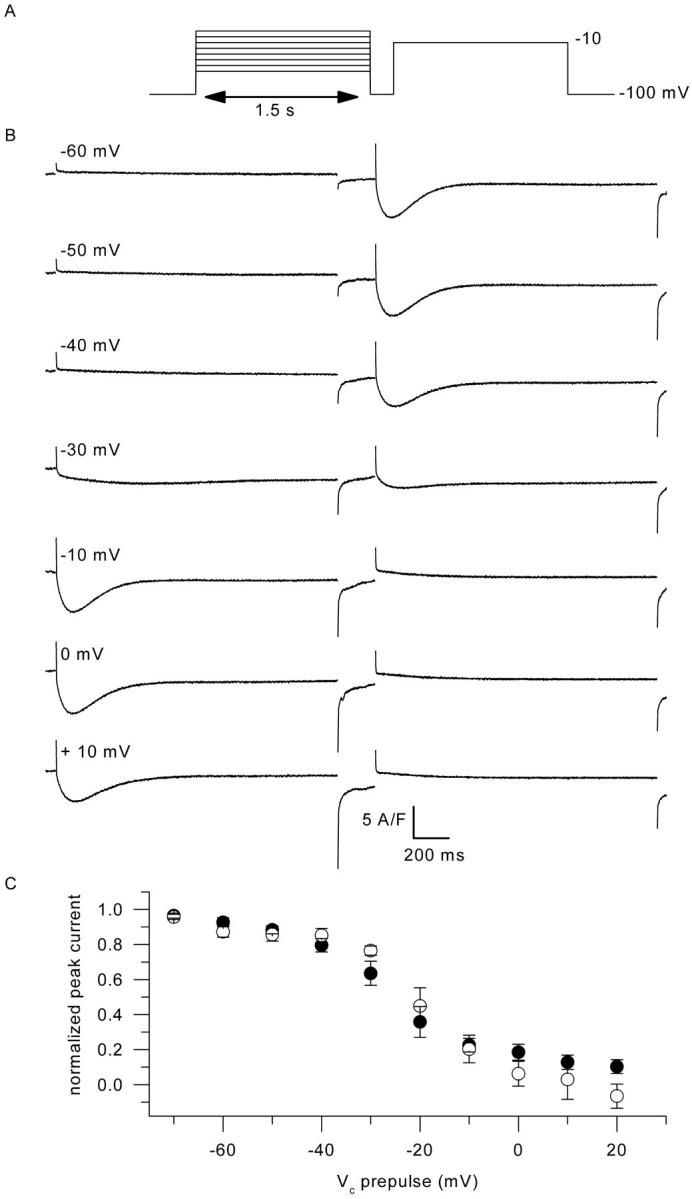
Inactivation of the calcium current by a preceding depolarization in control and in mdx fibers. (A) Pulse protocol. (B) Membrane current traces obtained in response to the protocol shown in (A) in a control fiber. (C) Dependence of the mean normalized peak current measured in response to the test pulse upon the command voltage during the preceding depolarization, in control fibers (solid circles, n = 6) and in mdx fibers (open circles, n = 4).
DISCUSSION
The present results demonstrate that the silicone voltage-clamp technique can be readily used to measure intramembrane charge movement and L-type calcium current in isolated skeletal muscle fibers. Use of this technique allowed us to confirm and complement the results from Hollingworth et al. (1990a), regarding the absence of detectable modification of the properties of intramembrane charge movement in the mdx mouse model. In addition, we provide the first comparison of the voltage-dependent slow calcium current between control and mdx muscle fibers, and show that slight modifications of some of its properties can be detected in this pathologic model.
Properties of intramembrane charge movement
If referring solely to previous works performed specifically on mammalian preparations, intramembrane charge movement has been recorded in fast-twitch skeletal muscle fibers using either the three microelectrodes voltage-clamp technique (Dulhunty et al. 1987; Dulhunty and Gage, 1983; Hollingworth et al., 1990a,b; Hollingworth and Marshall, 1981; Simon and Beam, 1985), or Vaseline-gap techniques (Delbono, 1992; Lamb, 1986; Lamb and Walsh, 1987; Szentesi et al., 1997). Although there is some variability in the Boltzmann distribution parameters of charge movement within these different studies, the values that we report here for Qmax, V0.5, and k are well within the range of values reported by these authors. For instance, the Qmax of 23 nC/μF is similar to the values of 23.4 nC/μF, 20.6 nC/μF, 28.5 nC/μF, and 26.1 nC/μF reported by Dulhunty and Gage (1983), Dulhunty et al. (1987), Simon and Beam (1985), and Szentesi et al. (1997), respectively. Our value of 13 mV for k also fits well within the previously reported values which lie between 8.7 mV for the lowest (Simon and Beam, 1985), and 17 mV for the highest (Szentesi et al., 1997). A similar conclusion could be drawn when comparing our value of −37 mV for V0.5 to the previously published data, although values ∼15–25 mV more positive were reported by several groups (Hollingworth et al., 1990b; Hollingworth and Marshall, 1981; Dulhunty and Gage, 1983, Lamb, 1986). Specific differences in the experimental conditions and/or in the muscle types that were used are likely to be responsible for some of the observed discrepancies, but no attempt will be made here to explore in detail the potential experimental parameters responsible for these differences. Within the present context, results from a recent study by Wang et al. (1999) are also worth mentioning, inasmuch as these authors measured intramembrane charge movement with the patch-clamp technique in the same muscle fiber preparation as we did, i.e., enzymatically isolated skeletal muscle fibers from the mouse flexor digitorum muscles. As compared to our results, Wang et al. (1999) reported a substantially higher maximal amount of charge (∼40 nC/μF), a less negative midpoint voltage (−18 mV), and a lower steepness factor (∼7 mV). We have no straightforward explanation for these differences; again, they may be speculated to be due to specific differences in the experimental procedures, as, for instance, the respective distinct composition of the external and intrapipette solutions used in the two studies.
The time course of charge decay could in most cases be well fitted by a single exponential, the time constant of which had the expected bell-shaped voltage dependence. The maximum time constant was ∼6 ms, consistent with the values reported by Hollingworth and Marshall (1981), Simon and Beam (1985), and Szentesi et al. (1997).
Prolonged membrane depolarization is well known to produce immobilization of charge movement, a process that can be reversed upon membrane repolarization. In frog muscle, the time course of charge movement repriming from the immobilized state was reported to follow a single exponential time course with a time constant of ∼20–50 s at 1–2°C (Chandler, Rakowski, and Schneider, 1976). According to Gonzalez and Caputo (1996), at 15°C, the time course of charge movement repriming in frog muscle is biexponential with time constants of 4.2 and 25 s. In addition, these authors found the repriming kinetics to be temperature dependent, with Q10 values of 1.7 and 7.1 above and below 11.5°C, respectively. There is, to our knowledge, no available estimation of the time constant of charge movement recovery in mammalian skeletal muscle. Our results could be described by a single exponential time course of recovery, the rate of which (τ ≈ 6 s) would be of the same order of magnitude to what was reported in frog muscle, taking into account the effects of temperature.
Overall, these results establish the potency of our method for characterizing the properties of intramembrane charge movement in enzymatically isolated skeletal muscle fibers, and thus, for comparing its properties between different batches of muscle fibers.
Charge movement in mdx fibers
Hollingworth et al. (1990a) showed that in fibers isolated from the extensor digitorum longus muscles of mdx mice aged 8–10 months, there was no significant difference in the amount of charge moved between −70 mV and −30 mV, as compared to control fibers. With the present data, we were able to explore the properties of charge movement over a wider range of membrane potentials and to provide values for the parameters of the corresponding Boltzmann distribution. Nevertheless, we come to an identical conclusion regarding all aspects of charge movement examined here, in muscle fibers isolated from mdx mice that were within the age period (3–8 weeks) at which massive muscle degeneration occurs. It is thus quite certain that the pathologic consequences of the absence of dystrophin are not conveyed to any alteration in the voltage-dependent steps of excitation-to-contraction coupling. Conversely, it should also be concluded that the chronically elevated subsarcolemmal Ca2+ level found in mdx muscle (Mallouk et al., 2000) is either not sufficiently high to alter the properties of charge movement, or that its consequences are too slight to be reliably detected. According to Shirokova and Rios (1996), the effects of intracellular calcium on charge movement in frog skeletal muscle are consistent with being mediated through an increase in the electrical potential near the voltage sensors, due to Ca2+ binding to two intracellular sites, one of these exhibiting a high affinity for Ca2+ (KD less than 100 nM), within the range of commonly accepted values for resting [Ca2+]. As resting submembranous [Ca2+] is elevated by a factor of ∼3 in mdx muscle (Mallouk et al., 2000), this should be expected to significantly increase the occupancy of these high affinity sites, and consequently enhance charge transfer. It may be that the experimental conditions used here somehow either prevented or reduced the subsarcolemmal Ca2+ load observed in the mdx fibers (Mallouk et al., 2000). One should also consider the possibility that the elevated Ca2+ level is restricted to extrajunctional areas, whereas charge movement is thought to mostly originate from the junctional membrane (see, for instance, Lamb, 1986). Alternatively, inasmuch as [Ca2+] is believed to be elevated in the triadic junction due to the constant leak of calcium from the SR, any additional calcium flux in the mdx muscle might not cause a significant alteration of [Ca2+] within this area.
Calcium current in control and mdx fibers
In the presence of extracellular calcium, depolarizations above −20 mV clearly elicited the flow of a slow inward current which peaked at ∼+10 mV, reversed at potentials more positive than +50 mV, and could also be carried by barium ions. It thus with no doubt corresponds to calcium influx through the slow L-type calcium channels, already widely described in skeletal muscle (for a recent review, see Melzer et al., 1995). Qualitatively, the current records looked similar in control and in mdx fibers, but the analysis revealed several significant differences. Mean results from the current voltage relationships obtained in response to short pulses showed that, in mdx fibers, the midpoint voltage of calcium current activation was shifted by ∼−5 mV as compared to control fibers. From experiments with longer pulses, we found that the time to peak of the current was slightly elevated in the mdx fibers (of ∼30%) and that the time course of current decay was slower (by a factor of ∼1.5–2) as compared to the values obtained in control fibers. The negative shift of current activation is quite surprising in view of the absence of a similar change in the voltage dependence of charge movement. This has to indicate that this effect is not related to a simple membrane voltage shift, due for instance to a surface charge effect, which one would expect to similarly affect the two processes. On the other hand, in skeletal muscle, a certain number of various experimental conditions had already been shown to differentially affect voltage sensors and functional calcium channels (see Rios and Pizarro, 1991). Interestingly and along this line, Delbono et al. (1997) reported that insulin-like growth factor-1 (IGF-1) produces a leftward shift of the voltage dependence of calcium current, without affecting the voltage distribution of charge movement. Although speculative, this may be a source of explanation for the effect observed here, inasmuch as muscles from 8- to 10-week-old mdx mice were found to contain a significantly higher content of IGF-1 than control muscles (DeLuca et al., 1999). However, the fact that the voltage dependence of the current was very similar between control and mdx muscle fibers in the presence of extracellular barium would require assuming that extracellular calcium is needed for IGF-1 to be effective.
Concerning the time course of current inactivation, the time constant of current decay in control fibers had a clear U-shaped dependence upon voltage, as recently reported by Szentesi et al. (2001) in rat fibers, with the fastest decay rates being observed near the peak of the I/V curve. This is likely to reflect the existence of a current-dependent inactivation process that may be related to t-tubular calcium depletion as suggested by Friedrich et al. (1999) in a similar preparation. This does not rule out the possible concomitant development of voltage-dependent inactivation, and indeed, in two control fibers, when applying a two-pulses protocol as in Fig. 11 but with a longer (7-s) duration prepulse, we were able to observe a very substantial suppression of the calcium current during the test pulse over a range of prepulse potentials that did not produce any detectable calcium entry (data not shown). Under our conditions, calcium current inactivation thus certainly results from several processes, the detailed respective physical basis and relative contribution of which remain to be solved. Within this context it is hard to speculate about the reasons that make the calcium current decay to be slowed in the mdx fibers. In addition we cannot completely exclude the possibility that, despite the presence of 140 mM TEA and 1 mM 4-AP in the extracellular solution, this effect may, at least in part, be due to a residual-contaminating slow outward potassium current, the contribution of which would be different in mdx fibers than in control fibers. Also, it may be of interest to consider the possibility that the large scattering of the mdx time constant data (Fig. 10 C, right) could result from the existence of different subpopulations of fibers exhibiting more or less impaired calcium current inactivation properties as a consequence of distinct pathophysiological conditions. As evidence was previously given for potential direct or indirect modulation of the gating properties of various ion channels by the cytoskeleton (e.g., Johnson and Byerly, 1993; Maltsev and Undrovinas, 1997) one could speculate that changes in the sub-t-tubule membrane cytoskeleton network arrangement, due to the absence of dystrophin, may be responsible for the observed changes in the properties of the L-type current in mdx fibers. It should be mentioned, though, that it is not clear whether dystrophin is solely associated with the surface plasma membrane (Byers et al., 1991; Ohlendieck et al., 1991) or also with the t-tubule membrane (Knudson et al., 1988; Watkins et al., 1988). From a more general point of view, we believe that the modifications of the calcium current that we report here are unlikely to be responsible for the defective submembranous calcium regulation in mdx fibers (Mallouk et al., 2000), but, rather, may have to be regarded as a consequence of the physiological state of the pathologic fibers. Whatever their exact underlying reasons, our results at least tend to exclude the possibility that dystrophin-deficient fibers suffer from intracellular calcium overload due to severely impaired function of the L-type calcium channels.
Acknowledgments
We thank Drs. B. Allard, C. Ojeda, and O. Rougier for comments on the manuscript.
This study was supported by Centre National de la Recherche Scientifique and Université Claude Bernard.
References
- Almers, W., and P. T. Palade. 1981. Slow calcium and potassium currents across frog muscle membrane: Measurements with a vaseline-gap technique. J. Physiol. (Lond.). 312:159–176. [DOI] [PMC free article] [PubMed] [Google Scholar]
- Byers, T. J., L. M. Kunkel, and S. C. Watkins. 1991. The subcellular distribution of dystrophin in mouse skeletal, cardiac, and smooth muscle. J. Cell Biol. 115:411–421. [DOI] [PMC free article] [PubMed] [Google Scholar]
- Blaineau, S., V. Jacquemond, B. Allard, J. Amsellem, M. J. Moutin, and O. Rougier. 1993. Inward barium current and excitation-contraction coupling in frog twitch muscle fibres. J. Muscle Res. Cell Motil. 14:158–166. [DOI] [PubMed] [Google Scholar]
- Balog, E. M., and E. M. Gallant. 1999. Modulation of the sarcolemmal L-type current by alteration in SR Ca2+ release. Am. J. Physiol. 276:C128–C135. [DOI] [PubMed] [Google Scholar]
- Brum, G., and E. Rios. 1987. Intramembrane charge movement in frog skeletal muscle fibres. Properties of charge 2. J. Physiol. (Lond.). 387:489–517. [DOI] [PMC free article] [PubMed] [Google Scholar]
- Carnwath, J. W., and D. M. Shotton. 1987. Muscular dystrophy in the mdx mouse: Histopathology of the soleus and extensor digitorum longus muscles. J. Neurol. Sci. 80:39–54. [DOI] [PubMed] [Google Scholar]
- Chandler, W. K., R. F. Rakowski, and M. F. Schneider. 1976. Effects of glycerol treatment and maintained depolarization on charge movement in skeletal muscle. J. Physiol. (Lond.). 254:285–316. [DOI] [PMC free article] [PubMed] [Google Scholar]
- Collet, C., B. Allard, Y. Tourneur, and V. Jacquemond. 1999. Intracellular calcium signals measured with indo-1 in isolated skeletal muscle fibres from control and mdx mice. J. Physiol. (Lond.). 520:417–429. [DOI] [PMC free article] [PubMed] [Google Scholar]
- Cota, G., and E. Stefani. 1984. Saturation of calcium channels and surface charge effects in skeletal muscle of the frog. J. Physiol. (Lond.). 351:135–154. [DOI] [PMC free article] [PubMed] [Google Scholar]
- Delbono, O. 1992. Calcium current activation and charge movement in denervated mammalian skeletal muscle fibres. J. Physiol. (Lond.). 451:187–203. [DOI] [PMC free article] [PubMed] [Google Scholar]
- Delbono, O., M. Renganathan, and M. L. Messi. 1997. Regulation of mouse skeletal muscle L-type Ca2+ channel by activation of the insulin-like growth factor-1 receptor. J. Neurosci. 17:6918–6928. [DOI] [PMC free article] [PubMed] [Google Scholar]
- De Luca, A., S. Pierno, C. Camerino, D. Cocchi, and D. C. Camerino. 1999. Higher content of insulin-like growth factor-I in dystrophic mdx mouse: Potential role in the spontaneous regeneration through an electrophysiological investigation of muscle function. Neuromuscul. Disord. 9:11–18. [DOI] [PubMed] [Google Scholar]
- DiMario, J. X., A. Uzman, and R. C. Strohman. 1991. Fiber regeneration is not persistent in dystrophic (MDX) mouse skeletal muscle. Dev. Biol. 148:314–321. [DOI] [PubMed] [Google Scholar]
- Dulhunty, A. F., and P. W. Gage. 1983. Asymmetrical charge movement in slow- and fast-twitch mammalian muscle fibres in normal and paraplegic rats. J. Physiol. (Lond.). 341:213–231. [DOI] [PMC free article] [PubMed] [Google Scholar]
- Dulhunty, A. F., P. W. Gage, and G. D. Lamb. 1987. Potassium contractures and asymmetric charge movement in extensor digitorum longus and soleus muscles from thyrotoxic rats. J. Muscle Res. Cell Motil. 8:289–296. [DOI] [PubMed] [Google Scholar]
- Feldmeyer, D., W. Melzer, B. Pohl, and P. Zollner. 1993. A possible role of sarcoplasmic Ca2+ release in modulating the slow Ca2+current of skeletal muscle. Pflugers Arch. 425:54–61. [DOI] [PubMed] [Google Scholar]
- Friedrich, O., T. Ehmer, and R. H. Fink. 1999. Calcium currents during contraction and shortening in enzymatically isolated murine skeletal muscle fibres. J. Physiol. (Lond.). 517:757–770. [DOI] [PMC free article] [PubMed] [Google Scholar]
- Gillis, J. M. 1999. Understanding dystrophinopathies: An inventory of the structural and functional consequences of the absence of dystrophin in muscles of the mdx mouse. J. Muscle Res. Cell Motil. 20:605–625. [DOI] [PubMed] [Google Scholar]
- Gonzalez, A., and C. Caputo. 1996. The effect of temperature on charge movement repriming in amphibian skeletal muscle fibers. Am. J. Physiol. 270:C892–C897. [DOI] [PubMed] [Google Scholar]
- Hollingworth, S., and M. W. Marshall. 1981. A comparative study of charge movement in rat and frog skeletal muscle fibres. J. Physiol. (Lond.). 321:583–602. [DOI] [PMC free article] [PubMed] [Google Scholar]
- Hollingworth, S., M. W. Marshall, and E. Robson. 1990a. Excitation contraction coupling in normal and mdx mice. Muscle Nerve. 13:16–20. [DOI] [PubMed] [Google Scholar]
- Hollingworth, S., M. W. Marshall, and E. Robson. 1990b. The effects of tetracaine on charge movement in fast twitch rat skeletal muscle fibres. J. Physiol. (Lond.). 421:633–644. [DOI] [PMC free article] [PubMed] [Google Scholar]
- Horowicz, P., and M. F. Schneider. 1981. Membrane charge movement in contracting and non-contracting skeletal muscle fibres. J. Physiol. (Lond.). 314:565–593. [DOI] [PMC free article] [PubMed] [Google Scholar]
- Jacquemond, V. 1997. Indo-1 fluorescence signals elicited by membrane depolarization in enzymatically isolated mouse skeletal muscle fibers. Biophys. J. 73:920–928. [DOI] [PMC free article] [PubMed] [Google Scholar]
- Jacquemond, V., C. Collet, and L. Csernoch. 2002. Intramembrane charge movement and L-type calcium current in skeletal muscle fibers isolated from control and mdx mice. Biophys. J. 82:78a. (Abstr.) [DOI] [PMC free article] [PubMed] [Google Scholar]
- Johnson, B. D., and L. Byerly. 1993. A cytoskeletal mechanism for Ca2+ channel metabolic dependence and inactivation by intracellular Ca2+. Neuron. 10:797–804. [DOI] [PubMed] [Google Scholar]
- Knudson, C. M., E. P. Hoffman, S. D. Kahl, L. M. Kunkel, and K. P. Campbell. 1988. Evidence for the association of dystrophin with the transverse tubular system in skeletal muscle. J. Biol. Chem. 263:8480–8484. [PubMed] [Google Scholar]
- Lamb, G. D. 1986. Asymmetric charge movement in contracting muscle fibres in the rabbit. J. Physiol. (Lond.). 376:63–83. [DOI] [PMC free article] [PubMed] [Google Scholar]
- Lamb, G. D., and T. Walsh. 1987. Calcium currents, charge movement, and dihydropyridine binding in fast- and slow-twitch muscles of rat and rabbit. J. Physiol. (Lond.). 393:595–617. [DOI] [PMC free article] [PubMed] [Google Scholar]
- Mallouk, N., V. Jacquemond, and B. Allard. 2000. Elevated subsarcolemmal Ca2+ in mdx mouse skeletal muscle fibers detected with Ca2+-activated K+ channels. Proc. Natl. Acad. Sci. USA. 97:4950–4955. [DOI] [PMC free article] [PubMed] [Google Scholar]
- Maltsev, V. A., and A. I. Undrovinas. 1997. Cytoskeleton modulates coupling between availability and activation of cardiac sodium channel. Am. J. Physiol. 273:H1832–H1840. [DOI] [PubMed] [Google Scholar]
- McDonald, T. F., S. Pelzer, W. Trautwein, and D. J. Pelzer. 1994. Regulation and modulation of calcium channels in cardiac, skeletal, and smooth muscle cells. Physiol. Rev. 74:365–507. [DOI] [PubMed] [Google Scholar]
- Melzer, W., A. Herrmann-Frank, and H. C. Luttgau. 1995. The role of Ca2+ ions in excitation-contraction coupling of skeletal muscle fibres. Biochim. Biophys. Acta. 1241:59–116. [DOI] [PubMed] [Google Scholar]
- Ohlendieck, K., J. M. Ervasti, J. B. Snook, and K. P. Campbell. 1991. Dystrophin-glycoprotein complex is highly enriched in isolated skeletal muscle sarcolemma. J. Cell Biol. 112:135–148. [DOI] [PMC free article] [PubMed] [Google Scholar]
- Rios, E., and G. Pizarro. 1991. Voltage sensor of excitation-contraction coupling in skeletal muscle. Physiol. Rev. 71:849–908. [DOI] [PubMed] [Google Scholar]
- Schneider, M. F., and W. K. Chandler. 1973. Voltage dependent charge movement of skeletal muscle: A possible step in excitation-contraction coupling. Nature. 242:244–246. [DOI] [PubMed] [Google Scholar]
- Shirokova, N., and E. Rios. 1996. Caffeine enhances intramembranous charge movement in frog skeletal muscle by increasing cytoplasmic Ca2+ concentration. J. Physiol. (Lond.). 493:341–356. [DOI] [PMC free article] [PubMed] [Google Scholar]
- Simon, B. J., and K. G. Beam. 1985. Slow charge movement in mammalian skeletal muscle. J. Gen. Physiol. 85:1–19. [DOI] [PMC free article] [PubMed] [Google Scholar]
- Stroffekova, K., and J. A. Heiny. 1997. Triadic Ca2+ modulates charge movement in skeletal muscle. Gen. Physiol. Biophys. 16:59–77. [PubMed] [Google Scholar]
- Szentesi, P., C. Collet, S. Sarkozi, C. Szegedi, I. Jona, V. Jacquemond, L. Kovacs, and L. Csernoch. 2001. Effects of dantrolene on steps of excitation-contraction coupling in mammalian skeletal muscle fibers. J. Gen. Physiol. 118:355–375. [DOI] [PMC free article] [PubMed] [Google Scholar]
- Szentesi, P., V. Jacquemond, L. Kovacs, and L. Csernoch. 1997. Intramembrane charge movement and sarcoplasmic calcium release in enzymatically isolated mammalian skeletal muscle fibres. J. Physiol. (Lond.). 505:371–384. [DOI] [PMC free article] [PubMed] [Google Scholar]
- Wang, Z. M., M. L. Messi, and O. Delbono. 1999. Patch-clamp recording of charge movement, Ca2+ current, and Ca2+ transients in adult skeletal muscle fibers. Biophys. J. 77:2709–2716. [DOI] [PMC free article] [PubMed] [Google Scholar]
- Watkins, S. C., E. P. Hoffman, H. S. Slayter, and L. M. Kunkel. 1988. Immunoelectron microscopic localization of dystrophin in myofibres. Nature. 333:863–866. [DOI] [PubMed] [Google Scholar]


